
Background:
Someone inquired if I had done any comparisons of the measurements from a Dragy compared with a Cobb Accessport, “why yes I have.”
A couple of years ago when I was comparing the APR closed intake with a modified stock intake using street acceleration times as the characteristic of interest I used both a Dragy and AP to record the acceleration times and then compared the two in order to see how well they matched one another.
Dataloggers:
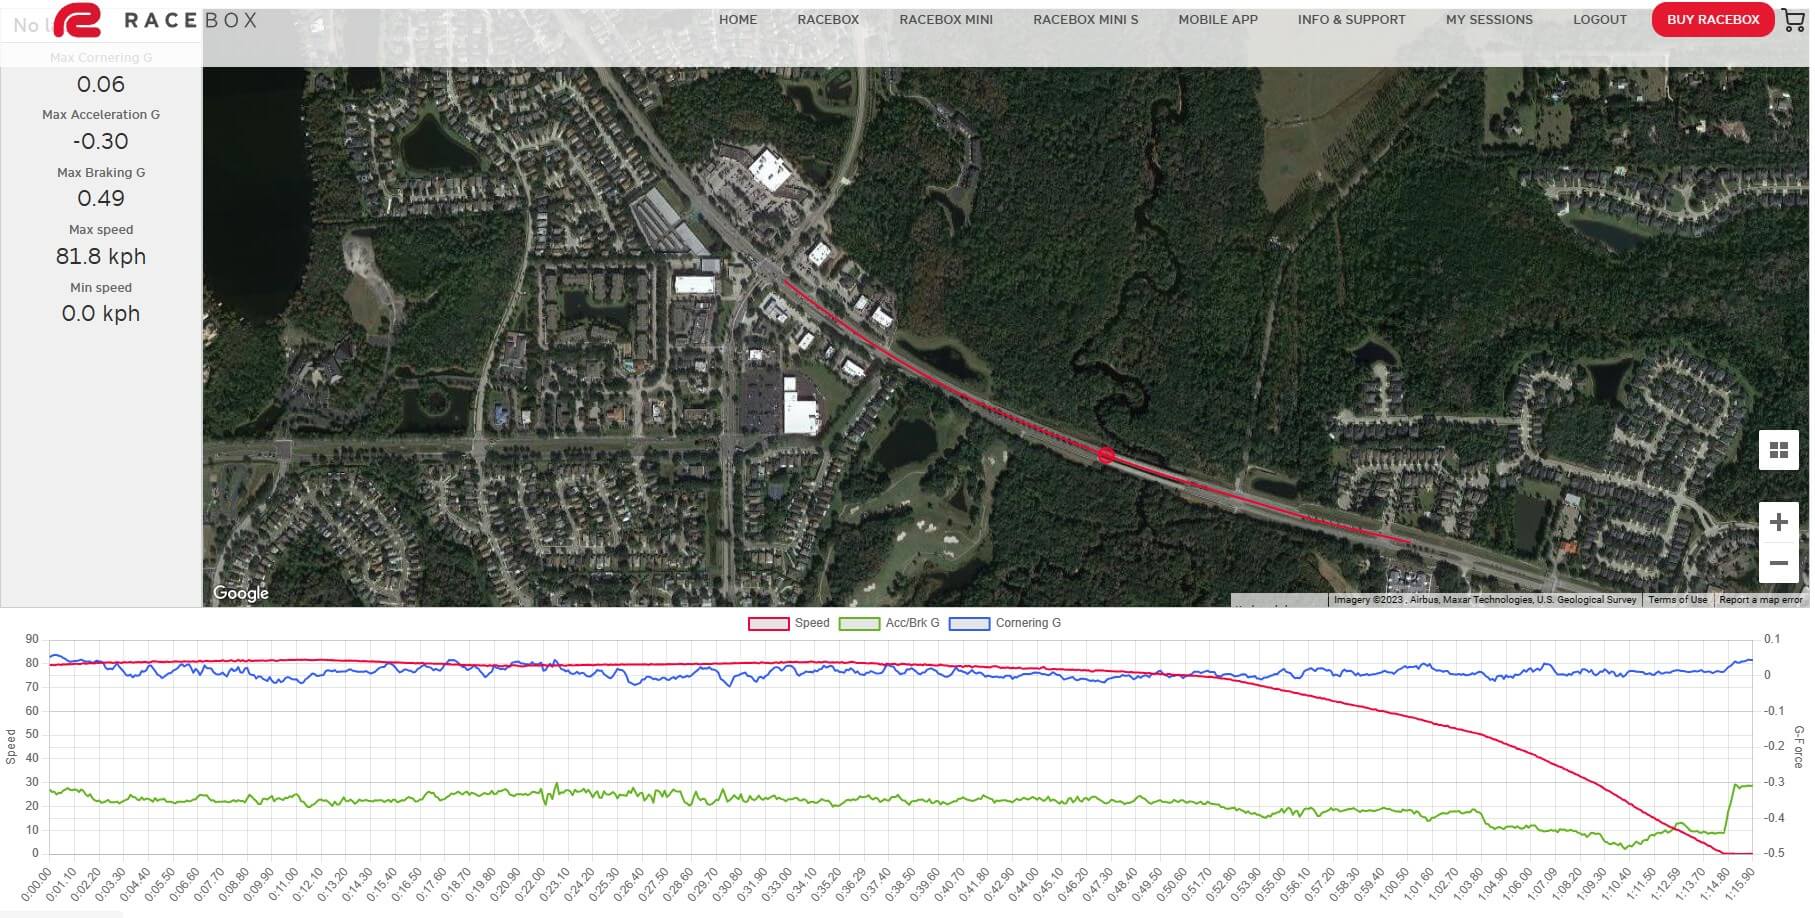
Note: Another data logger I use is the Racebox. It’s a pretty cool gadget with the same functionality as the Dragy, with some additional capabilities that I like, most notably that it records the vehicle position.

Racebox allows the data to be uploaded for display on charts, over as an overlay of a map.
Back to the subject of Dragy and the Accessport.
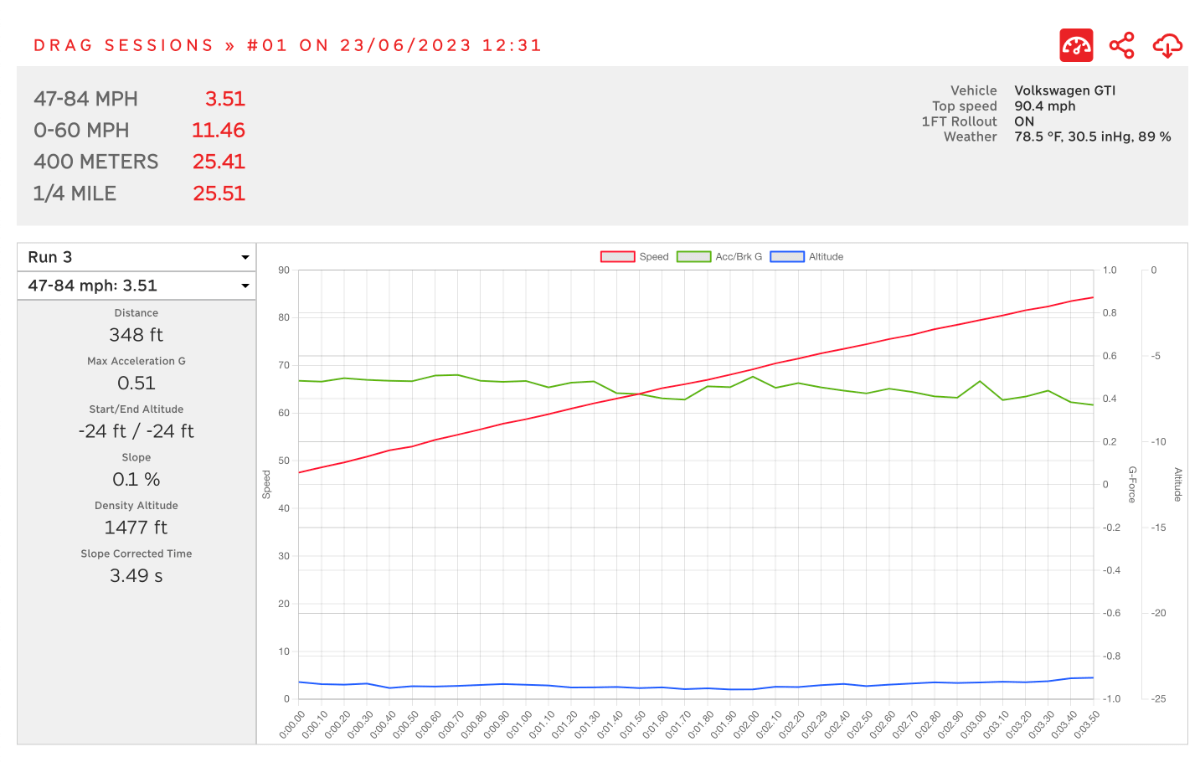
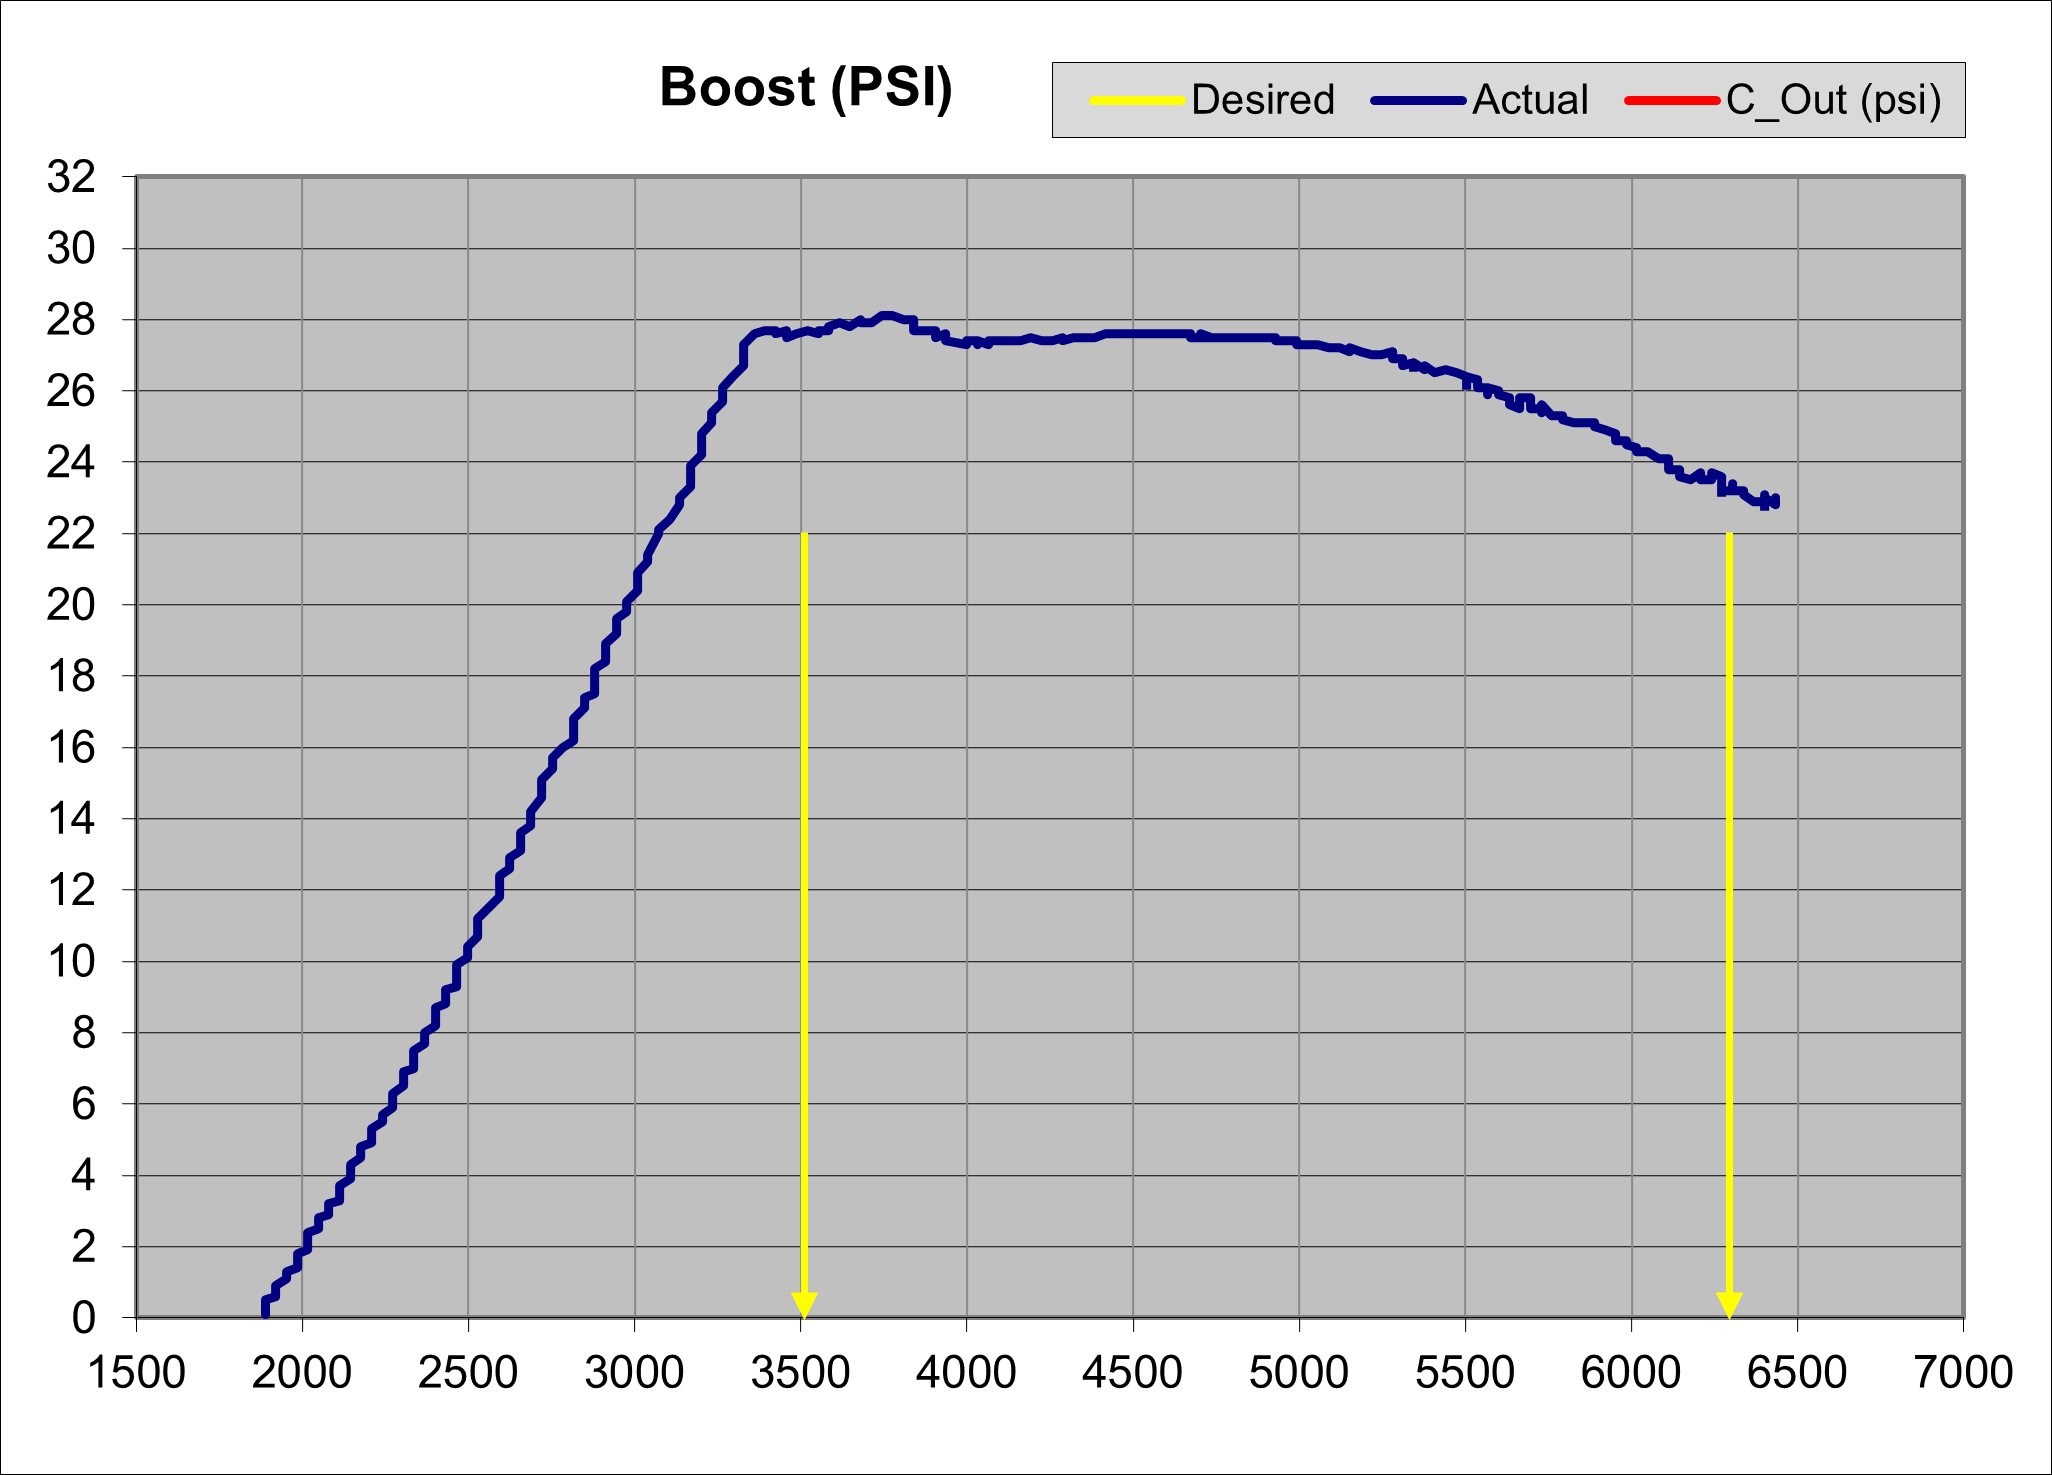
I chose 47 and 84 mph to bound the custom speed range because these vehicle speeds correspond to engine speeds of approximately 3500 to 6300 (with the GTI DQ250 DSG transmission) and I thought that was a good portion of the engine operating range to use as a benchmark.
Data Comparison:
During the comparison of the intakes, I made 34 pulls, with a summary of measurement device data shown below.

Note: Since the type of air intake was changed, it was not unexpected for the means and averages logged by each device to be different for EACH DEVICE. The number of data points is the value of most interest, though it is interesting that the results for each intake were similar, as indicated by the small standard deviation.
Differences between each sample recorded by the Dragy and the Accessport are calculated and the summary results for the differences are shown below:
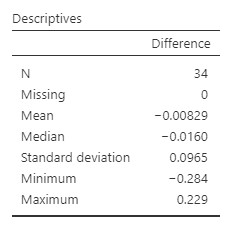
Notable from this summary is that the mean difference in times is 0.008 seconds, and the median difference in times is 0.016 seconds. Using either descriptive statistic, the differences in the “average” times were, in my opinion, quite small.
Next is a Boxplot of difference values:
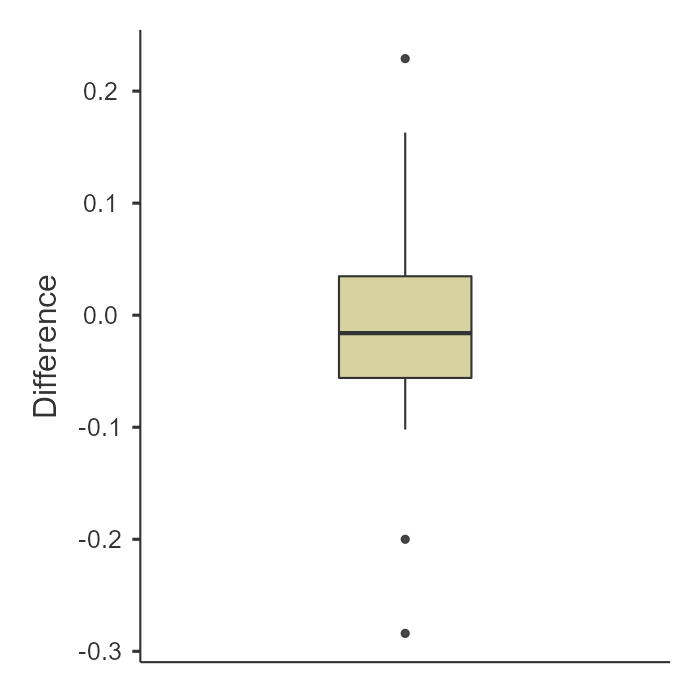
The next illustration is a Violin plot that includes all of the time difference data points along with the mean time difference represented by the dark box.

Lastly, looking at a 95% confidence interval for the difference population mean based on this sampling data, it’s likely that the mean time measurement difference between the Dragy and Accessport is between -0.042 and 0.025 seconds:
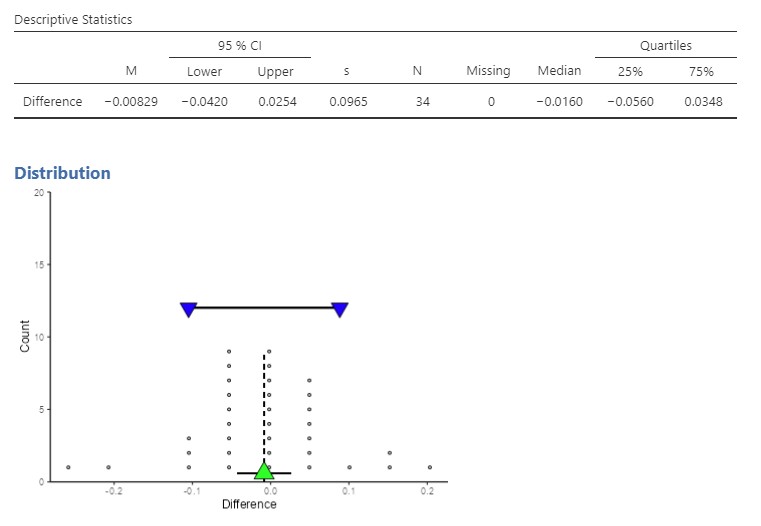
Even if the value is at the extreme end of the range, and off by ~0.04 seconds, for my purposes I don’t believe an accuracy greater than 4/100ths of a second is essential to my use of the data.
Conclusion:
The time to accelerate my Mk7 GTI from 47 mph to 84 mph is measured using a Dragy and Cobb Accessport. A comparison of the difference in acceleration time between the devices is made using 34 sample measurements.
A 95% confidence interval for the population mean is estimated to be between -0.042 and 0.025 seconds, based upon a sample mean of 0.008 seconds and a standard deviation of 0.0965 seconds.
With a mean acceleration time of approximately 3.85 seconds, the mean difference between the Dragy and Accessport is 0.22% (0.008/3.85) of the measurement value.
For my purposes, logging with the Accessport provides sufficiently accurate acceleration time measurements.