
Table of Contents

1.0 Background:
1.1 Summary
If you’ve ever read a Mk7 discussion board or Facebook group you have probably come across this question: “What’s the best tune to get?” In fact, “Which Mk7 GTI tune should I buy” is likely one of the most frequently asked questions in discussions about modifying the VW Mk7 GTI.
There is no shortage of recommendations to this question that are both enthusiastic and confident, and lacking in objective information for comparing tune options.

The purpose of this test is to measure vehicle performance data while using different brands of Engine Computer (ECU) software modifications. These software modifications are referred to as ECU tunes and are sold by several vendors.
For this comparison, a product referred to as an off-the-shelf (OTS) tune is being compared. This software is made to work with a GTI equipped with components found in the factory car, which allows one version of the ECU software to function on different consumer cars. In comparison, there is a custom ECU tune, which as the name suggests, is customized to a specific owner’s vehicle.
A custom tune is not being evaluated since the results would be mostly relevant for only one Mk7 GTI.
To generate comprehensive information, every “established” tuner I can identify that sells an Off-The-Shelf (OTS) IS20 Stage 2 tune for the Mk7 GTI in the North American market will be considered for inclusion.
The candidate products to be tested are identified in the table in the “Products under test” section.
1.2 Previous test results
To my knowledge, there have been a handful of comparisons made between some of the tune options that are being tested, but these have been one-versus-one and lack a comprehensive data set for making objective comparisons of these tunes. There is no prior test comparing the North American market OTS IS20 Stage 2 software for the Mk7 GTI of the scope of this effort that I am aware of.
2.0 Purpose of test:
The purpose of this test is to measure engine and vehicle operating variables while using each of the OTS tunes installed on the same IS20-equipped Mk7 GTI.

The resulting data should facilitate an objective comparison of the ECU tune products.
3.0 Products under test:
3.1 ECU Tune
“Tuned” ECU software alters how the GTI engine computer manages the engine operation, typically to increase the engine power output.
Off-the-shelf (OTS) software has been developed by tuning companies to control the GTI engine with an IS20 turbocharger. With an OTS software product, the development and testing of the software precede the sale of the product to the consumer. An OTS tune is ready to go right away and allows the vehicle owner to avoid data logging and revisions before having a finished product.
The table below summarizes the companies that were considered for inclusion:
| Vendor |
|---|
| Unitronic |
| EQT |
| Integrated Engineering |
| Eurodyne |
| SneekyTuned |
| GIAC – Stage 1+ |
| APR – Stage 1 |
| REVO |
| United Motorsport |
| HPA |
| Stratified |
| Russel Road & Racing |
| 034 Motorsports |
| Racingline |
3.2 Mk7 GTI

The IS20-equipped GTI being used in this evaluation has the following aftermarket engine-related equipment installed:
- Eventuri intake
- Stock accordion hose
- Shuenk turbo inlet elbow
- IHI IS20 turbocharger
- GFB DV+
- 034 Motorsport turbo muffler delete
- aFe Power charge pipes
- AMS intercooler
- Neuspeed FMIC / bicooler
- HPA high-pressure fuel pump
- APR catch can
- 034 Motorsport coils packs
- Baun Performance GESi cat 4″ downpipe
- Baun Performance resonated midpipe
- AWE Tuning track edition exhaust with Magnaflow muffler
3.3 Test instrumentation
Vehicle acceleration data will be measured using a RaceBox performance meter and Dragy.
Engine variable data will be logged using the Cobb Accessport for Cobb-based tunes and SIMOS Tools logger for the non-Cobb-based products.
Intake and exhaust air conditions will be measured using a DATAQ DI-2108 datalogger.
4.0 Scope of test:
4.1 Test environment
Testing will take place in the Orlando Florida area.
Temperature conditions as reported by the GTI ambient air temperature sensor will be recorded during each data collection session.
The roadway slope is recorded by the RaceBox.
4.2 Test and test conditions
After each tune’s results have been recorded another tune will be flashed to the ECU until all of the available tunes have been tested. This process will span months.
Data will be collected by accelerating the GTI on the street at full throttle starting at 1900-2100 RPM and concluding at 6300-6500 RPM.
The transmission will be placed into the third (3rd) gear for data collection on the street.
93 octane gasoline with 10% Ethanol content will be used.
4.3 Test criteria
4.3.1 Assessment standards
There are no threshold or objective performance requirements included in this evaluation on account of the test purpose being the collection of data for comparison by different users.
Acceleration runs that cover a segment of road where the slope changes by 1% or more (Dragy reported as Invalid) will not be used for acceleration time comparison.
4.3.2 Completion standards
Testing will end when sufficient vehicle and engine performance data has been collected to meet power analysis requirements for statistical confidence.
Power Analysis
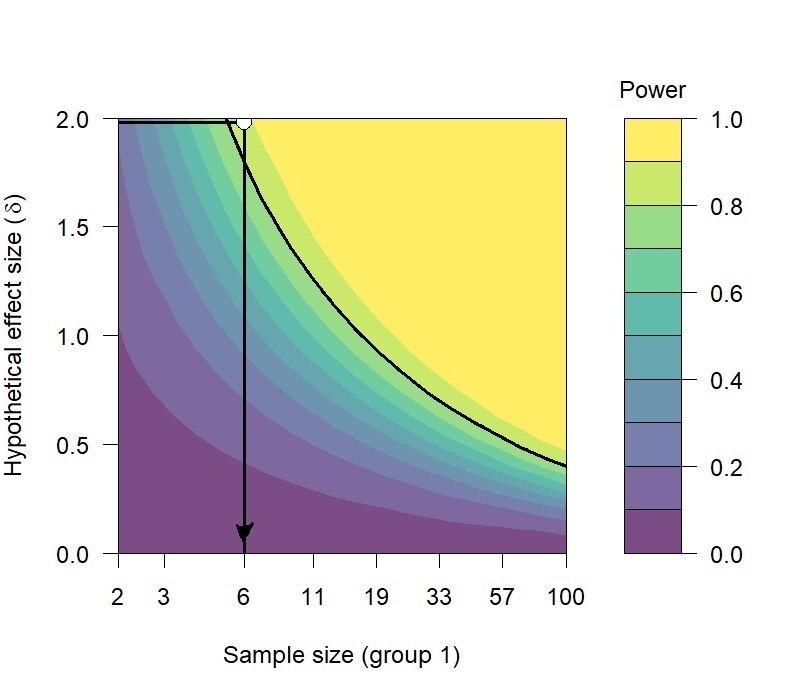
To estimate the number of pulls that would be required to have confidence in the comparisons of peak wheel horsepower and acceleration times a power analysis was made for each measure.
Both calculations use a statistical power of 0.8 and a significance of 0.05.
Note: More information on the Power Analysis is found on this page.
Assumptions for the peak wheel horsepower are:
- Minimum Mean Difference of Interest = 7 whp
- Calculated Peak WHP Variance for Sample Set 1 & 2 = 11.6 / 11.8
- Effect size 2.05
Based on this information, a minimum of 6 samples are needed for the peak wheel horsepower comparisons.
Assumptions for the acceleration times are:
- Minimum Mean Difference of Interest = 0.1 seconds
- Acceleration Time Variance for Sample Set 1 & 2 = 0.00518 / 0.00465
- Effect size 1.43
Based on this information, a minimum of 9 samples are needed for the acceleration time comparisons.
4.4 Limitations to scope
Data collected using the Cobb-based tunes was also generated on a DynoJet dynamometer. This device was not used with the non-Cobb-based tunes.
Recording street data under the same atmospheric temperature conditions would have complicated the data collection and potentially impacted the number of tunes that could be evaluated.
Most data was collected while the ambient air temperature was in the low 60s except two collections that occurred at 65 degF and 68 degF.

5.0 Method of test:
5.1 Test methods and procedures
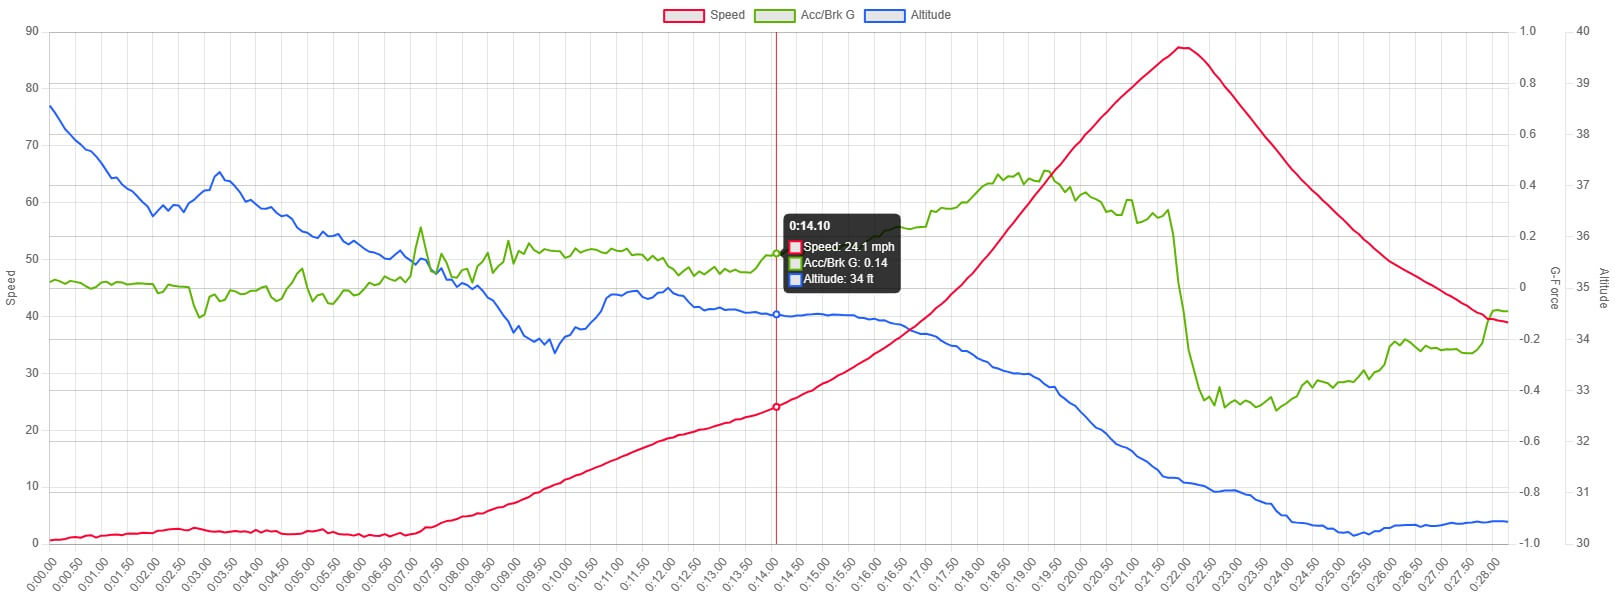
Full-throttle single-gear acceleration from 2000-6300 RPM
The GTI is operated with the DSG transmission in manual mode and third gear. When the engine RPM is around 2000 the accelerator pedal is fully depressed and the car is continuously accelerated to an engine RPM that exceeds 6300. The car is then slowed and the transmission returned to automatic mode. The car is driven for a short time dependent upon location and traffic conditions before repeating the process. This is continued until sufficient pulls have been made to achieve the desired level of confidence in the summary data.
The acceleration time from 47 mph to 84 mph is measured by the Racebox and/or Dragy.
Virtual Dyno Setup and Smoothing Factor
Previously I have discussed the use of Virtual Dyno and the process used to clean the data before using the Virtual Dyno application to estimate the peak wheel horsepower.
5.2 Support requirements
For software products that can only be installed by a vendor dealer, arrangements will be made to schedule the installation and removal of software by the dealer.
6.0 Project management:
6.1 Supplies
| Brand | Method | Hardware & Software | Status | Communication | Tune |
|---|---|---|---|---|---|
| Eurodyne | Home Flash | Have Device & Software Access | Complete | Stage 2 – 93 | |
| Cobb | Home Flash | Have Device & Software Access | Complete | Stage 2 – 93 | |
| 034 Motorsport | Home Flash | Have Device / Need software | Complete | 034 Cancelled Purchase | Stage 2 – 91 |
| Unitronic | Shop | Shop install | Complete | Stage 2 – 93 | |
| APR | Shop | Shop install | Complete | Stage 1 – 93 | |
| Revo | Shop | Shop install | Complete | Stage 2 – 93 | |
| IE | Home Flash | Have Device / Need software | Complete | Stage 2 – 93 | |
| Stratified | Home Flash | Have Device / Need software | Complete | Stage 2 – 93 | |
| SneekyTuned | Home Flash | Have Device / Need software | Complete | Stage 2 – 93 | |
| EQT | Home Flash | Have Device / Need software | Complete | Stage 2 – 93 | |
| Russell R&R | Home Flash | Have Device / Need software | Complete | No OTS option | Stage 2 |
| HPA | Home Flash | Do Not Have Device / Need software | No Response | Request Sent 2/6 | Stage 2 – 92 |
| GIAC | Home Flash | Do Not Have Device / Need software | No Response | Request Sent 2/6 | Stage 1+ – 91 |
| Racingline | Shop | Shop install | Complete | Stage 2 – 93 |
6.2 Reports
6.2.1 Product test results
Cobb Accessport Based Tunes
Stock GTI, Cobb Stage 2, EQT, SneekyTuned, Stratified – Street Data Collection from each Cobb-based tune.
Stock GTI, Cobb Stage 2, EQT, SneekyTuned, Stratified – Street Summary page for comparison results of the Cobb-based tunes.
Stock GTI, Cobb Stage 2, EQT, SneekyTuned, Stratified – Dyno Data Collection for each Cobb-based tune on the dyno.
Stock GTI, Cobb Stage 2, EQT, SneekyTuned, Stratified – Dyno Summary page comparing results for the Cobb-based tunes.
Stratified DLR – Stratified off-the-shelf tune with data log refinement (DLR) option.
For more details about the Cobb-based tune comparison see this page.
Other Tunes
Eurodyne Stage 2 – Street Data Collection
REVO Stage 2 – Street Data Collection
Racingline Stage 2 – Street Data Collection
Unitronic Stage 2 – Street Data Collection
Integrated Engineering Stage 2 – Street Data Collection
034 Motorsport Stage 2 – Tune order debacle
APR Stage 1 – Street Data Collection
6.2.2 Test result summary
This chart shows the individual data points for the Dragy Acceleration Times.
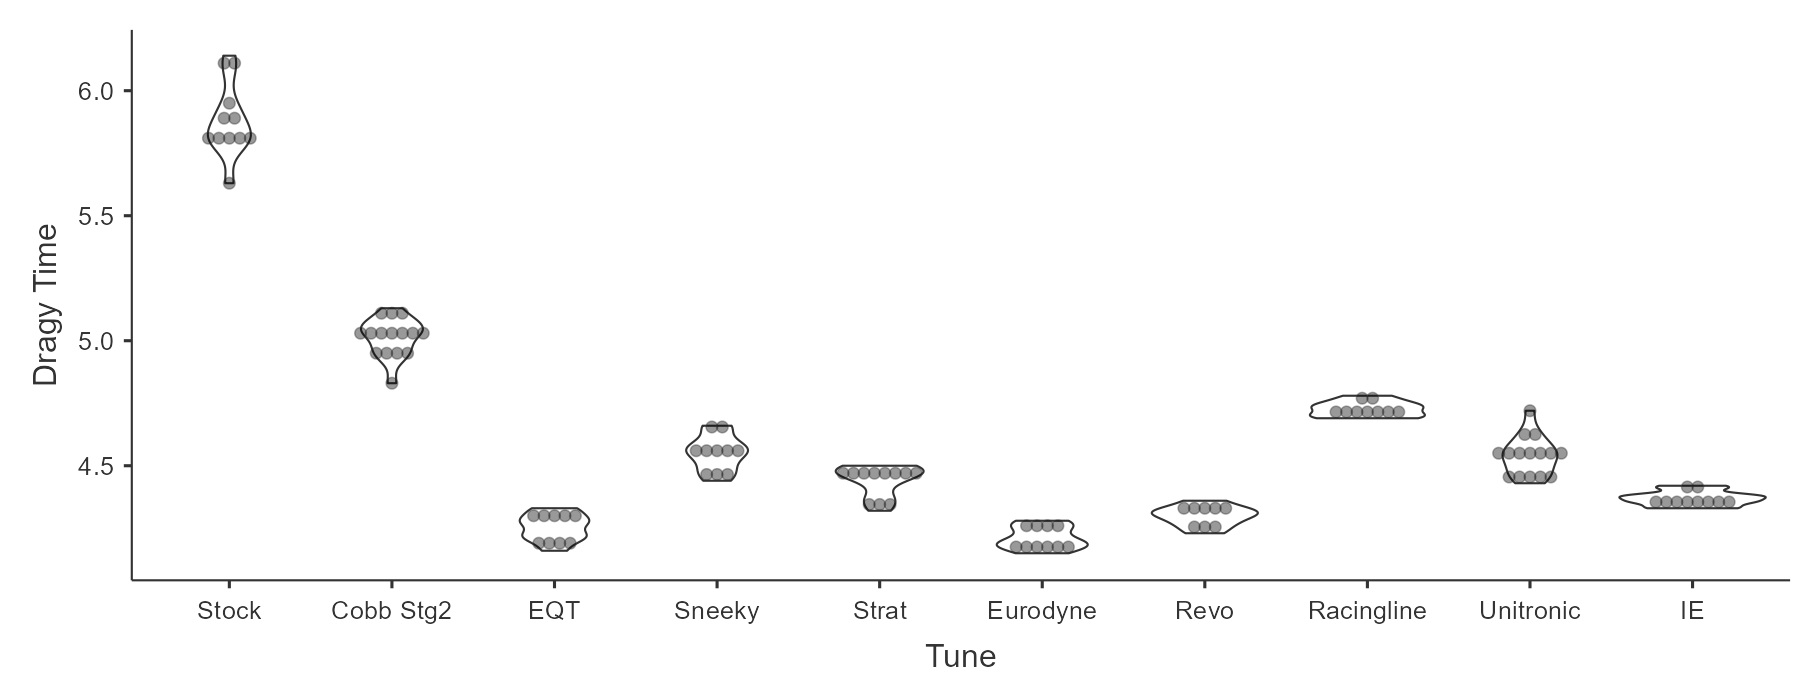
Note: Numbers in parenthesis (x) in the chart legends are the number of samples making the average.
These individual data points are averaged to produce the following Dragy Time bar chart:
The remaining charts show average values:
This chart shows the individual data points for the Virtual Dyno calculated Peak WHP.

The bar chart below shows the averaged peak WHP values.
This chart provides insight into the relative safety of each tune. Average boost pressure in the peak torque range and percentage of pulls where an occurrence of knock retard occurs are the axes of the scatterplot.

Data for the Stock, Cobb, and Strat tunes shows they do not numb the knock sensors. The Sneeky tune has some knock sensor numbing in the lower RPM range, and the EQT tune has the most knock sensor numbing throughout the range of comparison.
This information is used as the basis for the color boundaries. Red is riskier, while green is safer.