

Background:
In the course of recording street data for making comparisons between the tunes an important consideration is the number of data points to support a reliable comparison.
To arrive at an adequate number of samples a Power Analysis was made.
A power analysis is the calculation used to estimate the smallest sample size needed for an experiment, given a required significance level, statistical power, and effect size. It helps to determine if a result from an experiment or survey is due to chance, or if it is genuine and significant.
The sample size is the number of pulls that will be used to calculate the estimated wheel horsepower.
To fully support a hypothesis, then there needs to be a p-value (probability value) that measures the likelihood that the result was due to the variables and not to chance. This p-value is also called statistical significance.
The statistical power of a hypothesis test is the probability (p-value) of finding an effect.
Commonly, statistical power of 80 percent or more is needed in order for the result to be accepted. With an 80 percent power, that means there’s only a 20 percent probability of an error.
Statistical Power:
Statistical power is made of four related parts.
- Effect size: The quantified size of a result present in the population.
- Sample size: The number of things measured: How many how many pulls do I need to make?
- Significance: The level of significance used in the experiment, generally 5 percent.
- Statistical power: The probability of accepting the alternative hypothesis.
All these variables are inter-linked; more pulls conducted can make the effect easier to detect, and the statistical power may be increased by growing the significance level.
Statistical power helps testers to avoid both type I and type II errors. A type I error (false-positive) occurs if a tester rejects a null hypothesis that is actually true in the population. A common null hypothesis I use is that there is no difference in power produced from using two different products. Concluding that one product produces more power than another, when in fact it does not, is a type I error.
Type II error (false-negative) occurs if the tester fails to reject a null hypothesis that is actually false in the population. In this case concluding that two products provide equal power output, when in fact one produces more power than the other.
Both errors can be problematic. Although type I and type II errors can never be avoided entirely, the tester can reduce their likelihood by increasing the sample size
Calculations:
The Effect Size represents how large the difference is between the mean values of the samples. In this case, it is the difference in estimated wheel horsepower. I have selected a value of 7 wheel horsepower as the amount of difference that is of practical significance.
How much difference is important could be different for somebody else, which would change the sample size needed.
I have data describing the variance of wheel horsepower measures from past testing that can be used along with the wheel horsepower difference of interest to calculate the Effect Size.
Significance of 5% and Statistical Power of 80% are common values, and they are being used in this comparison test.
With these variables known the minimum Sample Size can be calculated, which turns out to be six (6) pulls with each tune.
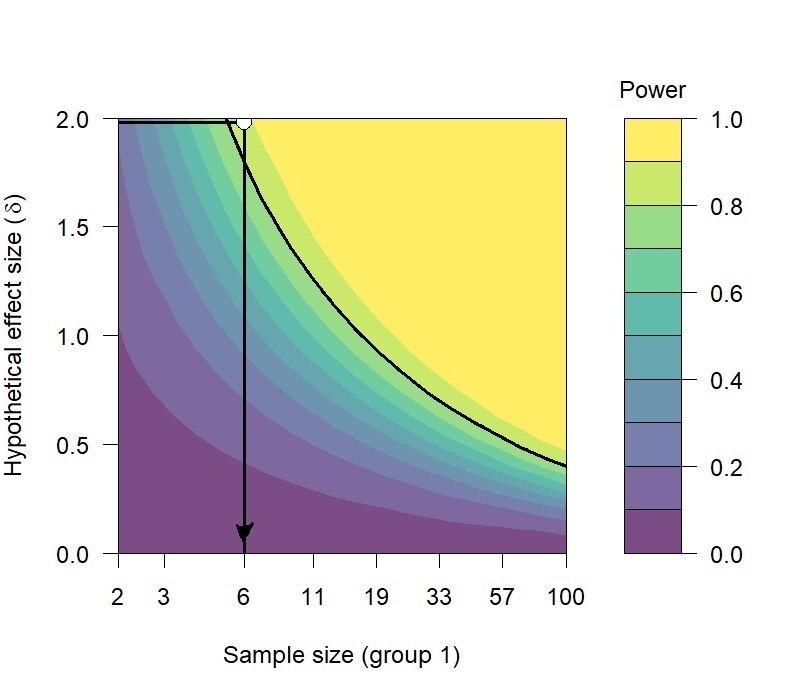
Conclusion:
The results of the Power Analysis recommend a minimum of six pulls with each tune in order to have sufficient samples for a reliable comparison of the mean wheel horsepower estimates.