Table of Contents
1. Background
This project was started to evaluate the performance of a selection of Turbocharger Inlet Pipe (TIP) products. Presently the only known source of performance data for some of these products is manufacturer supplied data and user accounts that typically consist of perceived performance changes.
2. Purpose
This test program will consist of taking measurements of the airflow passing through each test item to enable the evaluation of relative performance among the test items and absolute performance under the test conditions. The results will show which Turbo Inlet Pipe allows the highest airflow under the test conditions.
3. Description of Equipment
3.1 Test Items
The TIP is a component located along the Mk7 GTI/R engine intake and connects the airbox to the turbocharger allowing filtered air to enter the turbocharger compressor housing. All test items that are part of this program are built to function at a minimum with the IS20 or IS38 style compressor housing and stock size inlet hoses. None of the test items have been modified from how they were delivered from the vendor.
A stock hose and top half of the airbox will be utilized to create a pathway for intake air to travel along to the TIP. Note: The lower half of the airbox and filter will not be attached for the purpose of eliminating potential resistance along the pathway to the turbo inlet pipe.
An adapter made of a three inch silicone hose will be used to join the TIP to a flowbench adapter plate.
3.2 Test Instrumentation
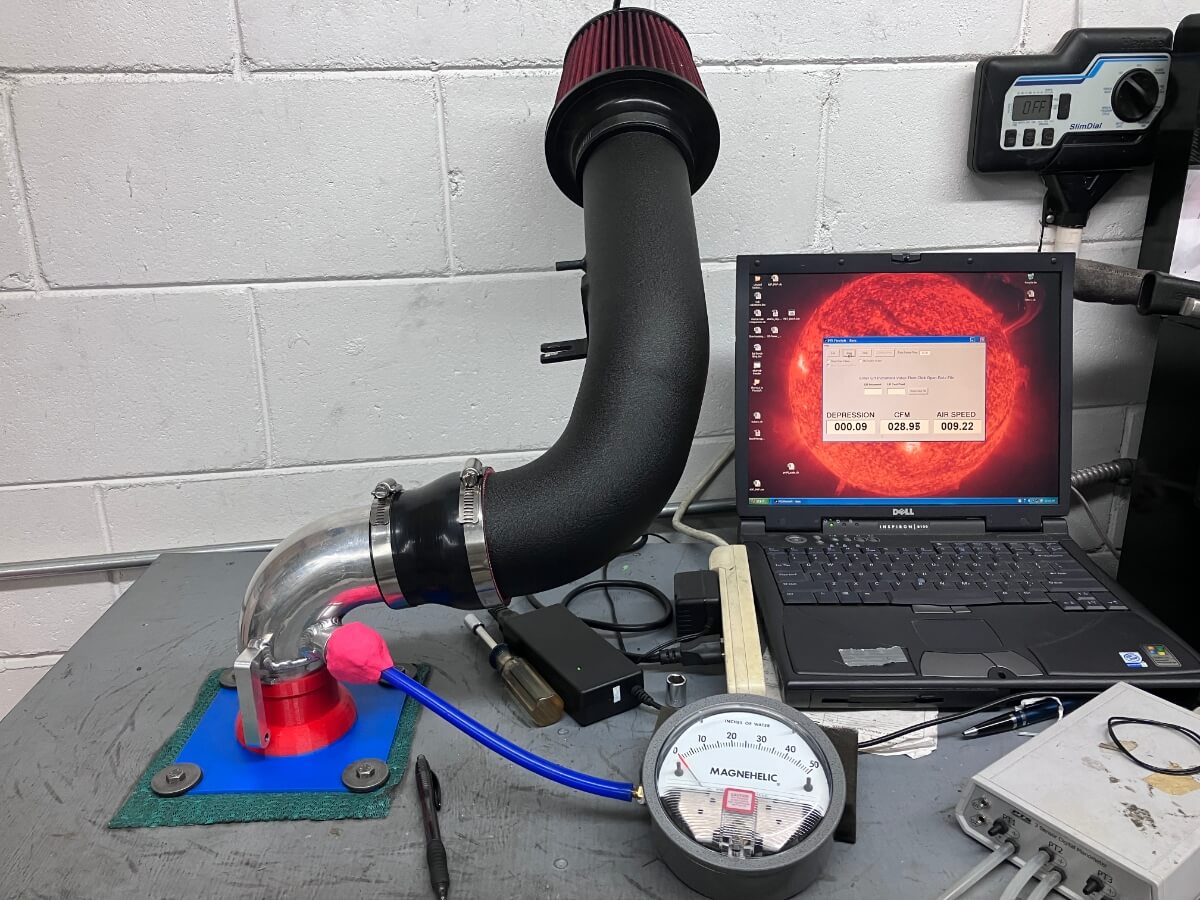
A PTS flowbench will be used to generate airflow through the test items. A PTS digital manometer capable of reading up to 36” of H2O will be used to measure the airflow through the flowbench.
4. Scope of Test
4.1 Test Envelope
Airflow testing by means of a flowbench is commonly performed at test depressions in the range of 10” to 28” of H2O. For this test program all measurements will be recorded at a depression of 28” of H2O.
4.2 Tests and Test Conditions
Testing will take place in an enclosed garage with air temperature between 70 to 78 degrees fahrenheit.
4.3 Test Configuration
The turbo inlet pipe will be attached to an OEM inlet hose and to the flowbench by means of a straight silicone coupler and flowbench adapter plate.
4.4 Test Criteria
For a successful test there will be no leakage among the articles being subjected to airflow. The test depression of 28” must be maintained within +/- 3 CFM while measurements are recorded. A minimum of 10 measurements will be recorded for each test case to be successful.
4.5 Limitations to Scope
In operation it is expected that the MQB will generate intake airflow that ranges from 10 CFM up to 600 CFM (redline at 27 psi of manifold boost pressure). The maximum airflow capacity of the PTS flowbench is approximately 600 CFM at 28”.
It is anticipated that several vendor test items that are available for use with the MQB will not be obtained for this test.
5. Method of Test
5.1 Preparation
Flowbench accuracy will be checked prior to collecting measurements by using a PTS calibration plate. The flowbench will be operated in a draw-through configuration. The flowbench will be operated before taking readings to perform a leak check.
The Mk7 intake will be assembled to replicate the arrangement found in service on the vehicle and clamps used to join the parts will be checked for integrity. Orientation of test items and accessories will be checked and adjusted to maintain standardization between test cases.
5.2 Operational Procedure
Airflow through the test item will be increased until the test condition depression of 28” of H2O is attained and once airflow readings from the digital manometer stabilize ten (10) readings will be made. The flowbench will then be shut off and the test article removed. The ten readings will be averaged and the standard deviation will be determined. The median value will also be determined and compared with the average to check for consistency. If consistency is found among the data the average value will be used for reporting purposes.
6. Project Management
Availability of test items poses the most significant challenge to collecting comprehensive data. The following table summarizes candidate test items, vendor, vendor response to request, owner contribution, and links to each test case.
| Test Item | Vendor | Vendor Response | Owner Donated | Test Status |
|---|---|---|---|---|
| Stock GTI | VW | n/a | Yes | Complete |
| APR | Audi Performance & Racing | n/a | Yes | Complete |
| Unitronic | Unitronic | n/a | GolfMk7 Forum Member - GolfRRRR | Complete |
| BMS | Burger Motorsports | Delivered | n/a | Complete |
| MST | MST Performance | Delivered | n/a | Complete |
| CTS | CTS | n/a | GolfMk7 Forum Member - Crackness | Complete |
| Neuspeed | Neuspeed | Delivered | n/a | Complete |
| Leyo | Leyo | Delivered | n/a | Complete |
| Induct | Induct | Delivered | n/a | Complete |
| VWR | Did not reply to request | TBD | Incomplete | |
| Forge | Forge | Delivered | n/a | Complete |
| Spulen | Did not reply to request | TBD | Incomplete | |
| DFG Tuning | Did not reply to request | TBD | Incomplete | |
| Ramair | Did not reply to request | TBD | Incomplete |
Note: Test Item column links to product description page if available.
7. Results
The following links are to pages detailing the progress of the testing effort:
- Round 1
- Round 2
- Test Change
- Round 3
- Airflow Velocity Uniformity Check I
- Airflow Velocity Uniformity Check II
- Round 4 (IE v 034 v DBV2) Part I
- (IE v 034 v DBV2) Part II – Large Adapter
- Forge – Standard Adapter
- Forge – Large Adapter
- Revo Inlet
- SXTH Element Prototype
- do88
- Turbo Inlet Elbow Boost Onset test
- Mishimoto
- CTS Turbo (Cast v2)
- ARM Motorsports
- Stock vs Aftermarket – Street acceleration testing
- aFe Power
The compiled results are presented below:
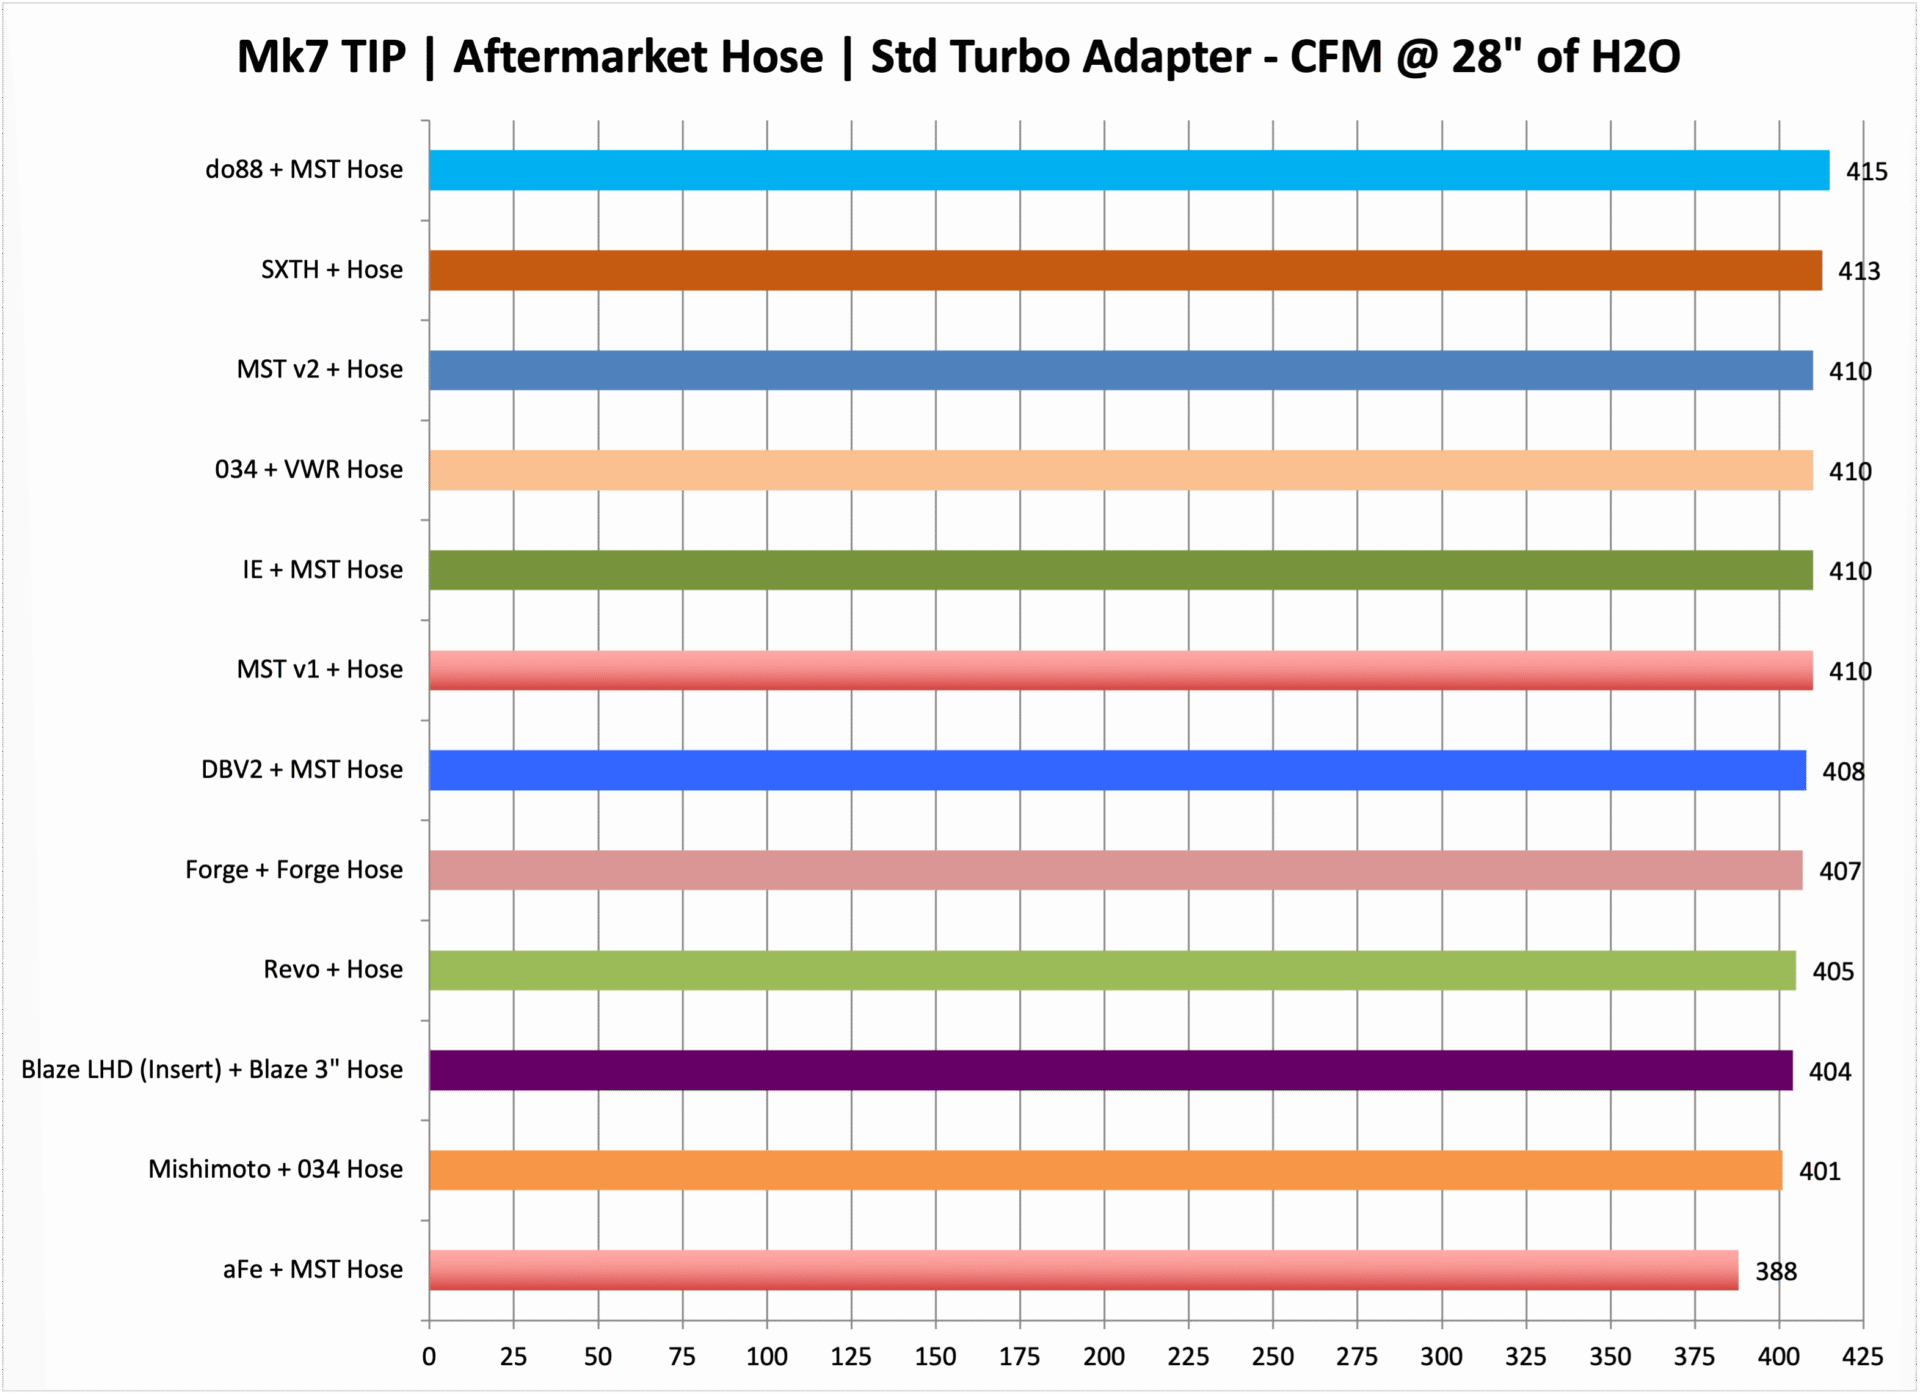
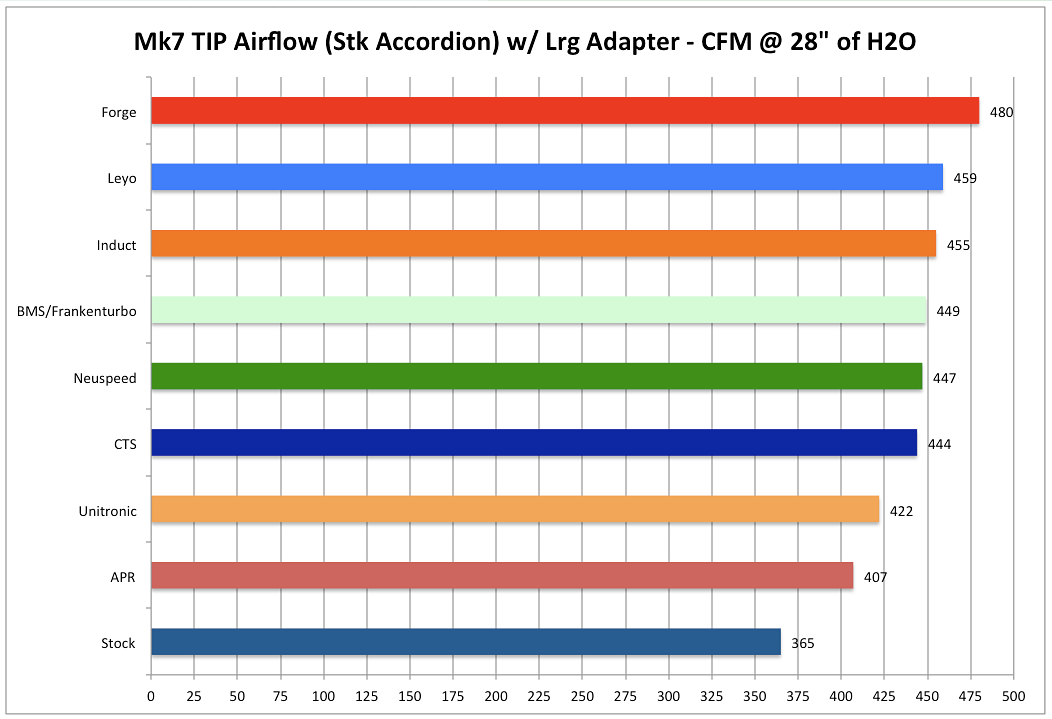
Note: In cases where an inlet hose is not identified the stock accordion hose is being used. In general an aftermarket inlet hose results in 8-10 CFM gains over the stock accordion hose.
Results are broken into four groupings:
- Stock Accordion Hose with IS20/IS38 Adapter
- Aftermarket Accordion Hose with IS20/IS38 Adapter
- Stock Accordion Hose with Large Adapter
- Aftermarket Accordion Hose with Large Adapter


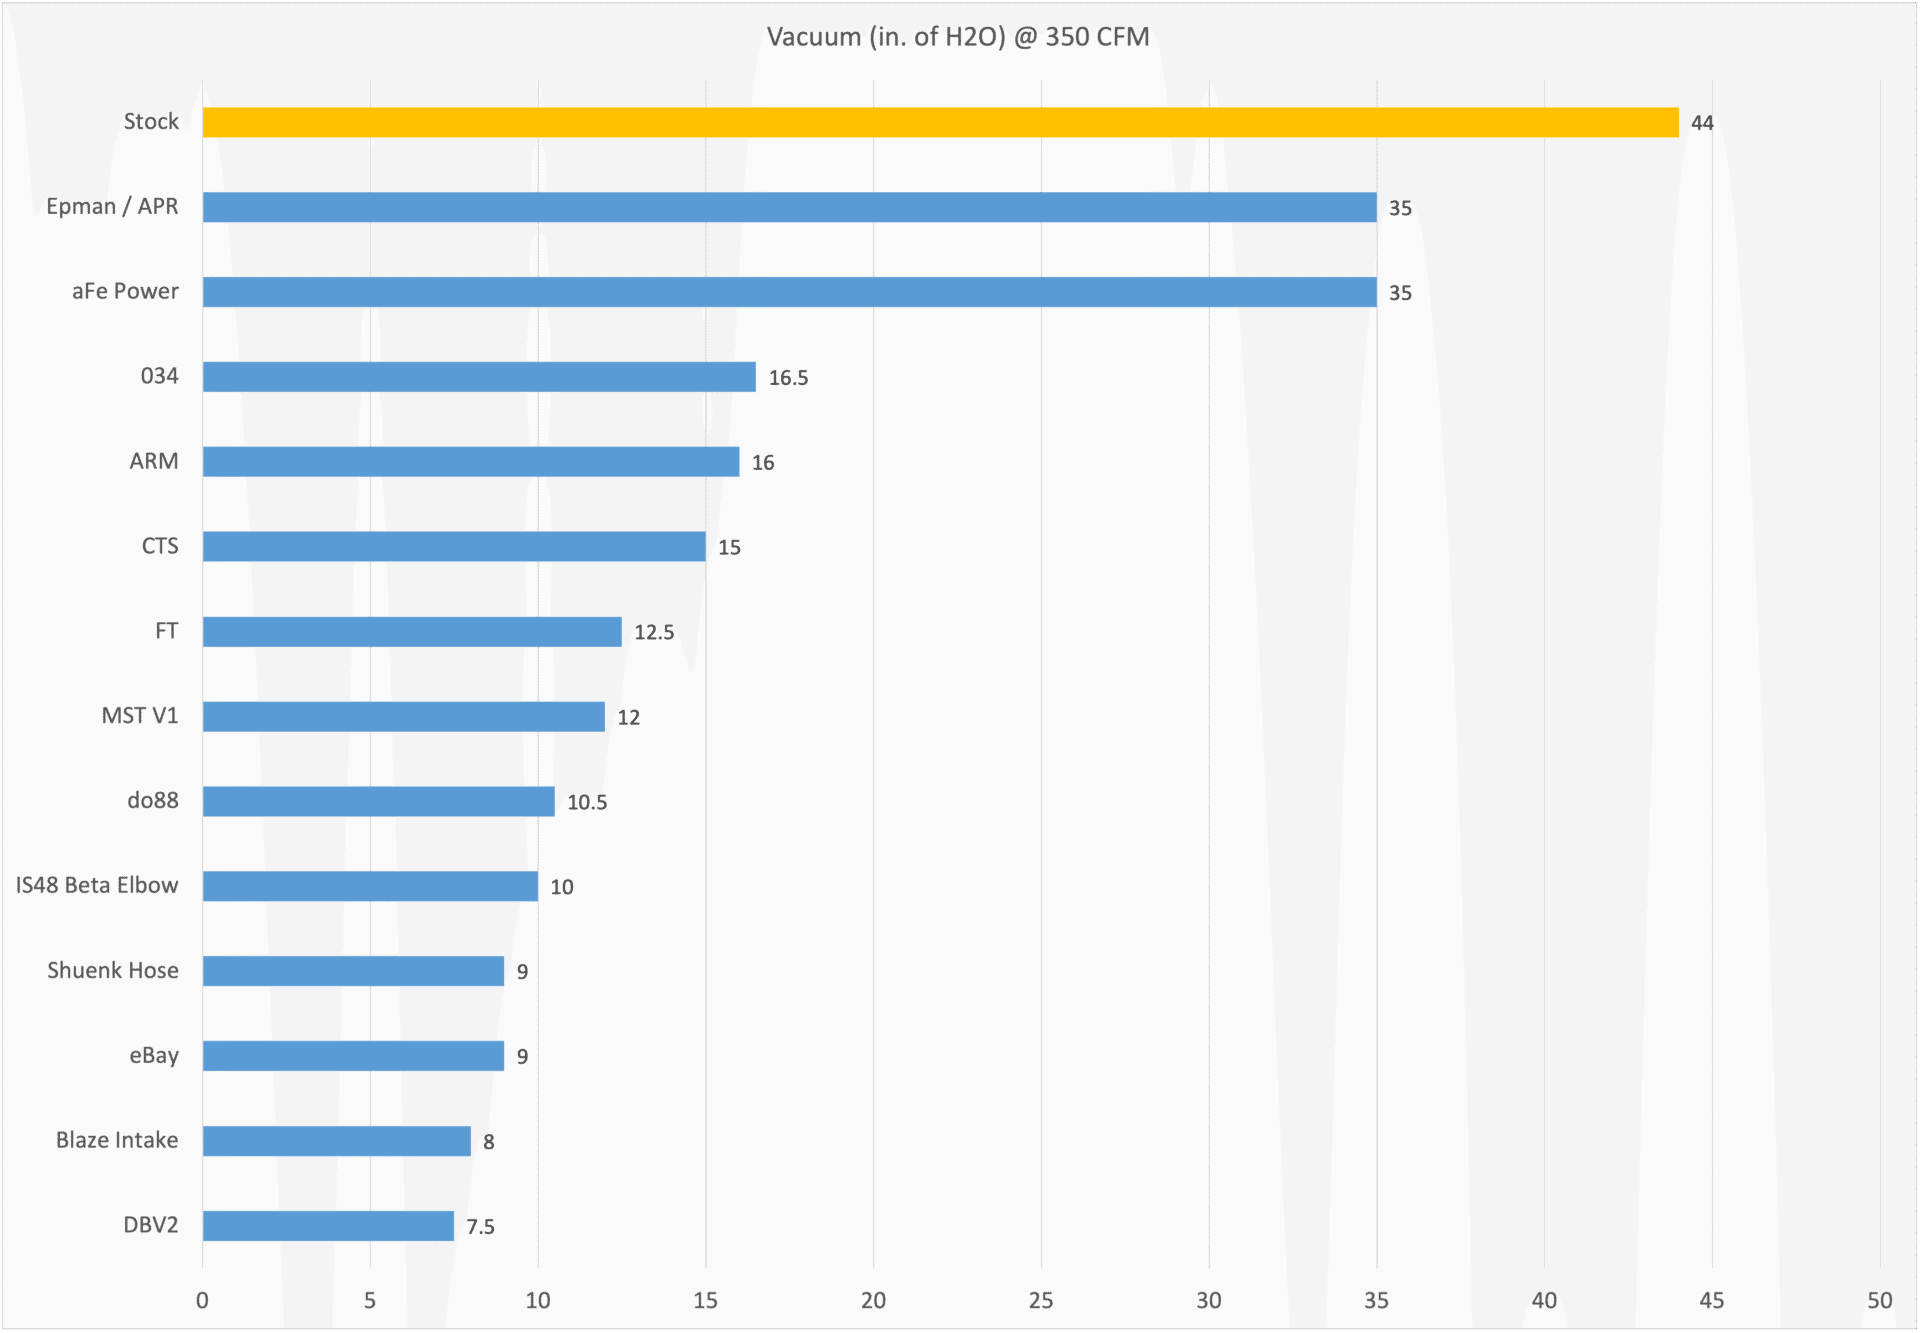
PCV Port Vacuum
The following graph compares the vacuum generated at the PCV port for several turbo inlet elbows.