
Background:
Previously I’ve discussed my use of the Virtual Dyno application for estimating the peak wheel horsepower during a street pull.
If you’re interested in the application’s background there’s an article about Virtual Dyno in Motor Trend published around the time the program was first released.
For my car’s setup; higher than stock power put down through the front wheels to roads that aren’t always smooth, the trickiest part of utilizing Virtual Dyno is having clean data that doesn’t have an instant of wheelspin, which can produce erroneous power estimates.
Smoothing:
Virtual Dyno includes a smoothing function to try and address this, but it isn’t as effective as I would like it to be.
I’ve incorporated applying a polynomial curve fit to the engine speed versus time data and then using the third-order equation to calculate the engine speed versus time.
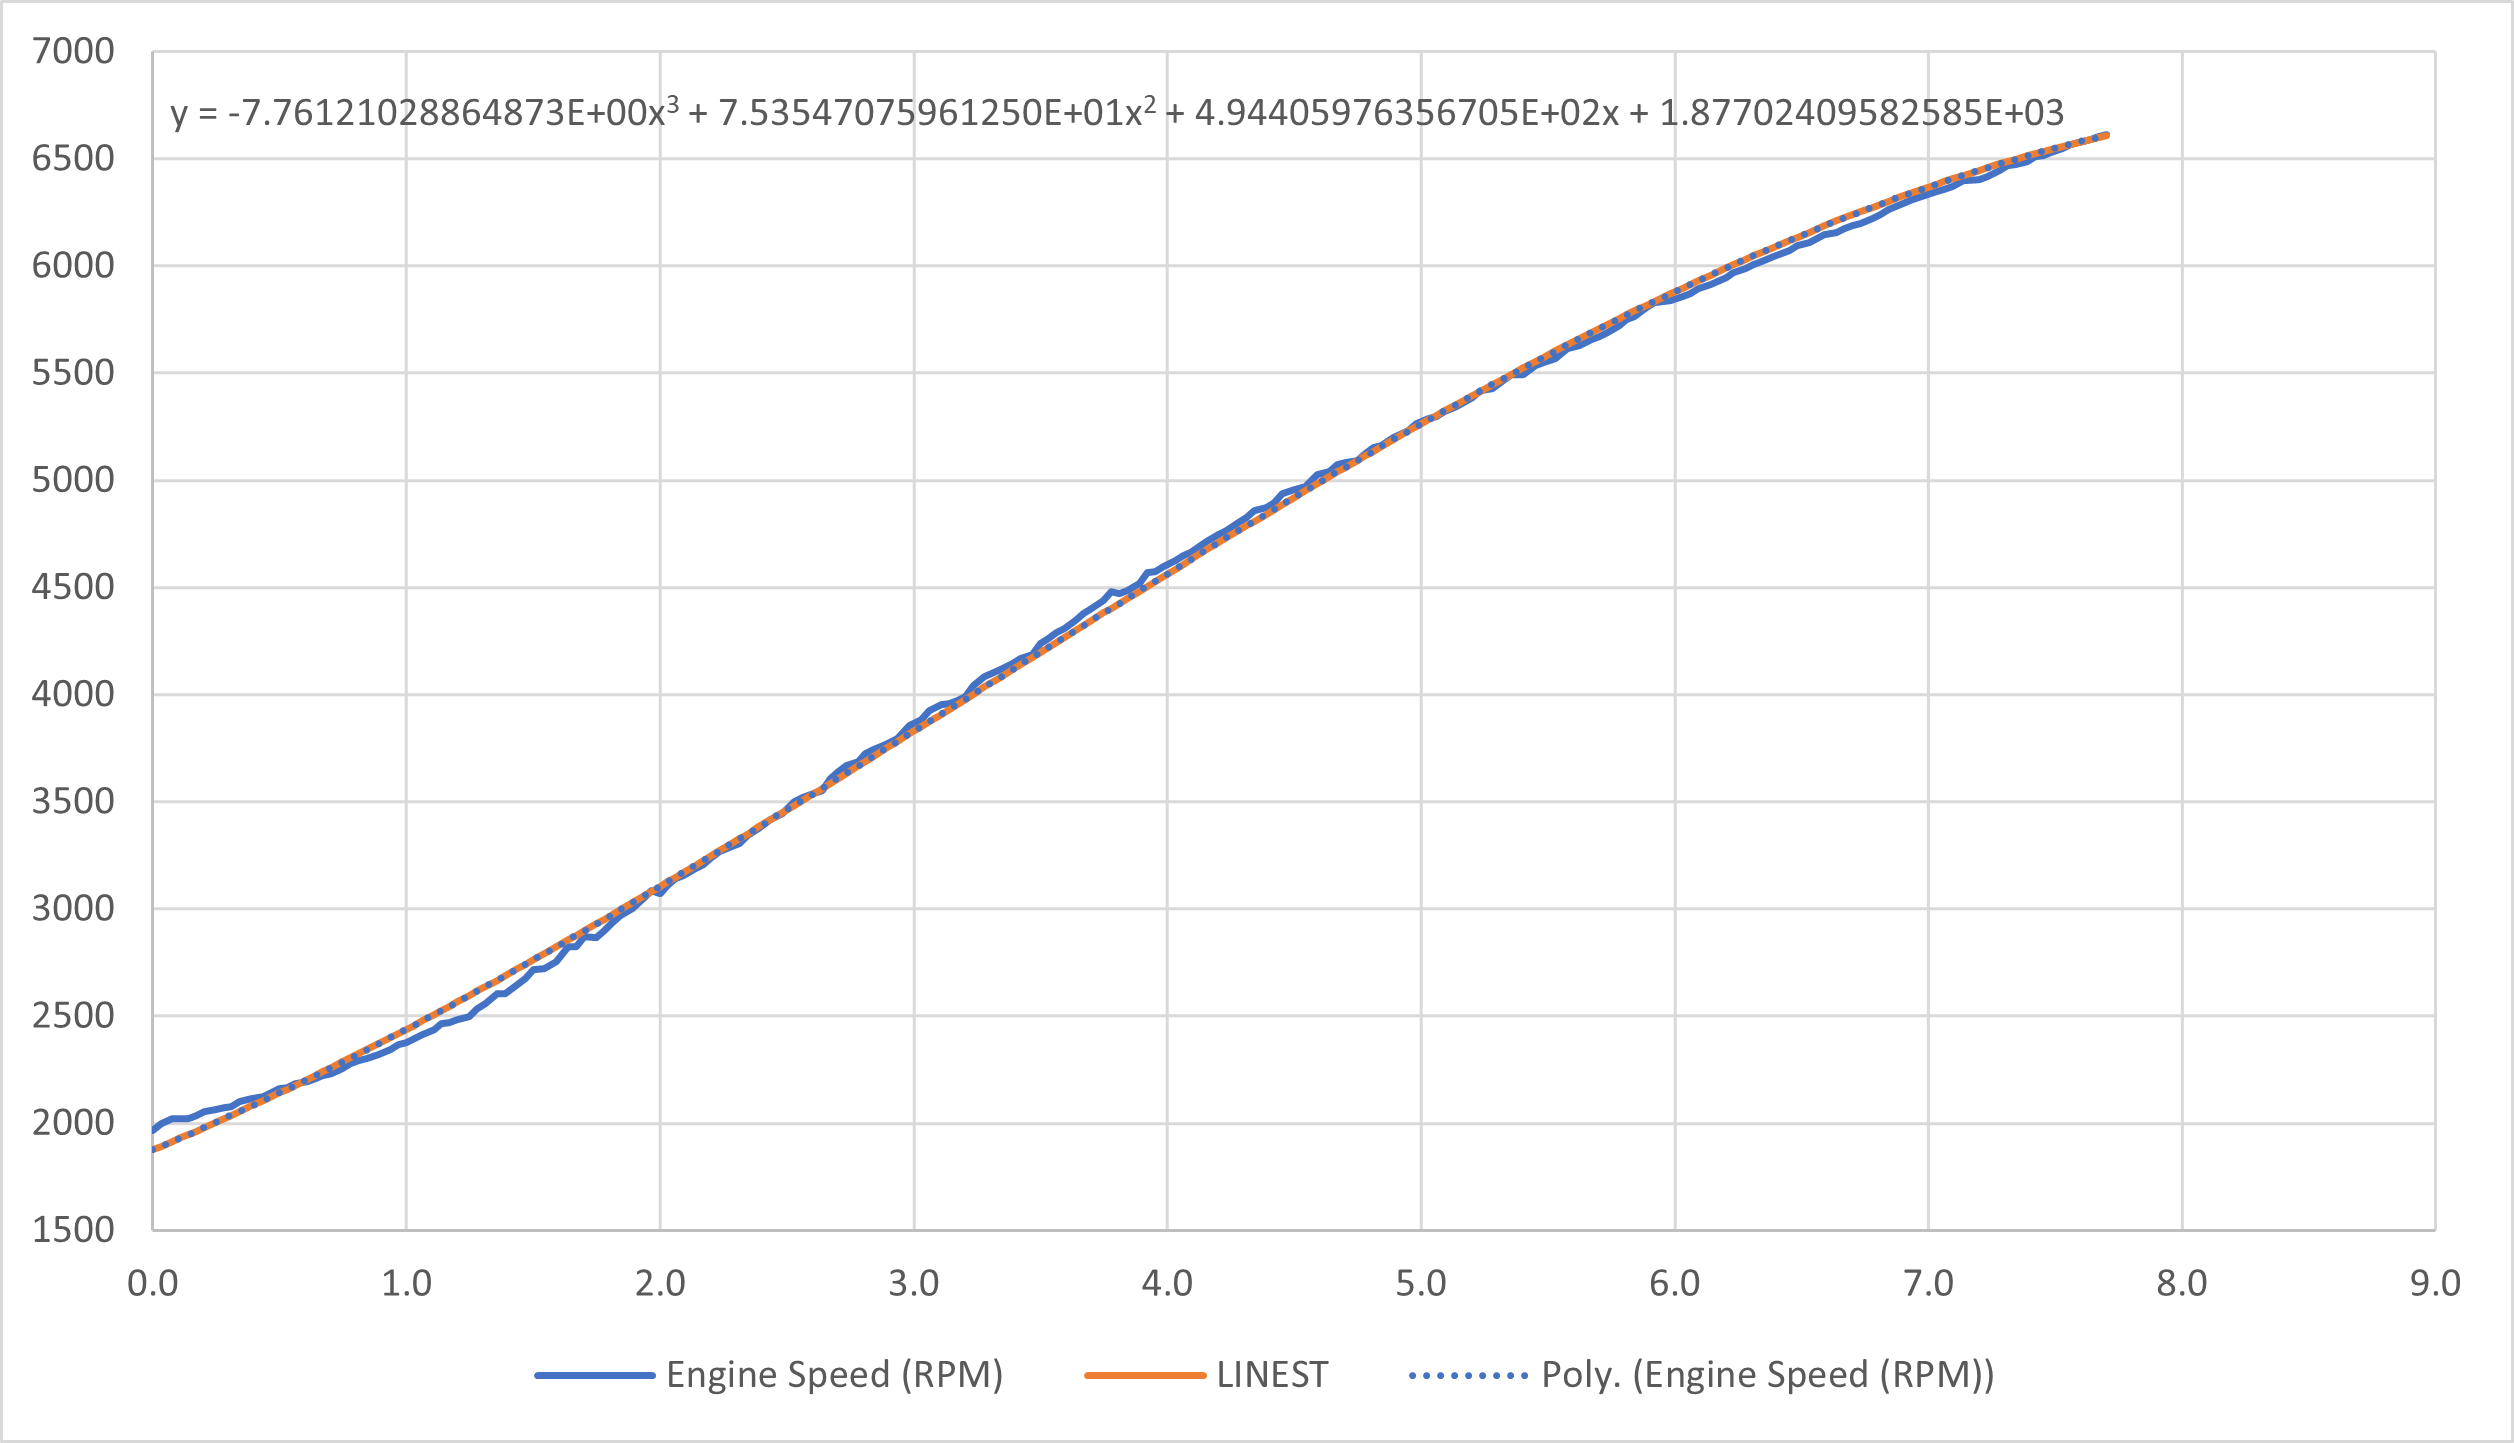
This produces a smooth curve when wheelspin occurs, and as a bonus, the calculated value helps to eliminate errors due to the sampling rate of the Cobb datalogger even when there isn’t wheelspin.
For a long time, I had been using a Virtual Dyno smoothing setting of 4, out of the 6 levels. Then it occurred to me that I was applying a Virtual Dyno smoothing factor to data that had already been cleaned up.
I decided I could reduce the Virtual Dyno smoothing factor some and not reduce the accuracy of the calculated power.
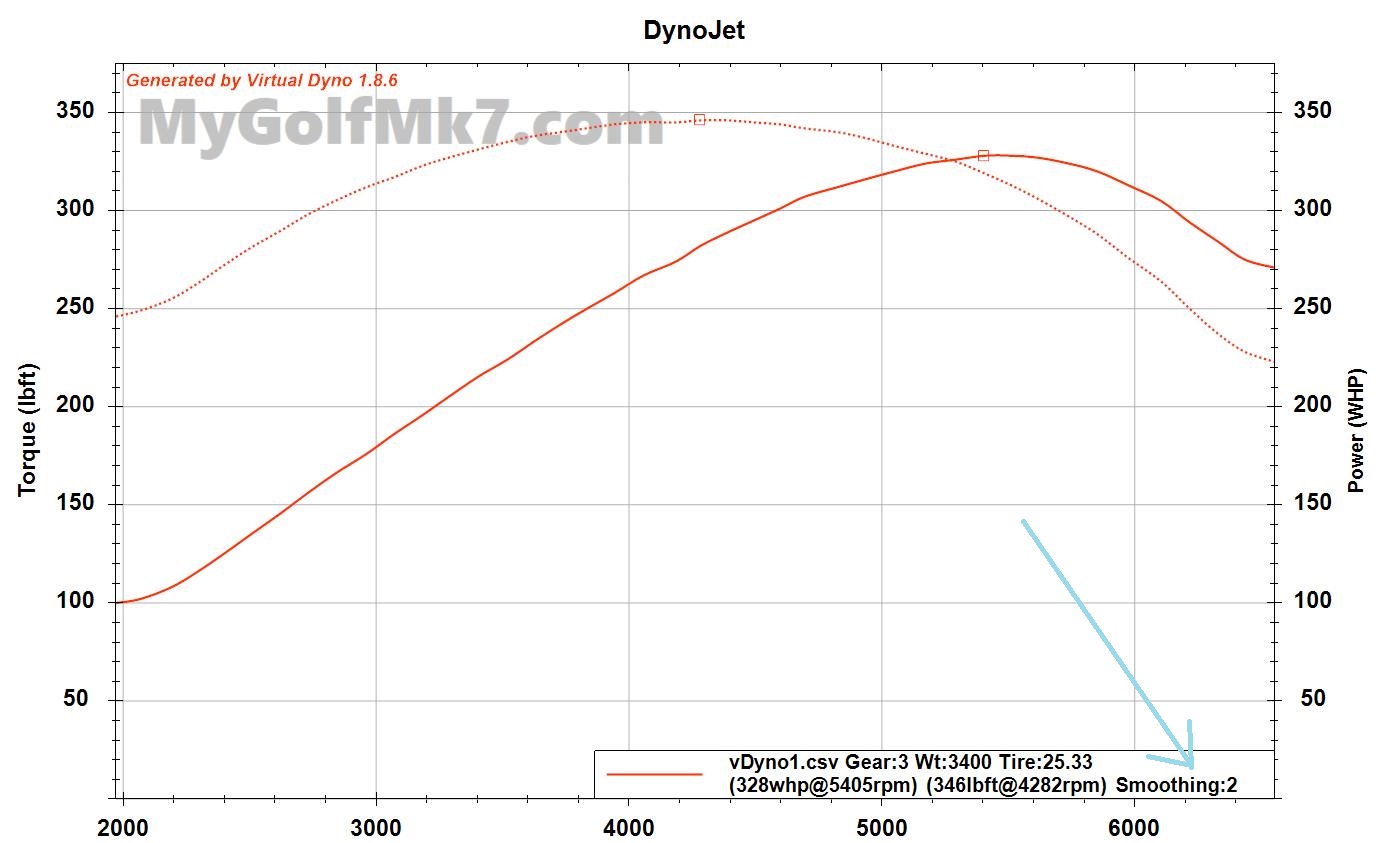
I reduced the smoothing from 4 to 2 and then re-evaluated the comparison data I have for a couple of E30-fueled pulls on a DynoJet and street logs I recorded right after the dyno session.
The comparison between the DynoJet and Virtual Dyno was already good, but reducing the smoothing in Virtual Dyno to two (2) brought the results slightly closer together.
Previously the difference was 6 whp, and now it is 4.5 whp.
More DynoJet vs Virtual Dyno:
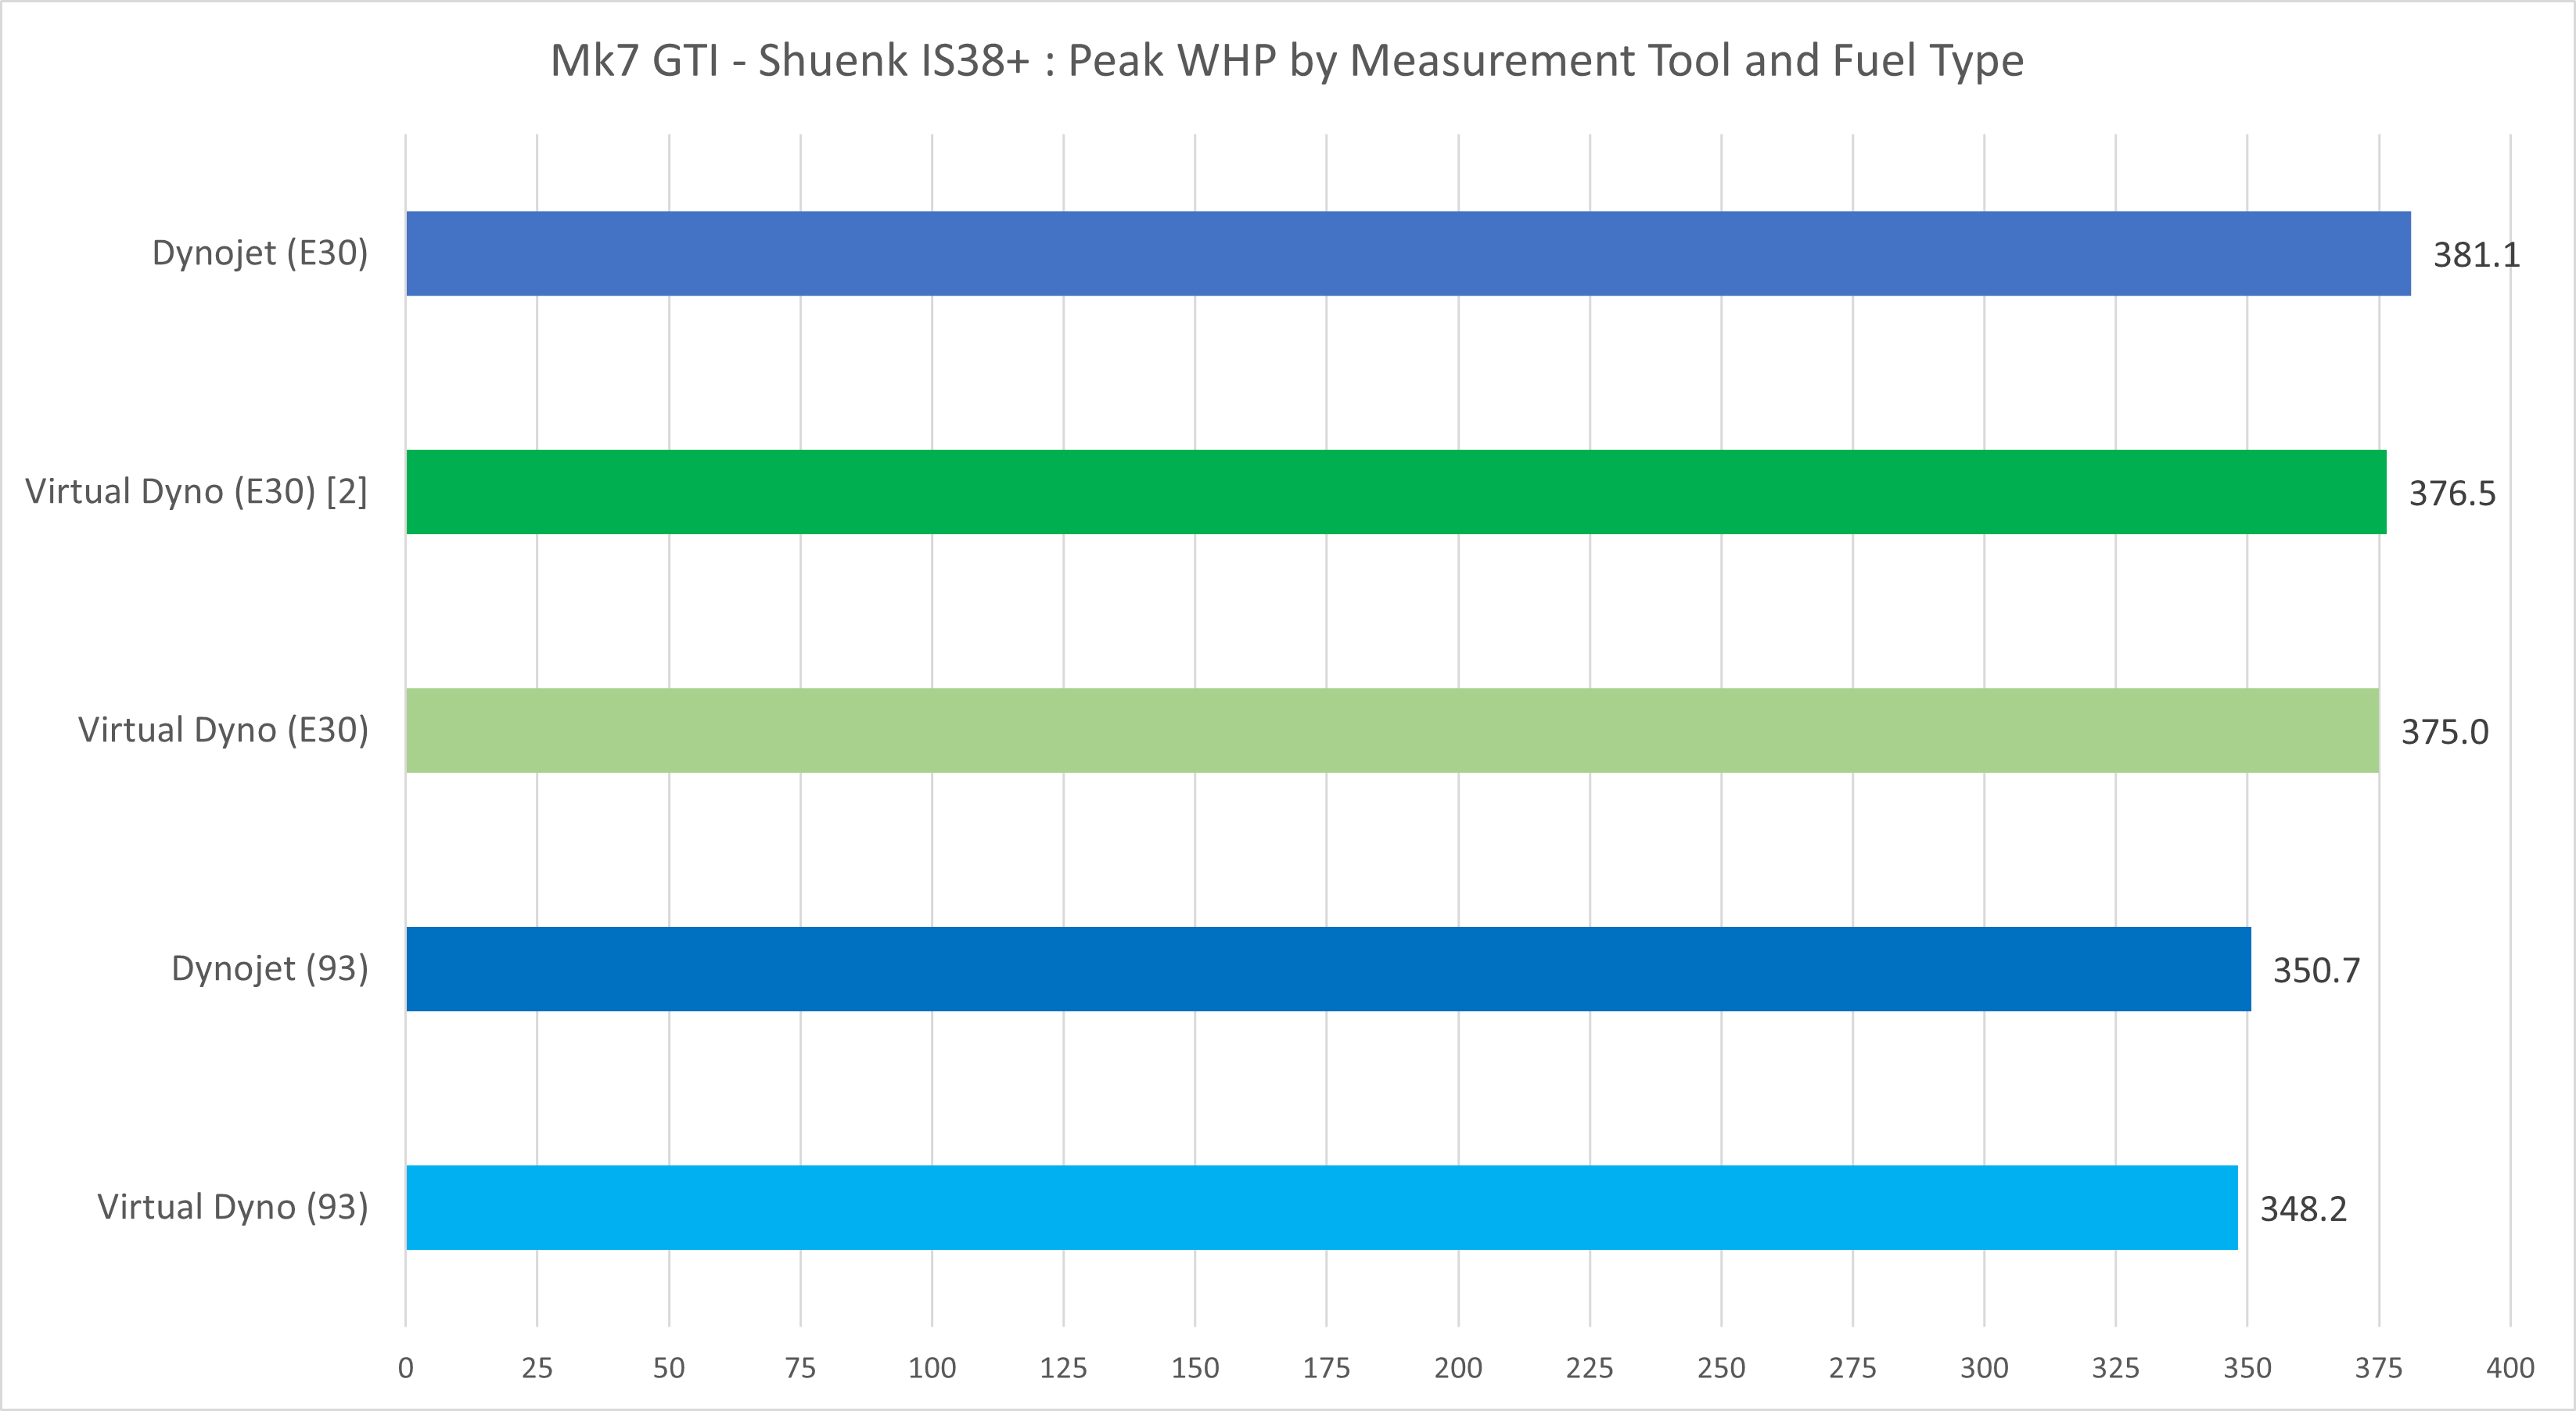
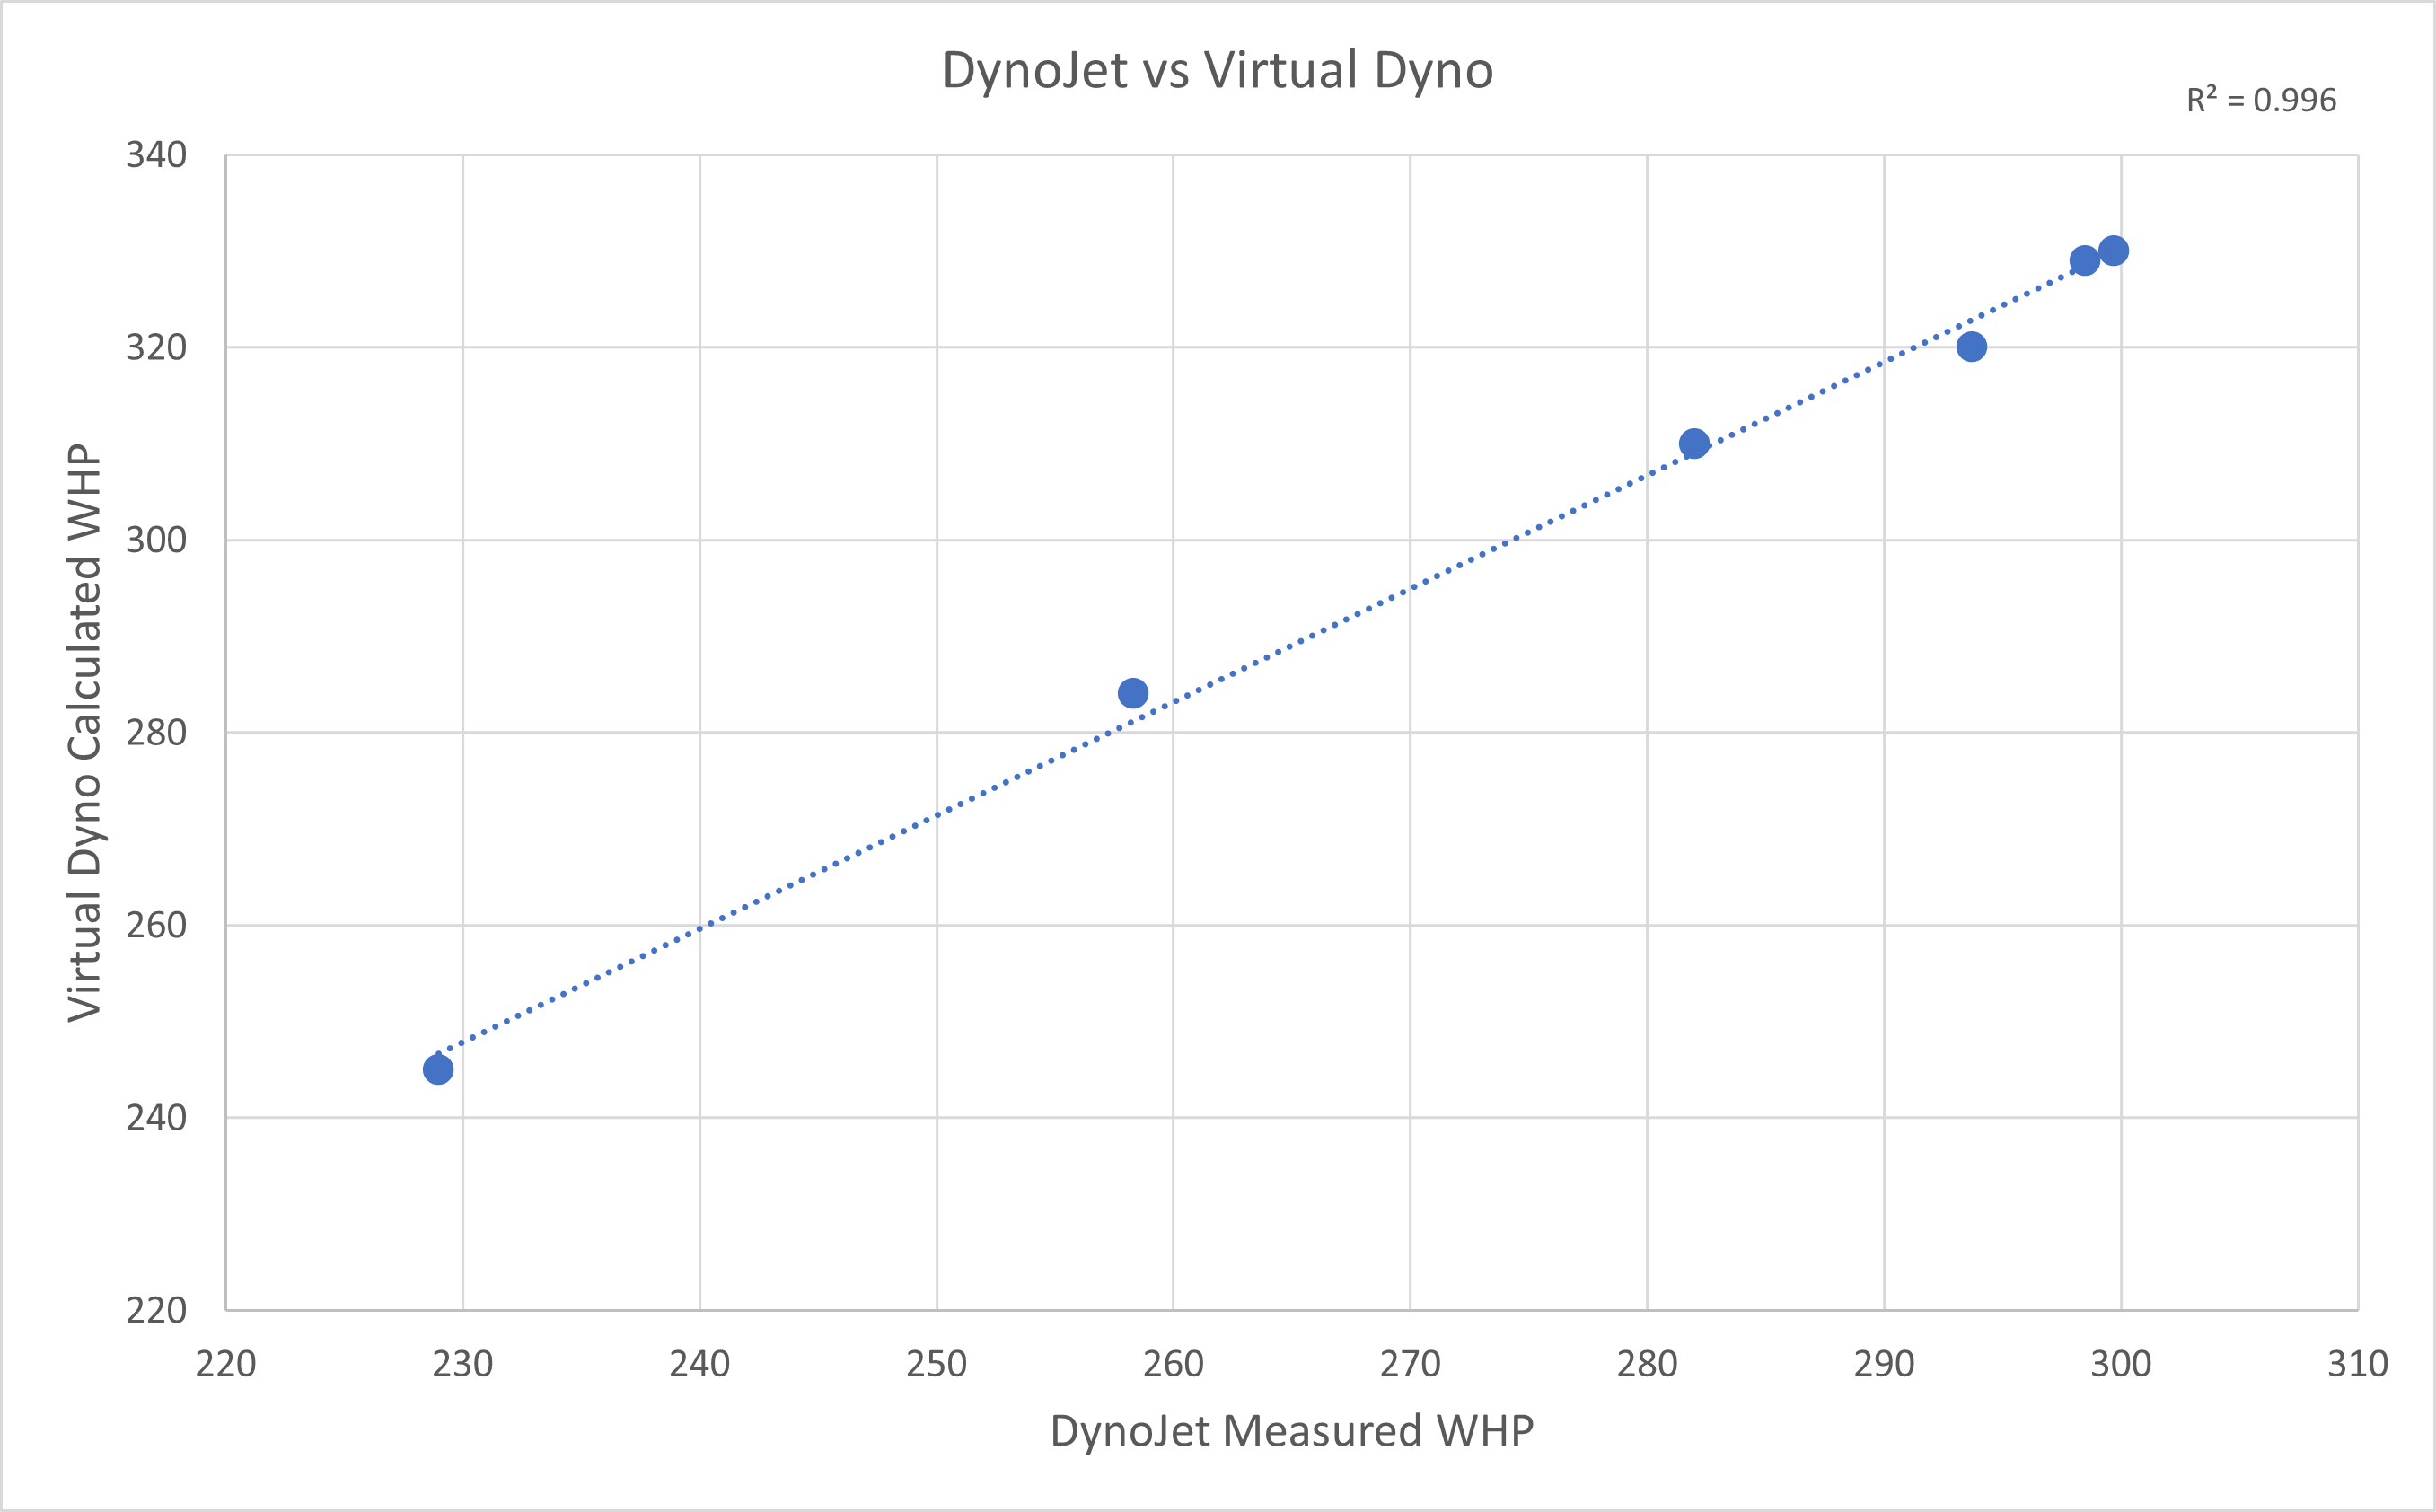
For the recent dyno session where six different Cobb tunes were recorded, I used the results to compare with Virtual Dyno.
The temperature conditions on the Dyno were higher than during the street logging, which likely explains the difference in the peak wheel horsepower determined by the DynoJet versus the Virtual Dyno number, but the strength of the correlation is a sign of how well the changes on the DynoJet compare to the changes calculated with the Virtual Dyno.
The Correlation Coefficient (R2) of 0.996 indicates there is a strong correlation between the measured and calculated peak wheel horsepower values.
Conclusions:
The use of a smoothing value of two (2) in the Virtual Dyno application is satisfactory when the data is cleaned up before being used for a wheel horsepower calculation.
The results from the Virtual Dyno application correlated strongly with measurements recorded on a DynoJet dynamometer.
Continued use of the Virtual Dyno application for comparing the peak wheel horsepower from my Mk7 GTI is supported by these results.