
Background:
I don’t make it to a dyno very often, logging on the street is where I record most of my data. With a good amount of street logs, I use the Virtual Dyno application to process vehicle speed data and estimate the power at the wheels to gauge if modifications make a change to power output.
A few months ago I took my GTI to a dynamometer to have the power and torque measured.

In this post, I compare data from the Dynojet dynamometer with street logs from the same timeframe when my GTI had the same parts setup and fuel.
The fuel used during these pulls, dyno and street, was 93 octane gasoline and then E30
Data:
The 93 octane fuel tune dyno pulls are shown on this chart:
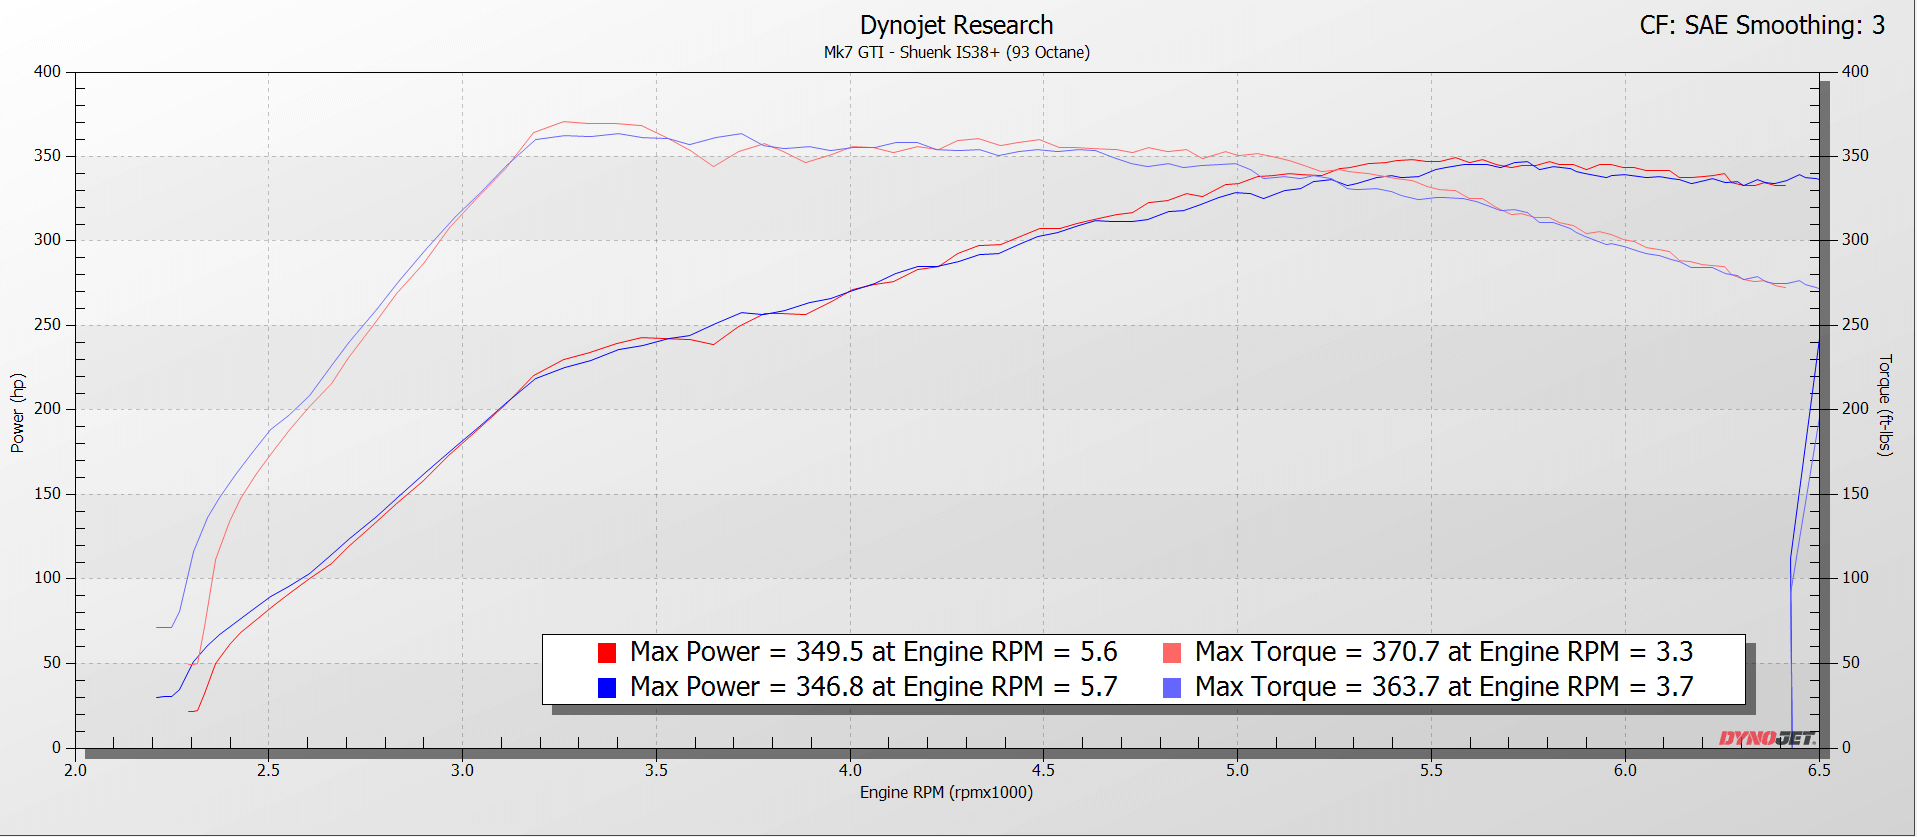
The dyno chart displays SAE corrected power and torque, but I received the dyno-generated files for these pulls and extracted the uncorrected measurements, which had peak values of:
- Run 1 – 352.1 whp / 373.7 wtq
- Run 2 – 349.2 whp / 365.9 wtq
Note: Ambient conditions were not far from the SAE values and thus the uncorrected readings do not differ substantially from the Uncorrected values.
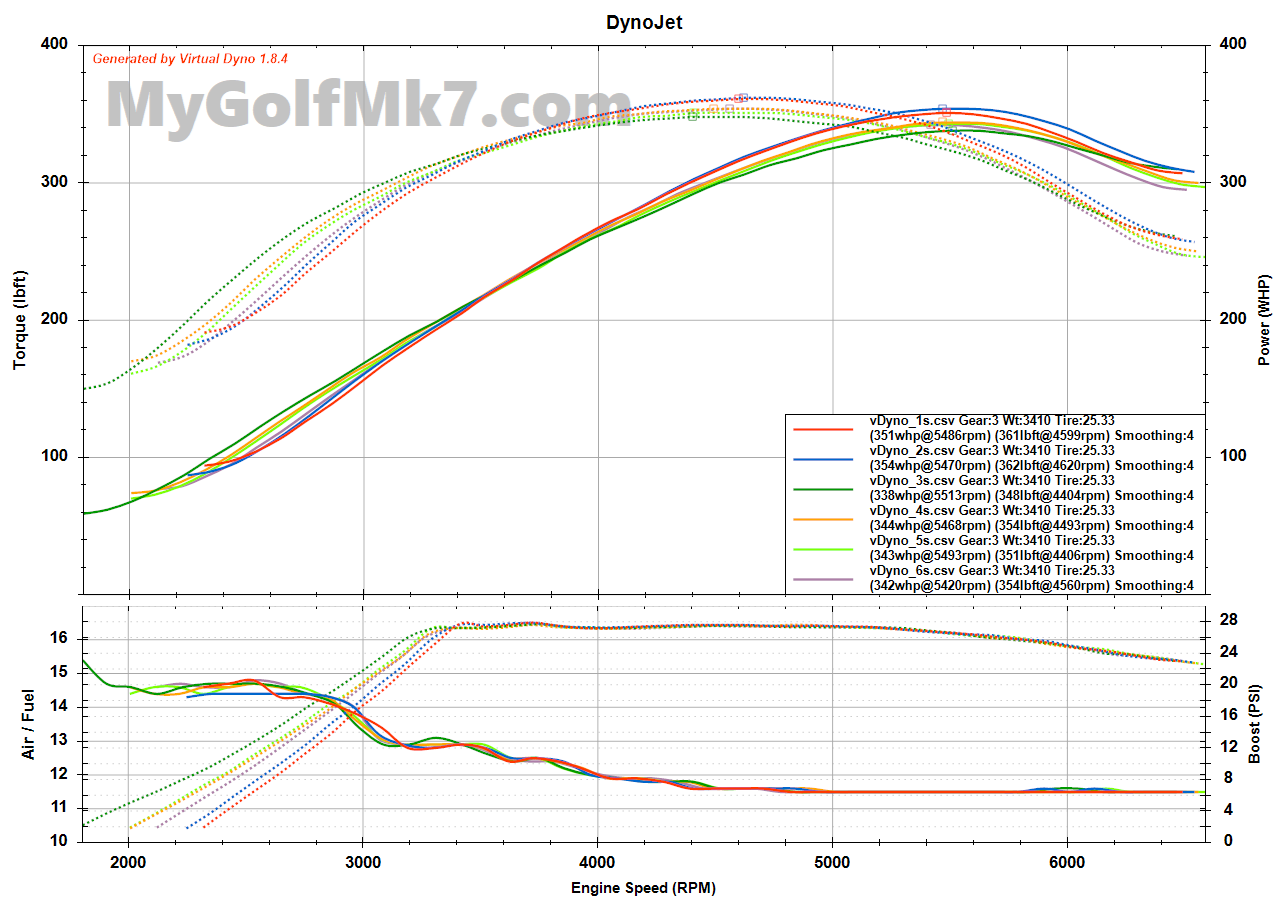
In the days before going to the dyno I made half a dozen pulls resulting in this Virtual Dyno chart:
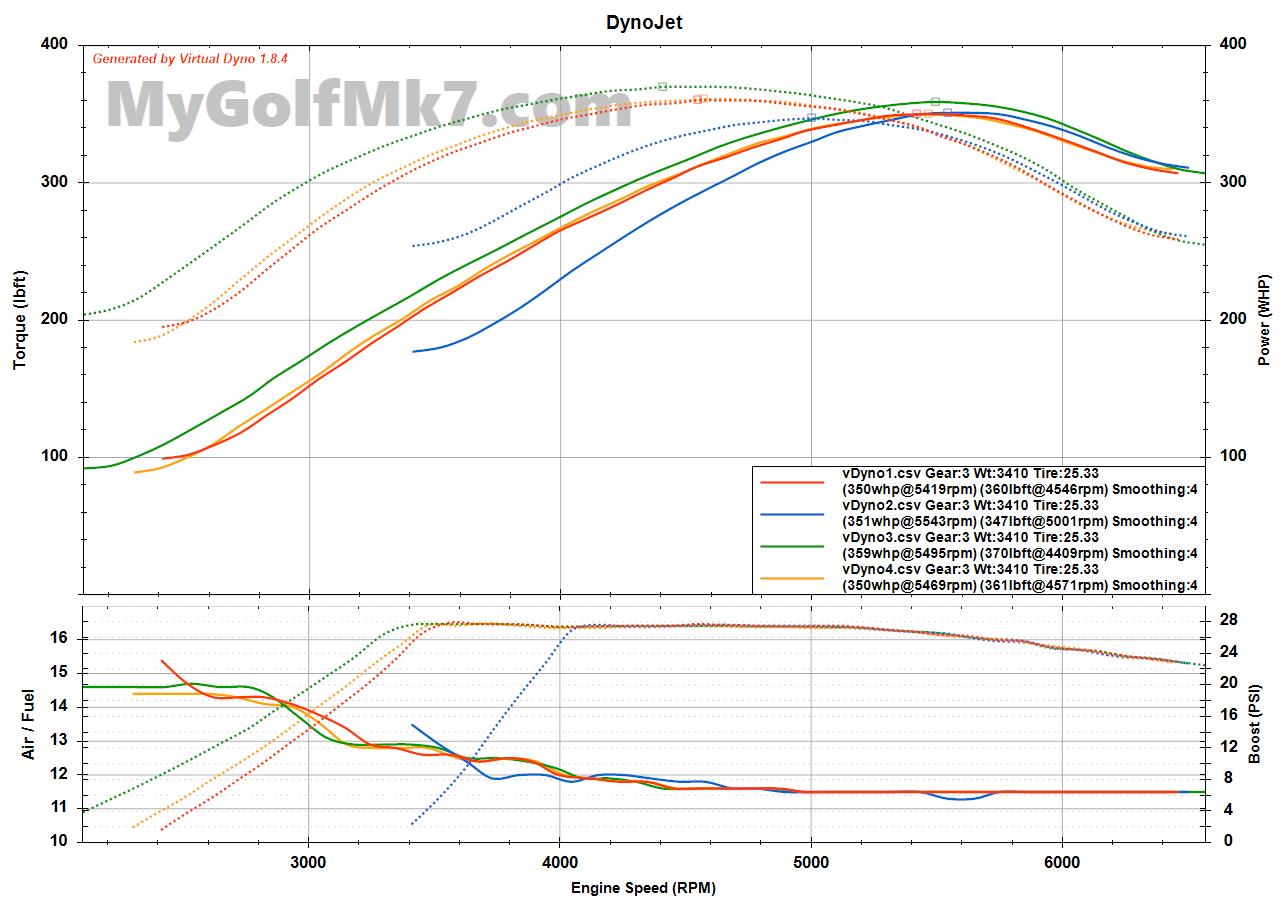
In the days after the dyno session, I recorded an additional four logs, resulting in this chart:
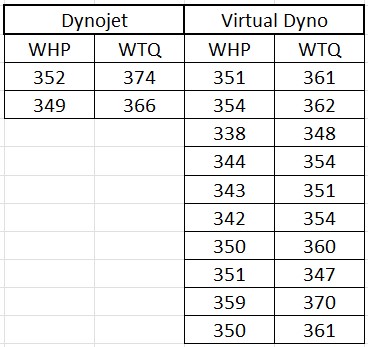
All of the 93 octane estimates are shown in the table:
These measurements are shown in the dot plot:
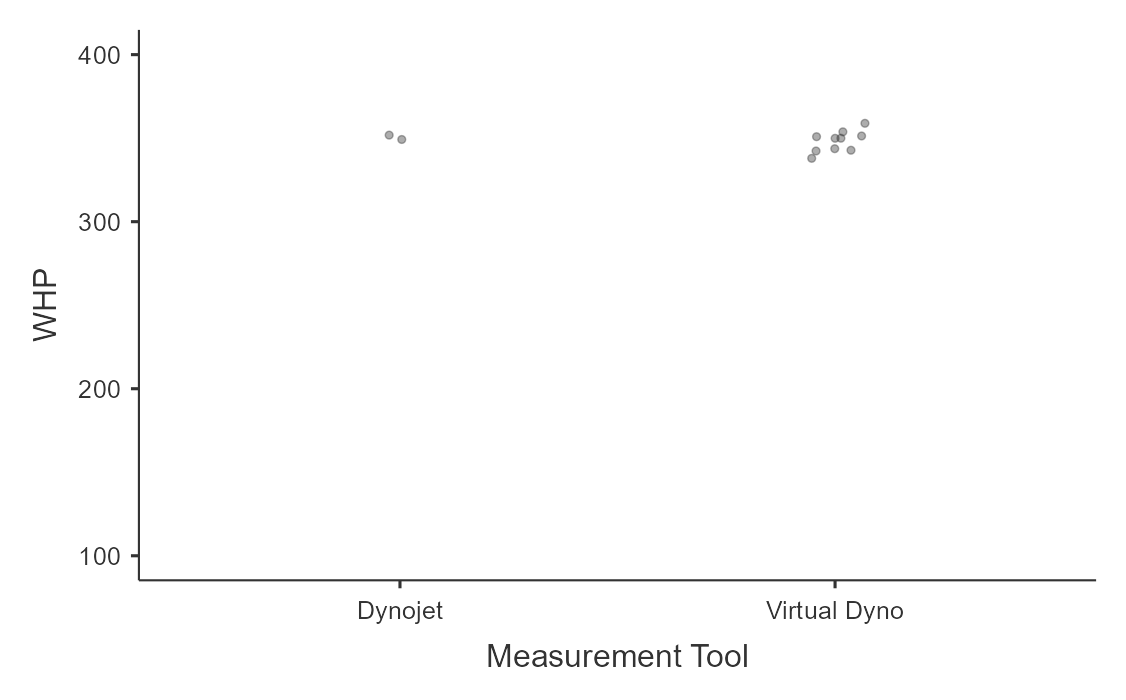
A comparison of the WHP means, hypothesizing that there is no difference between them, is performed using a t-Test to account for sample variance:
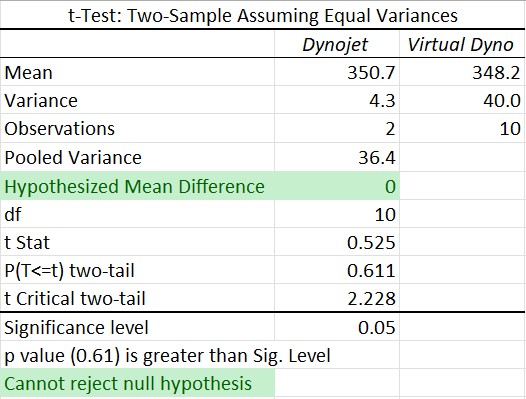
With a mean difference of 2.5 WHP it’s not surprising that the hypothesis that the mean WHP values are equal cannot be rejected.
Note: Due to when peak torque and peak wheel horsepower occur during a pull I don’t rely on the torque estimate from Virtual Dyno in the comparisons I make. I believe early in a street pull the boost is stabilizing and the car is settling into an acceleration rate and there is greater variability than later in a pull. Thus I only reference peak WHP.
For completeness, the Torque values are also compared. The wheel torque mean values are 370 (Dynojet) and 357 (Virtual Dyno) – a 13 WTQ difference (~3.5%). In this case, the sample difference is large enough that the hypothesis is not accepted.
Although the hypothesis that the Dynojet and Virtual Dyno are reporting the same WTQ values is rejected, I don’t believe that the difference is large enough to render the Virtual Dyno calculated WTQ value useless. It may be useful for relative comparison to other Virtual Dyno WTQ estimates of my GTI when following the recording process that I use.
While on the Dynojet dyno the GTI had E85 added to the gas tank to bring the ethanol content of the gasoline up to 30% ethanol.
Pulls made on the dyno with an E30 tune are shown next:
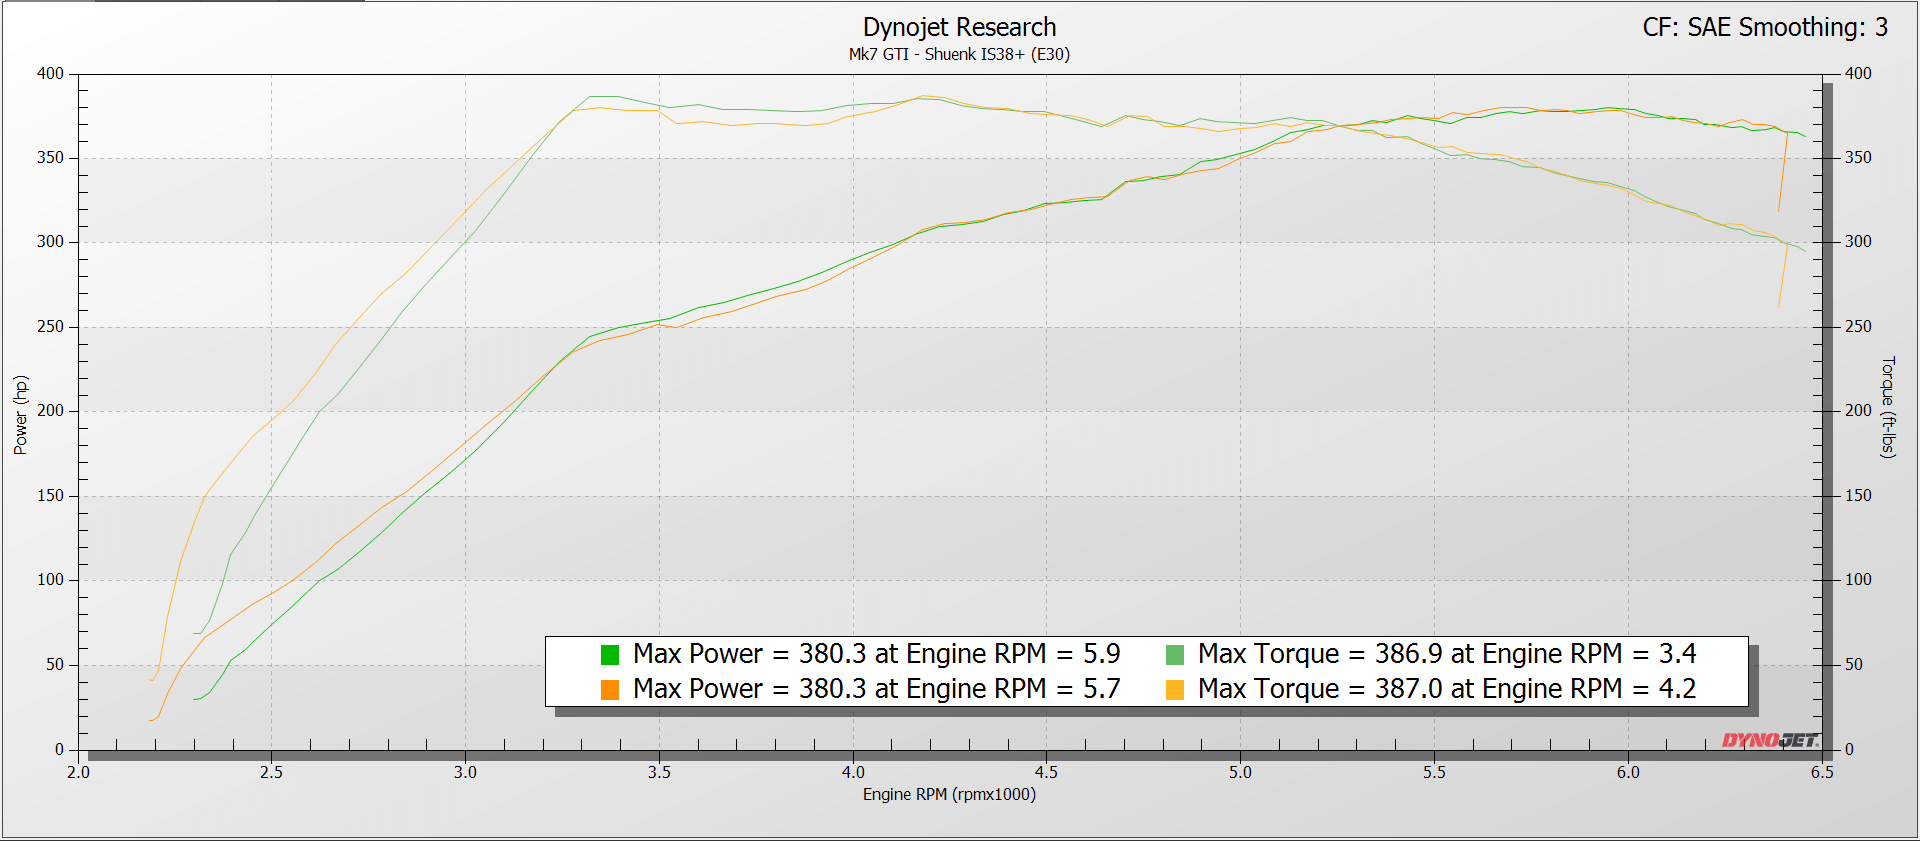
Peak uncorrected values are:
- Run 1 – 381.3 whp / 387.9 wtq
- Run 2 – 380.9 whp / 387.5 wtq
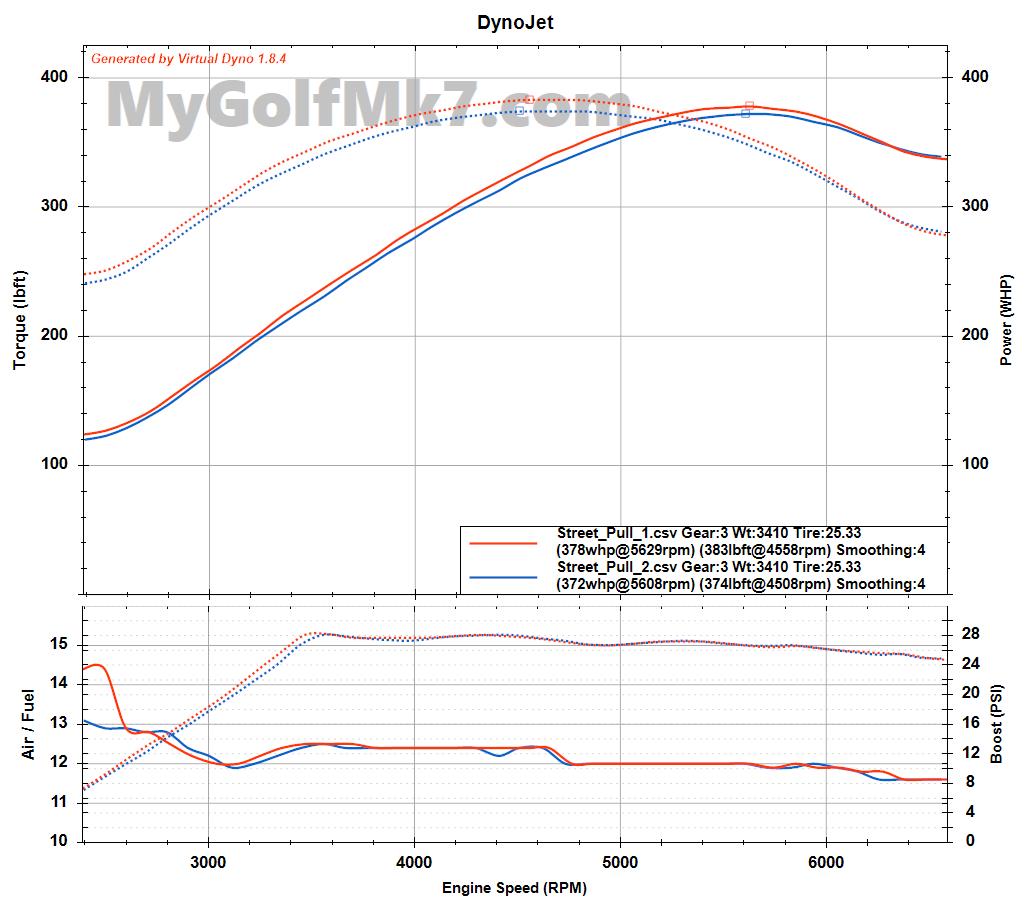
After finishing on the dyno and during the drive home there were two pulls made with the E30 tune. These are shown on the chart:
All E30 values are shown in the table:
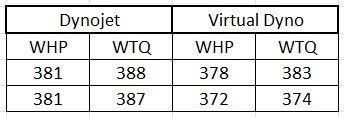
These results are illustrated using a dot plot:
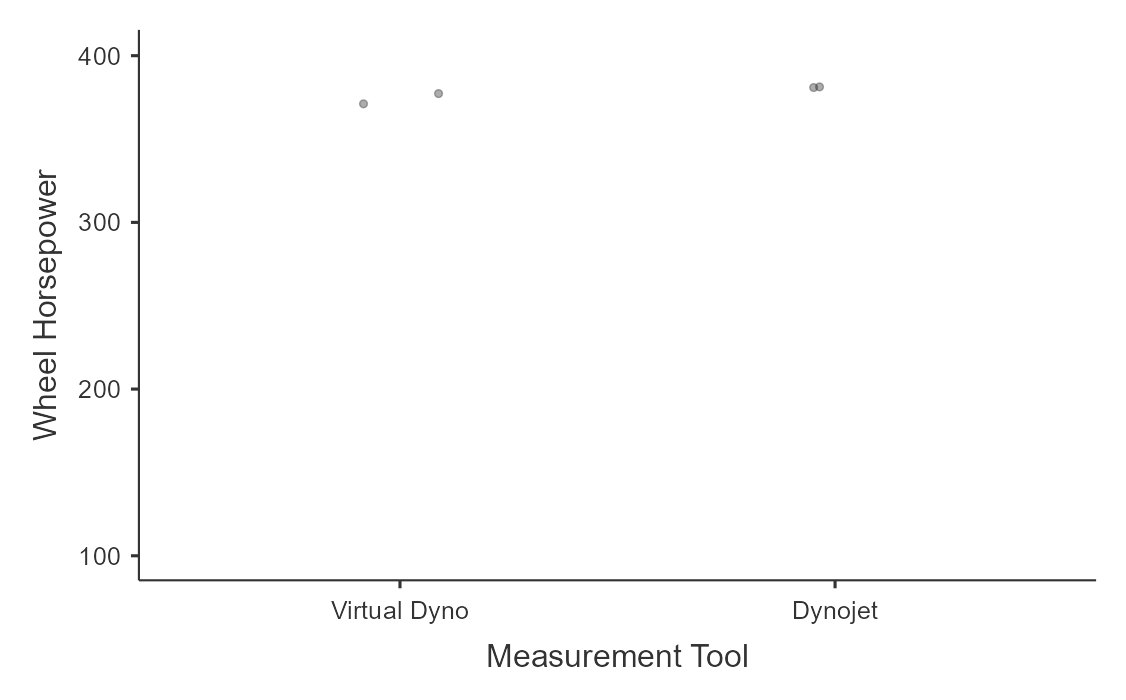
The Virtual Dyno estimated means are less than the Dynojet estimates by 6.1 whp and 9.2 wtq.
With only two measures for each measurement tool, I did not perform a t-Test with this data.
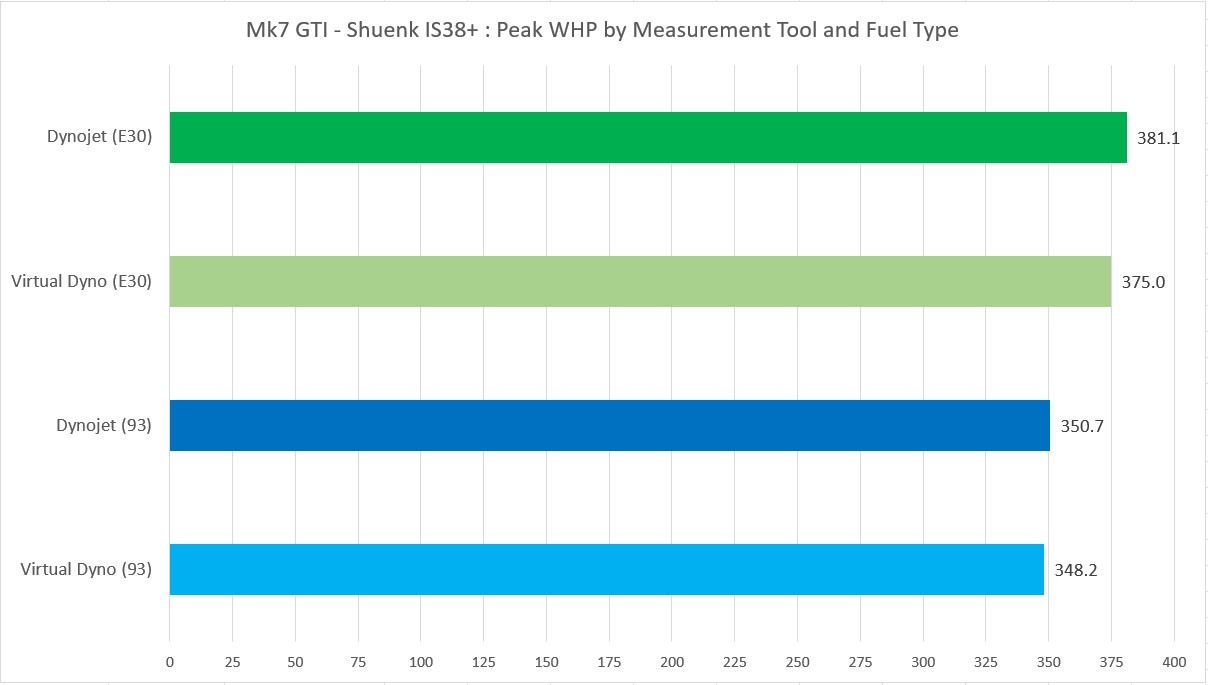
Shown next is a graphical comparison of the wheel horsepower estimates for both measurements tools for each fuel mixture:
Conclusion:
Wheel horsepower and wheel torque measurements from a Dynojet dynamometer are compared with Virtual Dyno estimates calculated using street data using a Cobb Accessport.
Comparisons are made using a 93-octane tune and an E30 tune.
Wheel horsepower estimates for the 93 octane tune differ between the tools by 2.5 wheel horsepower. A hypothesis that the mean values are not significantly different cannot be rejected.
Wheel horsepower estimates using the E30 tune differ by 6.1 wheel horsepower. Due to a limited number of sample data points no hypothesis test was performed with this data set.
Wheel horsepower estimates developed using the Virtual Dyno application are sufficiently close to measures made using a Dynojet dynamometer to be used as a measure of performance changes for my Mk7 GTI when following my data recording process.
References:
Counterpoint:
Previously when posting results using values generated with Virtual Dyno I have received feedback that the Virtual Dyno application does not produce reliable estimates.
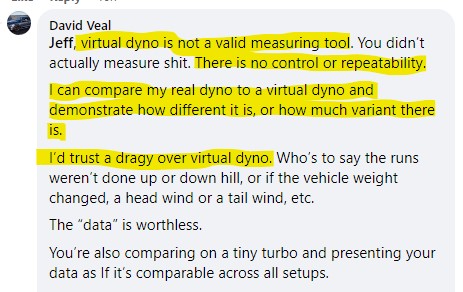
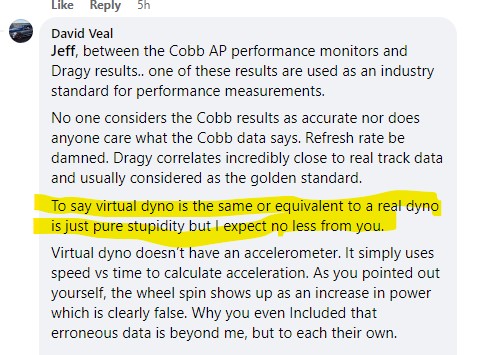
An employee from Equilibrium Tuning responded to a post I made that referenced using Virtual Dyno and gave their opinion on the application:

Observations:
David Veal from Equilibrium Tuning didn’t present any data from his dyno showing how the results he obtained with it differed greatly from those he got using the Virtual Dyno application.
Because I was able to realize comparable results with the Virtual Dyno to a Dynojet I attribute the seemingly poor results Dave At EQT obtained to differences in methodology.
Some potential sources of error on the part of Dave At EQT could be not properly accounting for the vehicle weight, not accounting for occupant and cargo weight, not properly entering the dimensions of the vehicle tires, selecting the wrong vehicle within the Virtual Dyno application, and recording data on the street under conditions where gravity can factor into the vehicle acceleration rate.
Another point to make here is about online discussions where an explanation for a claim by an enthusiast lacks evidence but a reference is given to “such and such is so because my tuner says so“, or “such as such is the case because EQT (or another tuning shop) says so“, and no evidence is presented.
Dave At EQT lacks evidence in support of his claims that the Virtual Dyno application produces unreliable results. The evidence I have collected does not support the claims made by Dave At EQT. The association of Dave with Equilibrium Tuning does not qualify as a substitute for evidence.
It is prudent for enthusiasts to question “tuners” and “vendors” about their claims and to request evidence to build confidence the claims have merit.
Just reading the article, as a researcher, this stands out to me.
The DynoJet had the SAE settings applied. You state you went to the raw data to get the uncorrected measurements.
Ok. But then when we look at the VD numbers posted, you are using a smoothing of 4.
Without showing all the data, it appears you were just using different smoothing to obtain the closest consistent numbers. That might not be the case, but without additional data, it appears to manufacture the results you want as you certainly make no effort to explain why you wanted “uncorrected” dynojet numbers and “corrected” VD numbers.
The correction factor and smoothing are different adjustments to the data.
No doubt if each post was peer reviewed there are numerous improvements that could be made. I’ve chosen to try and address topics that I encounter, which is already hard to keep up with.
“doesn’t have an accelerometer. It simply uses speed and time to calculate acceleration” David Veal
Sorry for my poor French but this dickhead has no place in engineering.
His statement is telling.