
Background:
Progressively decreasing acceleration times during tuning with Stratified and clear signs that the cause was poor traction with the road led me to look into how much the tire contact patch changes with tire pressure.
The hope was to find a “safe” lower tire pressure that would increase the tire patch to a size that would alleviate the traction problems.
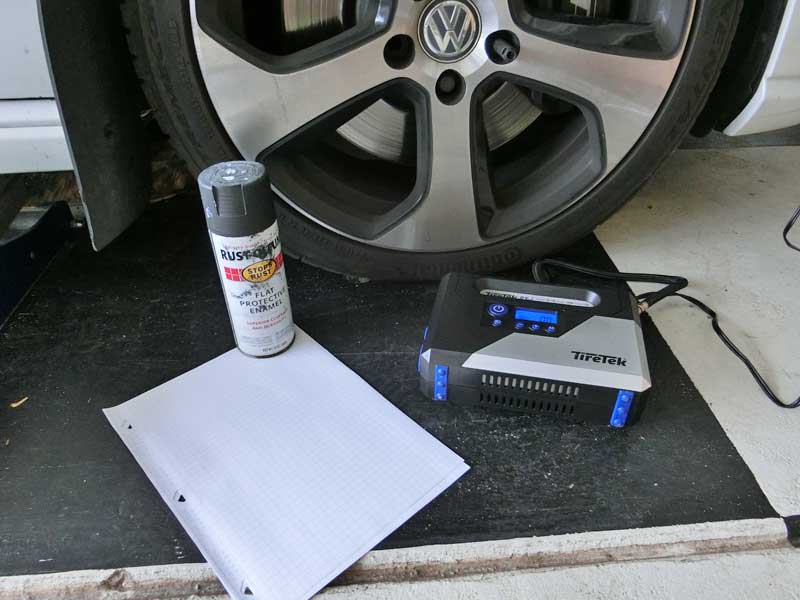
Setup:
The procedure for determining the contact patch was straight forward. A piece of paper would be placed on the garage floor underneath the tire. The wheel was raised off the floor, removed from the GTI, and then spray painted in the section of the tire that would be in contact with the ground.

The tire is then reinstalled on the GTI and then slowly lowered onto the piece of paper. After settling for a few moments the wheel is raised and the piece of paper removed.
The tire pressure would then be adjusted and the process repeated for pressures starting at 20 psi and increasing to 40 psi in 5 psi increments.
Results:
The first test result is shown in the picture below:
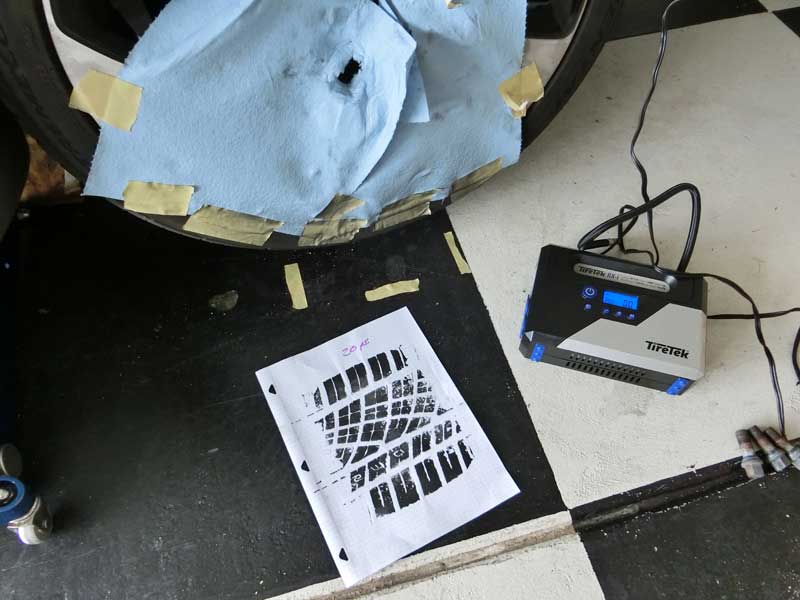
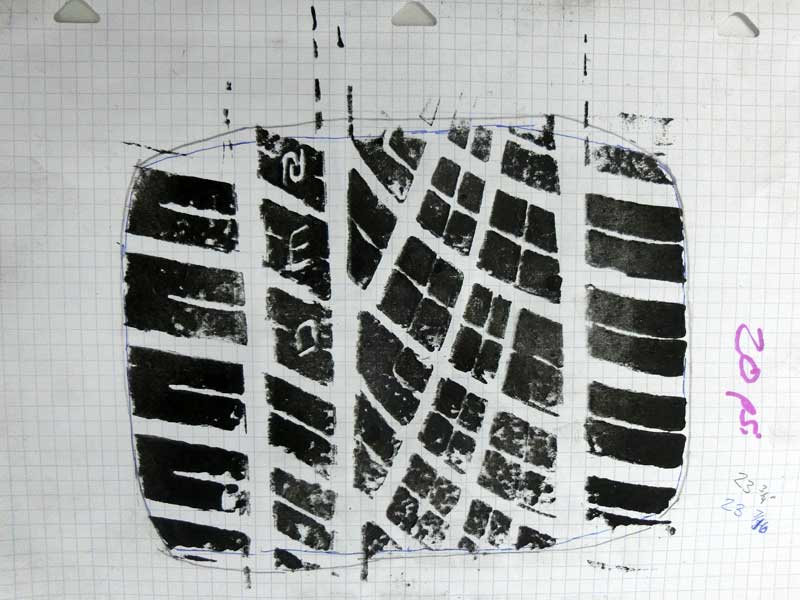
20 psi result:
The next result is at 25 psi:

The next result is at 30 psi:

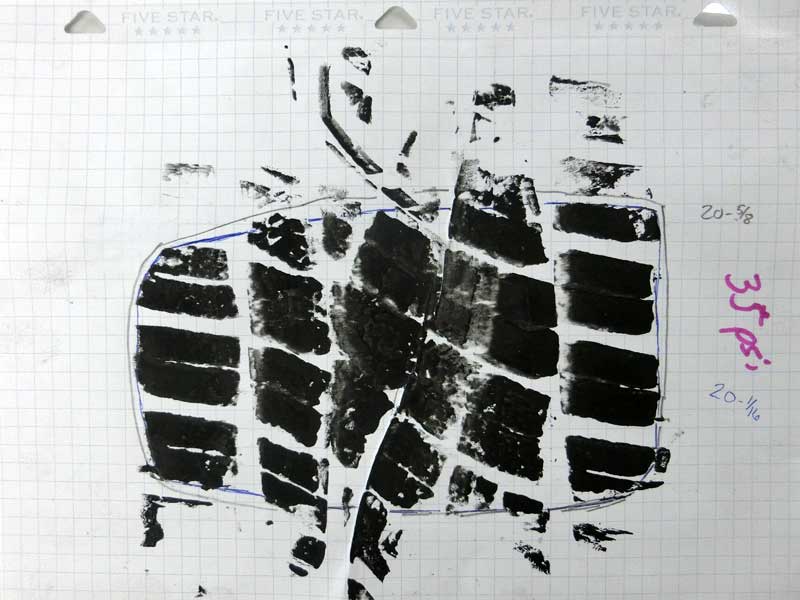
The next result is at 35 psi:
The next result is at 40 psi:

Analysis:
With the raw data recorded the next step was to analyze the results. The procedure to measure the contact patch involved using a piece of wire to trace the perimeter of the contact patch. The length of the wire was measured and the total contact patch area was calculated based on the relationship of the perimeter of a circle to the area.
This was an inexact method and was done with a loose interpretation of where the perimeter lay, and a tight interpretation of where it lay.
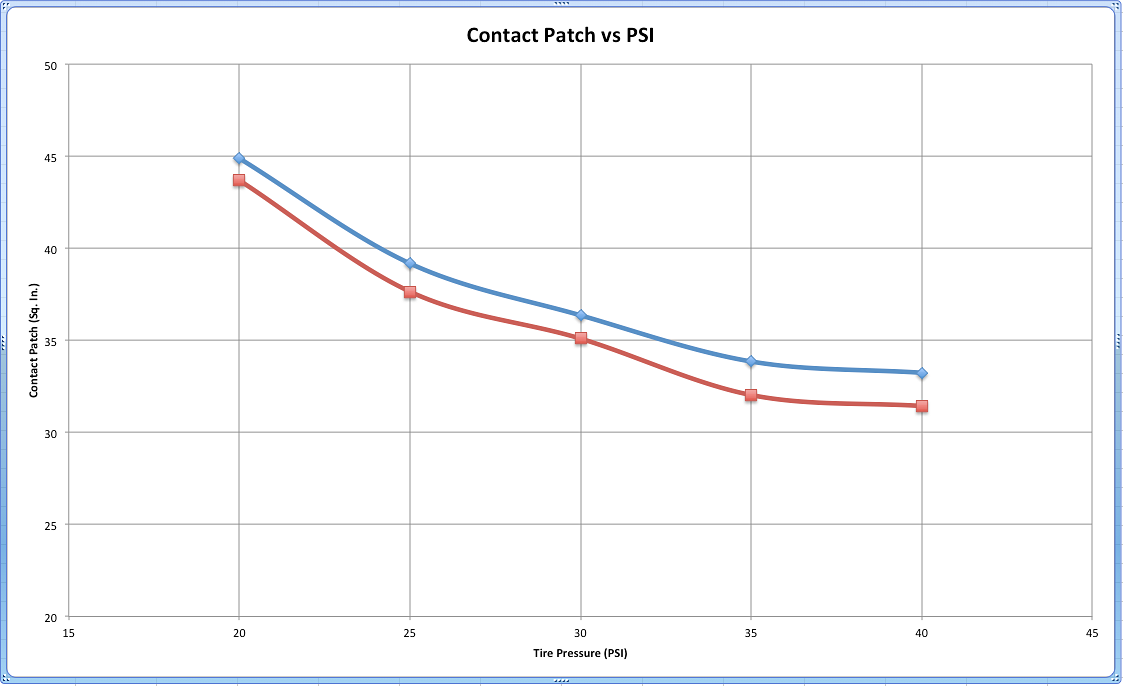
Patch Trace Chart:
The contact patch for each pressure is shown on the chart. The blue line is the loose interpretation, the red line is the tight interpretation.
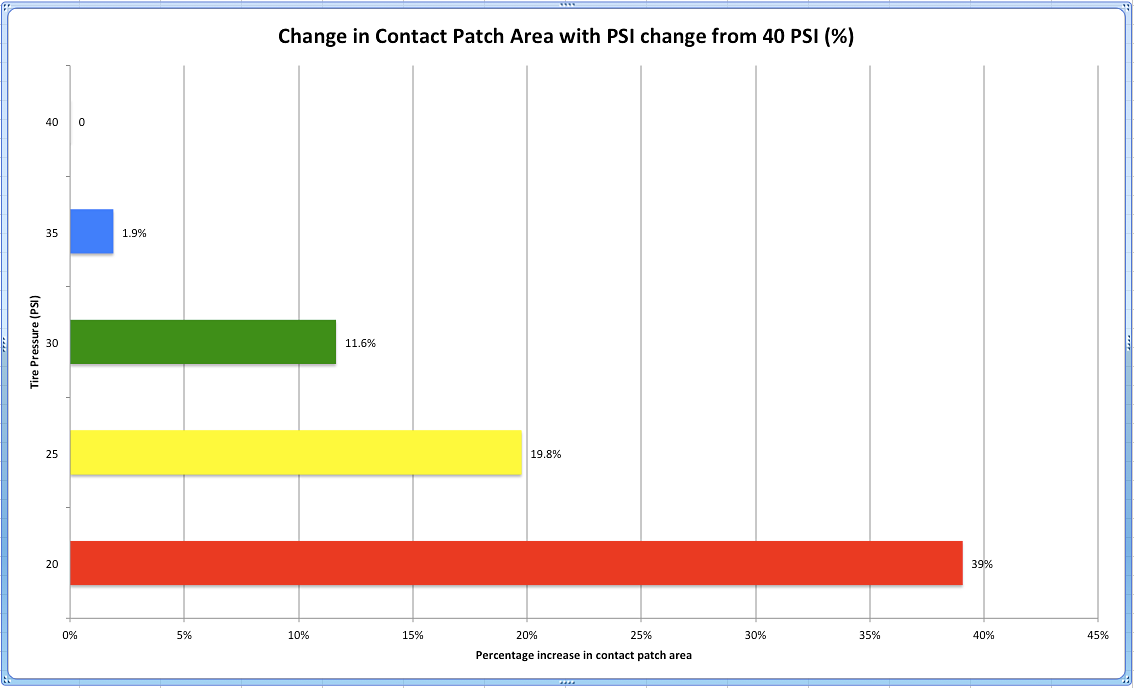
Using the 40 psi contact patch as the baseline, the change in contact patch area with psi was calculated for both measurement methods and averaged.
The resulting Bar Chart is shown below:
Conclusion:
The tire contact patch of a stock Austin wheel increases by nearly 40% when dropping the tire pressure from 40 psi to 20 psi.
This measurement method is going to result in a LOT of error because the perimeter of an ellipse is not a linear relationship with the area. Take the extreme case of an ellipse of 0.01mm height and 314 mm width – the wire will be 624mm long, but the area will be much much less than a circle with radius of 100mm.
A better approximation would be rectilinear based on the shapes, or scan it and get a more accurate measurement with graphic editing tools or a simple cad platform.
Thanks for the suggestion.
While I understand and agree with JonB on technicality, I disagree on the practical potential for error- or at least the significance of the margin. A 6″ diameter star drawing and 6″ diameter circle drawing will clearly have drastically different perimeter measurements when traced with a wire like was done here. But in this analysis, the sample shapes are similar enough to one another that I’d reasonably trust Jeff’s rudimentary measurement method in producing usably accurate data on pressure-to-patch relationships. I mean, we’re talking spray painted rubber on paper here, afterall. Lol.