
Introduction:
The video below contains a nicely documented dyno test of several intakes and intake configurations.
I don’t speak Polish so I can only look at the visual information provided.
Analysis:
In the process of watching the video and noting the results of each configuration, a few concerns entered my mind.
- Testing an intake system on a stationary dyno is not representative of the operating environment.
- Testing an intake system with the vehicle hood raised is not representative of how the vehicle will be configured when being driven.
- Testing with a chassis dynamometer includes a number of variables that can affect the response variables (HP & TQ).
- Is the measurement system (dyno) capable of measuring performance differences of these products?
- Does variation, bias, or inaccuracy in the dyno measurements make the data untrustworthy?
None of those questions can be addressed by viewing the video.
I recorded the results as each test case was performed, not realizing that at the end of the video there was a summary provided. In doing so I had the sense that as the testing progressed the products were performing worse.
| Run | HP | Time |
|---|---|---|
| 1 | 525.0 | 19:14 |
| 2 | 529.8 | 19:29 |
| 3 | 528.3 | 19:47 |
| 4 | 522.7 | 20:09 |
| 5 | 520.4 | 20:40 |
| 6 | 514.4 | 20:59 |
| 7 | 510.5 | 21:15 |
I paused after watching the first series of tests to look over the data.
This led to producing this scatter plot of the power measurement by run number:

Observing a trend in a test that ought to have a random outcome is a sign of something going on – possibly an uncontrolled variable affecting the response variable.
Since the data trend appears to have a time component to it, the measurements were plotted against the time into the testing session, using the baseline pull as the starting time. This is shown below:
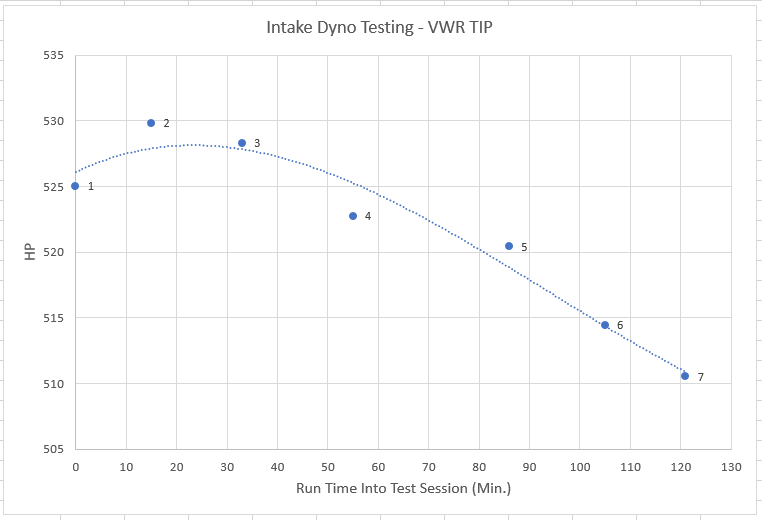
With the limited data available there was no more trend analysis to perform.
The next question I had was, how likely is this result? If each subsequent intake test outcome is either greater or less than the prior test, with a 50-50 chance of either outcome, what is the likelihood of an outcome like the one that was shown in the video?
Note: In the case where the stock intake was modified by removing the grate I realize this is not a good assumption. As it turned out, removing the grate led to a power decrease, supporting the hypothesis that the test time is factoring into the result since the removal of the grate has been shown to improve pressure drop through the air intake when the airbox was tested separately from the vehicle.
Looking at the scenario as a binomial probability, with an increase in HP being a success, and HP decrease being a failure, what’s the likelihood of having 1 success in 6 trials?

It turns out there is a 9.4% probability of this outcome, fairly small.
Looking at the data in another way, what is the likelihood of there being 5 consecutive failures (HP decreases) in 6 trials of a random event where there is an equally likely outcome of having a HP increase or HP decrease on a subsequent intake test?
In this case, the chance is even smaller, only 3.1%.
One assumption for using the binomial distribution is that each “trial” is independent. The very low likelihood of the measured results occurring with independent samples, ~3.1%, reinforces the hypothesis that the dyno test of the intakes involved a contributing factor that was not controlled, affecting the response variable (HP). Therefore the assumption of independence is most likely invalid.
Another assumption for using the binomial probability is that the probability of success (HP increase) is the same for each trial. Based on prior flow tests of some of the intakes used in this test, this assumption is expected to be false. But, for everyone that does not believe a flow test means anything in the “real world”, we will hold this assumption to be true.
Conclusion:
With limited data available to analyze, the results that can be reviewed indicate a strong likelihood that the measured HP output was affected by more than just the intake air box that was installed on the vehicle.
The HP measurement plotted versus Runs and Time shows a trend of decreasing power output during later test runs.
The data generated on the dyno is low confidence due to the apparent influence of a time factor on the HP measured.