
Background:
One of the claimed benefits of a “pro” tuned TCU is faster shift time. Even between “pro” TCU tunes, there are claims that some shift faster than others.

Note: The slight jump in RPM (above) at time 315 is a result of accelerating quickly during a turn on a patch of sand and the wheels slipping.
I’ve seen the claim of faster shifting speeds made a number of times but haven’t ever seen evidence that would demonstrate that one tune enables faster DSG shifting than another.
With several DSG tunes available to me I decided to make a comparison between one that is stock-like and the EQT tune for the DQ250 DSG.
The stock-like tune is a product of HP Tuners self-tuning software that has some customizations to the shift points, but no other changes from the stock settings.
Comparison Approach:
To compare the data I am using an approach suggested by someone who confidently told me that there are differences in shift speeds between tunes.
This approach entails looking at when the engine speed (RPM) begins to drop following a reported gear shift and when the engine speed begins to increase in the new gear.

On the chart above this shift time is the time period between the downward arrow and the upward arrow.
Note: This approach might not be valid. It seemed reasonable and I have no other “better” ideas so I figured I’d see what results.
Data logs were filtered to identify “upshift” points and calculate the shift time.
The minimum allowable Accelerator Pedal Position (APP) for qualifying data is 20%.
If the accelerator pedal is lifted, resulting in an upshift, that data is not included.
Because of the amount of data that needs to be sifted through an algorithm was written to automate the search process. There are some shift behaviors that get through the screening that produce invalid results.
Some of the data points shown below are not valid, the goal is to collect enough data that trends can be observed despite the “bad” data points.
An example of a bad data point is when a shift occurs and then the engine RPM begins to drop, momentarily it stops dropping and increases slightly, and then resumes dropping. The first level-out can result in an abnormally fast shift time.
Test Results:
The chart below shows the HP Tuners developed tune shifting times for 1st to 2nd, 2nd to 3rd, and 3rd to 4th. The number in parenthesis in the legend is the number of data points.
The shift time is plotted for each gear change against the Accelerator Pedal Position (APP) at the time the gear change is reported in the data log.
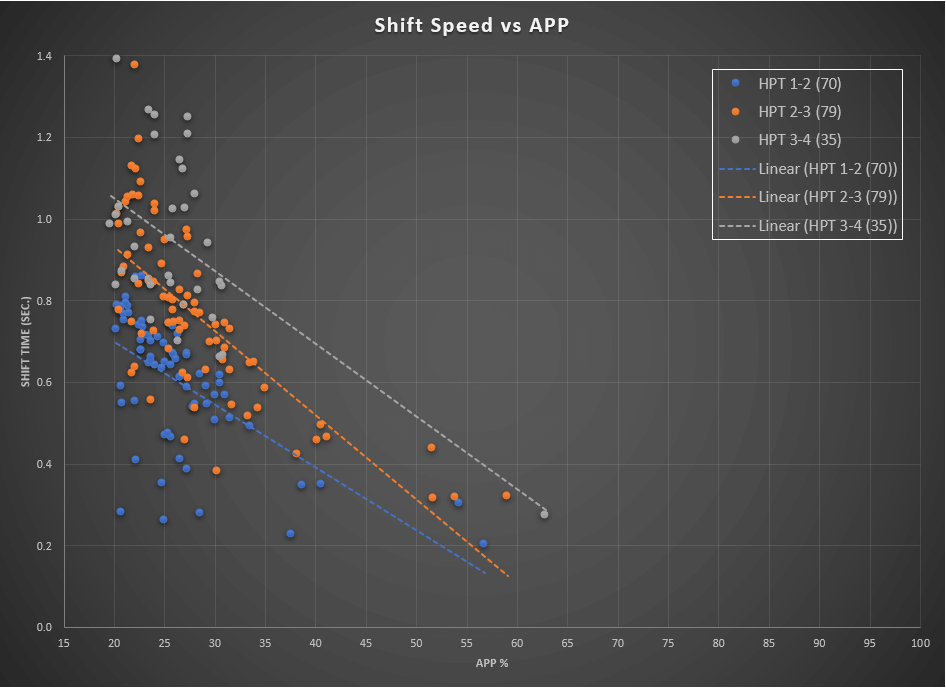
Two trends are apparent.
- The shifting time increases as the higher gear shifts take place. I.e. 2nd to 3rd takes longer than 1st to 2nd.
- With increasing accelerator pedal position the shifting time decreases.
There may be other factors affecting the shift time as evidenced by the large variation in shift time in the 20-30% APP range.
The next chart shows the data recorded using the EQT tune:
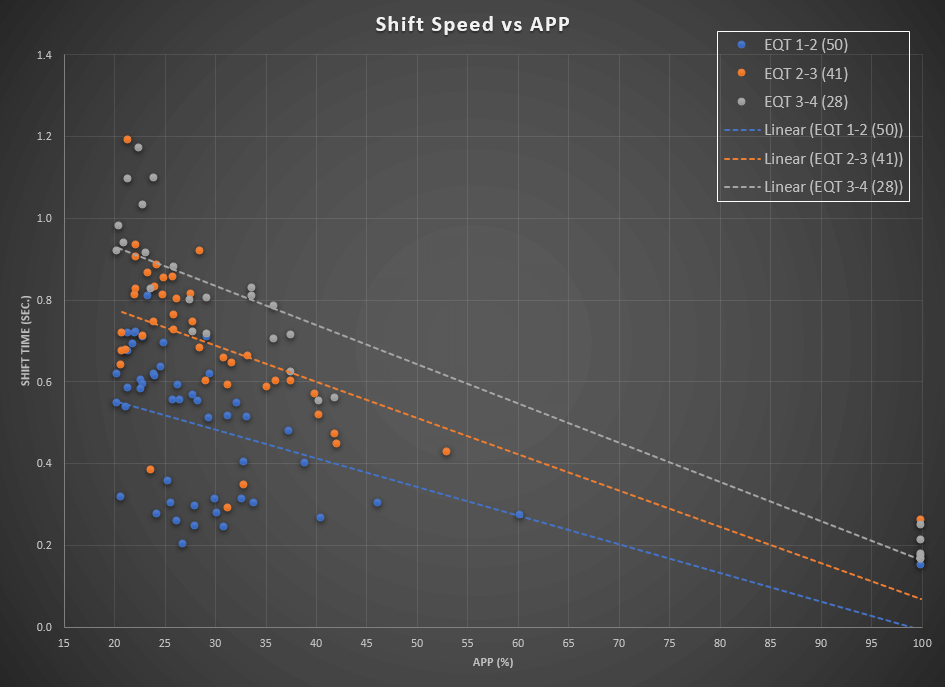
The same trends are found in the EQT data.
The next series of charts compare the data from the HP Tuners tune and EQT tune for each gear shift.
1st to 2nd:
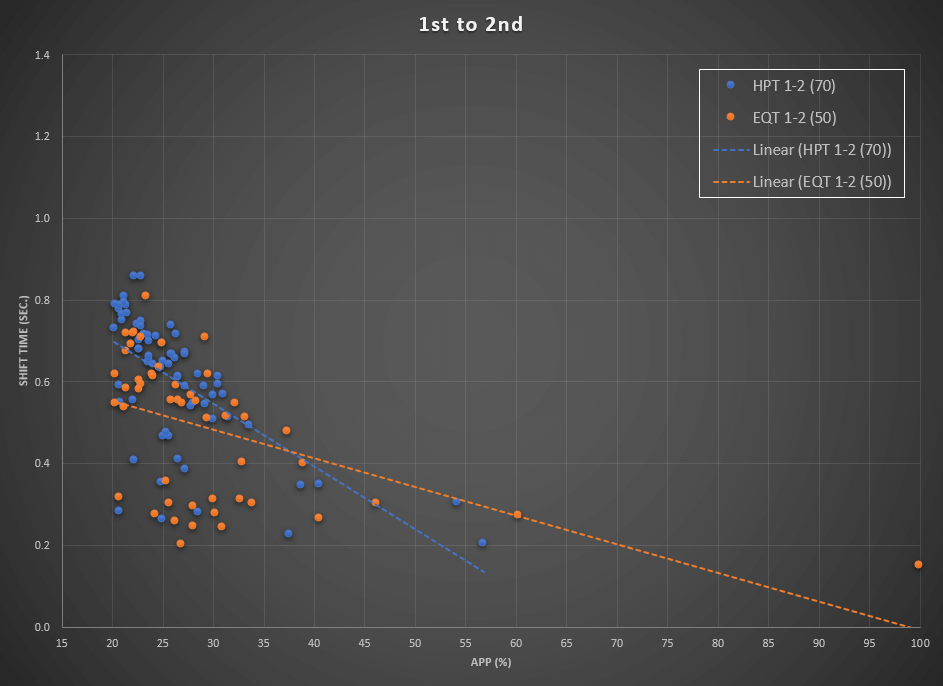
Discerning if the “pro” tune is faster than stock is inconclusive from this data. The linear trend line suggests that the EQT tune may produce a slightly faster shift, but there are almost 50% more data points for the HP Tuners tune and with enough data points the EQT trend line might be pulled upward.
Another consideration is the potentially invalid data points that appear for both tunes. The fast shift times at low APP are low confidence data points.
2nd to 3rd:

These results show trends that are similar to the 1st to 2nd shift data points.
Note: I have a single data log from a manual transmission user that has one relevant data point. It is shown by the yellow triangle on the chart above. A future effort may be to obtain more manual transmission data to see how it compares with the DSG shift speeds.
3rd to 4th:

The 3rd to 4th data does not show any significant differences from the other gear shifting.
The trend lines are consistent throughout the gear changes but inconclusive.
Conclusions:
Using the method described above the shifting time of the DSG transmission was measured for two TCU tunes.
Shifting time with both tunes is observed to grow longer with numerically higher gear shifts. With increasing accelerator pedal input the shifting times decrease.
Comparison of a “pro” tune with a stock-like tune is inconclusive due to significant variation in the data points for each tune as well as a large variation in the number of data points for two of the three comparisons.
If the maximum difference in the linear trend lines at low APP for the two tunes is assumed to be valid, the difference of shifting time might be around 0.2 seconds.