
Background:
Occasionally when presenting the results of flow testing a part there will be concern raised that the flow testing isn’t the ‘real world’. The explanation given is that pressure and temperatures on the vehicle are much different than the flow bench rendering the flow bench readings of little use.
Similar to a dynamometer not being the real world, the flow bench is also used to measure specific attributes for making relative comparisons. Also like a dynamometer, a gain recorded using the flow bench should correlate with a real world change.
Data Review:
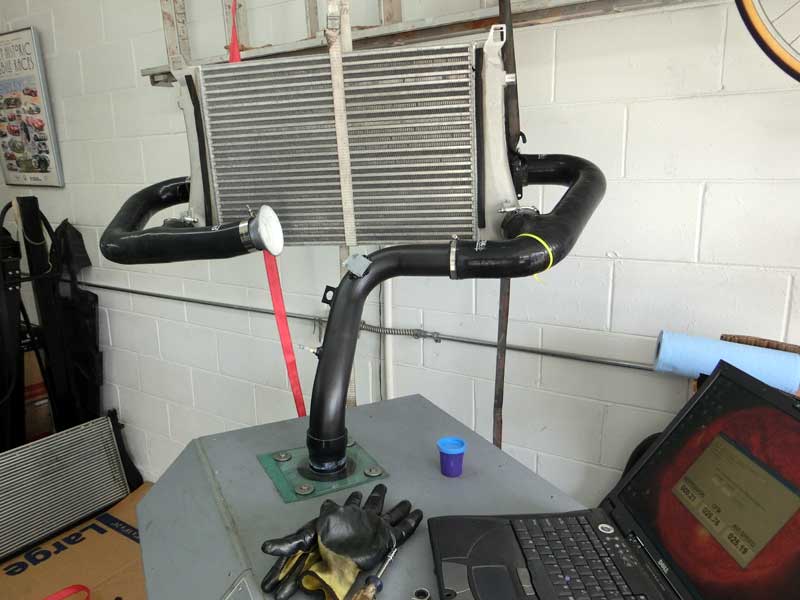
For the past few months a number of intercoolers have been the subject of flow bench testing to compare relative pressure drop performance. Several of the intercoolers were installed on the GTI and tested to record temperature and pressure drop during vehicle operation. Data is now available for:
- Stock GTI
- Integrated Engineering v1
- Unitronic
- Majesty FMIC Bicooler
- do88
The vehicle testing consists of a 3rd gear, full throttle acceleration, past 6,000 RPM. Maximum pressure drop for each intercooler, from the turbocharger outlet, at the turbo muffler, to the intake manifold, has been recorded.
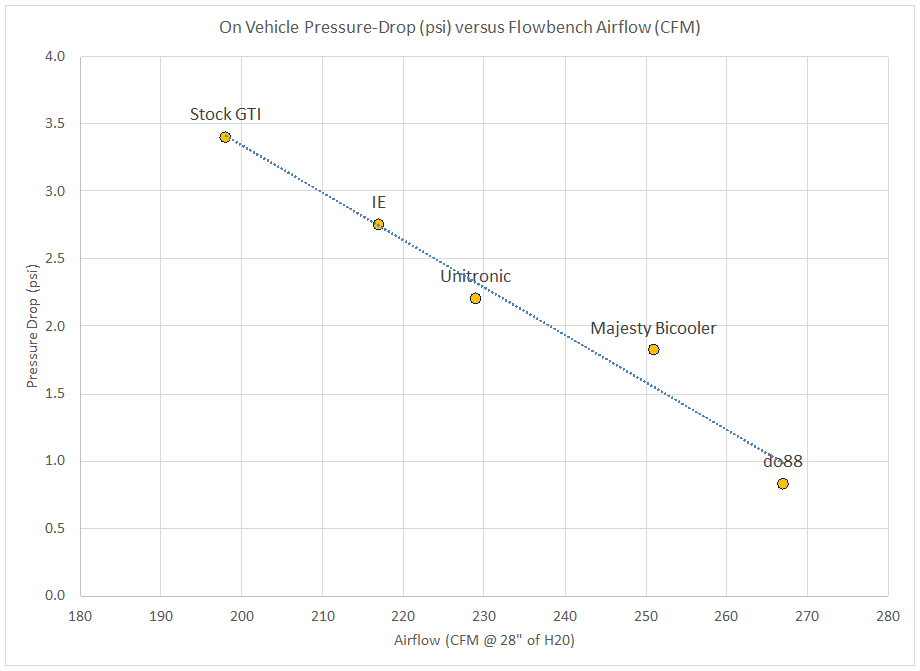
With a few ‘real world’ data points available the vehicle pressure drop readings are plotted against the respective intercooler flow bench airflow values.
Conclusion:
There is good correlation between the flow bench readings and the pressure drop readings taken during vehicle operation. As a tool for measuring relative pressure drop performance of these intercoolers the flow bench provides reliable data.
Great test actually measuring real pressure drop, but unfortunately I don’t understand the logic behind the graph and therefore the conclusion. What are the yellow points (real world psi, look ut that psi in the flow bench test and corresponding CFM?) and what does the blue line mean?
Just in my mind, each real world psi should correspond to one CFM as the VOLUME flow into the engine is the same… So I can’t make sense of what is actually compared.
Maybe I’m stupid…
Thanks for clarifying.
The chart is a scatterplot. Each labeled circle is where the measured value for flow bench airflow and on the vehicle pressure drop for each intercooler meet. Increasing flow bench airflow correlates with lower on vehicle pressure drop. The dotted blue line is a trend line for the data points, to illustrate that there is good correlation. Having good correlation means the intercooler airflow readings from the flow bench can be used to reliably predict the relative performance in terms of pressure drop across that IC on the vehicle.
Thanks. Having some food made my brian work again so I got it.
Interesting is that your testing isn’t only relevant, it seems the bench flow results underestimate the importance of IC flow a lot given the real world results. 2,5 psi is a huge difference.
Since the flow bench is ‘bench’marked at approx 1psi, the do88 result of approx 1psi drop gives us a reference of 267CFM volume flow. Given that charge pipes flow about the same (~270CFM@1psi), this means they each should take about half or 0,5psi, giving a volume flow of approx 190CFM which correspons well with the 2l displacement at 6000rpm x VE.
At that flow the OE is expected to give 1psi from the flow bench test, or 0,5psi difference. But real world is 2,5psi difference or five times bigger!?!
So IC flow is really important and reading the flow bench results straight without fully understanding what’s going on doesn’t at all show the importance.
Don’t fully grasp why real world results are that big a difference, considering:
– Boost (increased mass flow) should increase pressure drop a bit but not that much at all.
– High temperature reduces mass flow and should reduce pressure drop?
– The ECU will target a certain mass flow as it targets torque. A lesser IC will give higher temps and thus the ECU will up boost. Compound with the higher IC pressure drop, this makes the turbo work harder again, giving higher temps again. This ups volume flow before the IC exit, generating larger pressure losses.
Still doesn’t fully explain the real world difference perhaps, but there are definitely compounding effects that spiral to a much bigger real world difference than the flow bench predicts. Any further insights welcome as not many people fully grasp this subject…
Besides the addition of the charge pipes there is also the throttle body that doesn’t get added into the flow bench measurement. Going back through some results with hot side charge pipes attached, the airflow through the stock IC drops from ~195 to ~175. With the 1stracinguk, it drops from ~245 to ~200 with the hot side charge pipe and turbo muffler.
The increase in air density between the flow bench and on the car at 27-28 psi is about 2-2.5x, which would have some significant affect on the pressure drop.
I haven’t tried extrapolating the results from the flow bench to the vehicle before.
So, from this data am I correct in assuming that the Do88 intercooler has the lowest pressure drop while in use, compared to the other coolers tested here?
Yes