
Background:
When I started looking into an aftermarket DSG tune for my GTI I found that comparison data was almost non-existent and I was left relying on vague descriptions like “it shifts quicker”, or “downshifts are smoother”.
To make a better informed decision I knew it would be necessary to quantify the DSG shift performance. How to do that was at first not clear but after some trial and error some key performance measures became evident.
Measures:
Three aspects of the TCU control that I find important, and can quantify, are upshift schedule, accelerating downshift schedule, and coasting downshift schedule. (By schedule I mean the pattern that the TCU exhibits.)
Upshift Schedule:

The chart above shows the engine speed at which the TCU shifts from 1st to 2nd gear for a given amount of accelerator pedal depression. The more the gas pedal is pressed the later the TCU shifts from 1st to 2nd, indicated by the logged data (blue and yellow dots) trending upward as the Accelerator Pedal Position (APP %) increases to a more depressed pedal (higher APP %).
Blue dots were the original response, yellow dots were after revising the tune based on my request for a change in shift schedule. The solid red line represents the shift schedule I was targeting to have. The dotted red line is a trend line for the yellow dot data.
In first gear a pedal position of 5-10% is light throttle, this would be the amount of throttle used when going through a busy parking lot or a store drive-through. The chart shows that originally in this situation the TCU would not shift until the RPM was greater than 2,600. After the update this was lowered so that the shift to 2nd gear occurs at around 2,100 RPM.
When this shift occurs affects the ‘feel’ of the car and importantly is a matter of personal preference.
From approximately 10-20% APP the rate of acceleration is appropriate to moving from a stop, in traffic, to get up to road speeds. Think of being in traffic at a stop light or at an intersection and moving into the flow of traffic.
Here again in the original case (blue dots) the TCU holds off shifting until around 2,600 RPM. This is helpful by keeping the car in a gear that takes advantage of engine torque to get the car moving promptly.
The target response (yellow dots) aimed to have a transition from an earlier upshift to second (in the 5-10% range) to a higher RPM upshift, equaling the original tune around 18-20%.
The result is that the original tune operates at higher engine speeds in first gear while the revised tune shifts into second gear more quickly with the difference between the two decreasing as pedal input is increased.
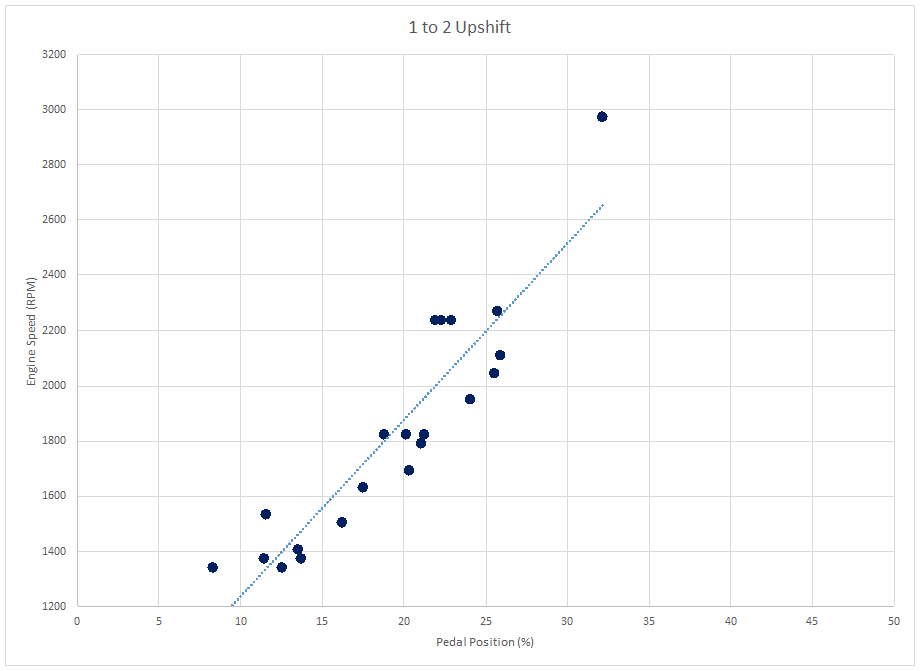
Finally, the entire target line could be shifted as shown in the example above with the Cobb Sport tune. The slope of data (blue dotted line) is not too different than the red dotted line of response in the first chart.
What is much different is at what engine speed the upshift occurs. At 10% pedal input the Cobb Sport shifts from 1st to 2nd at approximately 1,300 RPM. In comparison the 5150 revised tune (yellow dots) shifts at 2,200 RPM for the same pedal position.
At 25% pedal the Cobb is shifting at approximately 2,200 RPM where the 5150 revised tune shifts at 2,800 RPM at the same pedal input.
The driver senses the Cobb tune more quickly shifting into second gear, which is commonly described as ‘racing for a higher gear’.
Conclusion:
With three different responses to choose from the preferred response depends entirely on the driver.
This explanation has presented three examples, but there are many other variations possible and it is unlikely that any two TCU tunes would “behave” the same.
A driver would be best served to understand what their preferences are and then try to match those with one of the many tune options.