
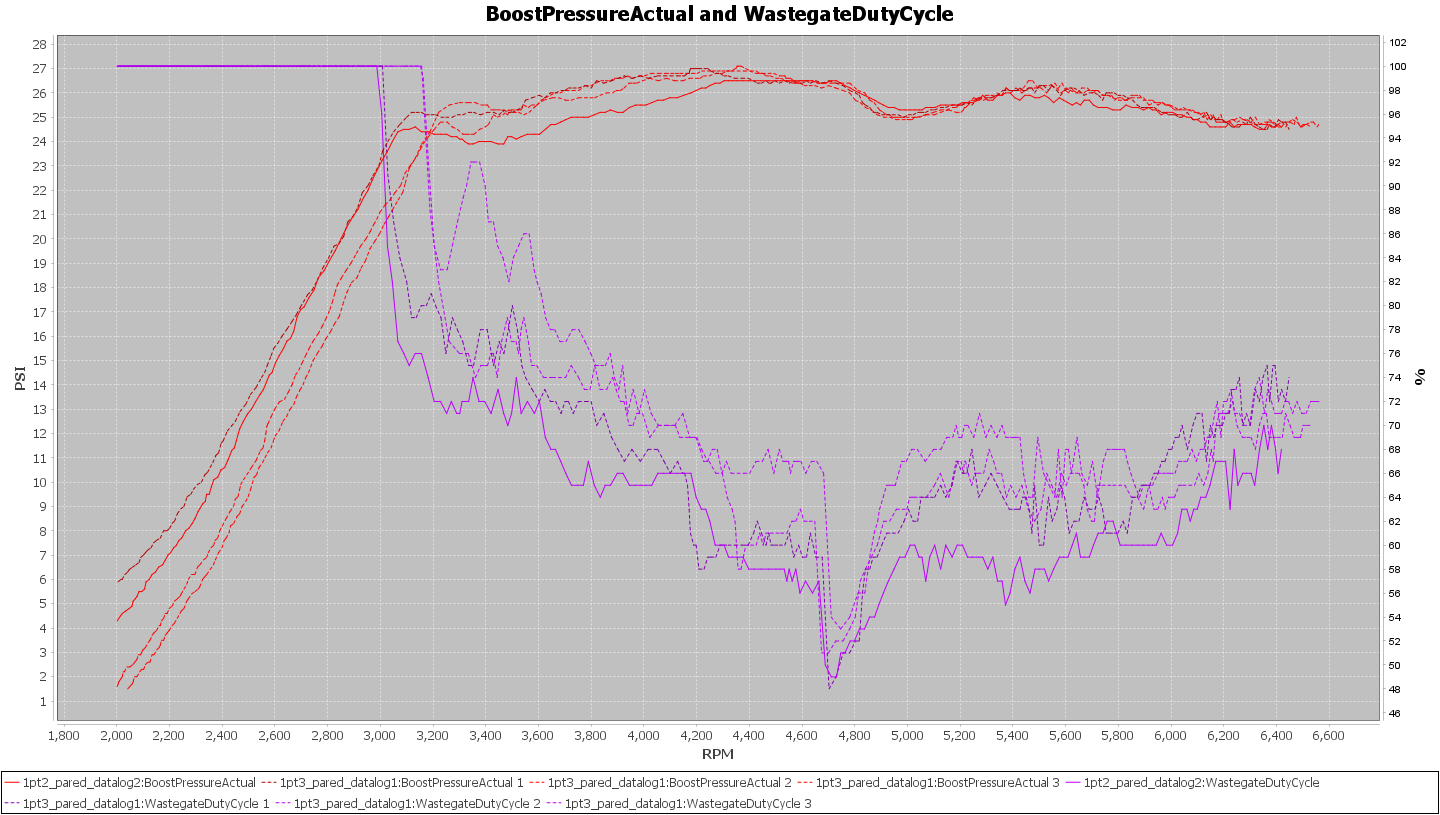
This update to the E30 tune continues the progress of small adjustments with the boost pressure and timing curves.

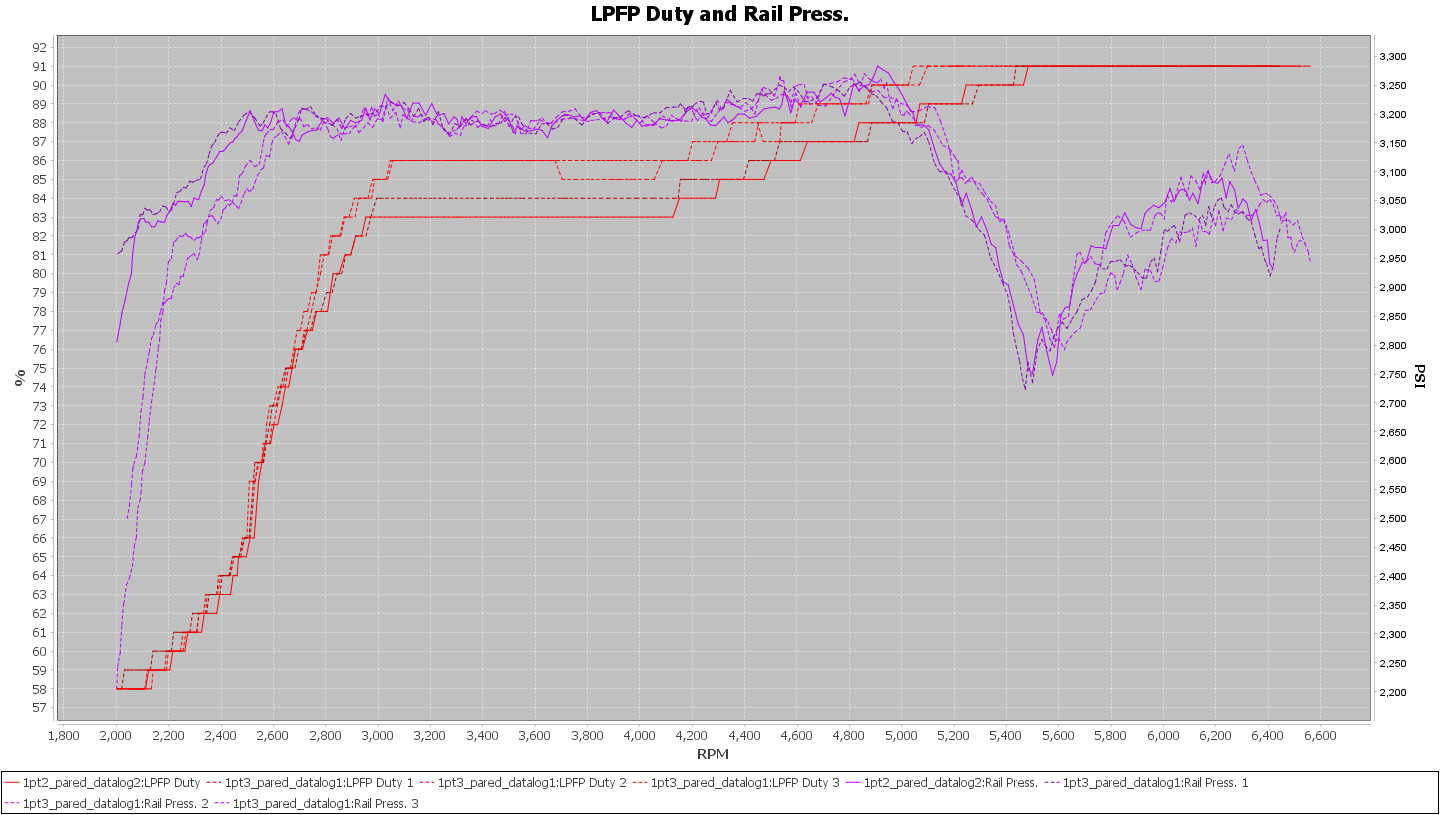
The dip in the Fuel Rail Pressure persists.
Note that the Rail Pressure axis scale exaggerates the dip to make it look like a canyon.

The LPFP Duty Cycle is pushed slighter harder with this revision:
To try and gain some more insight to the fuel situation a pressure sensor is added inline with the Ethanol Content Analyzer.

The low pressure fuel supply pressure steadily decreases as the pull progresses:

Note: The steadily decreasing fuel pressure that is dipping below 40 psi by the top end of the pull is resulting from the higher airflow at higher RPM. The correspondingly higher demand for fuel to maintain proper AFR is taxing the Low Pressure Fuel supply. Even though the Low Pressure Fuel Pump (LPFP) is being driven up to 91% duty cycle it is barely keeping up with demand. For the current fuel setup, stock LPFP and an aftermarket High Pressure Fuel Pump with E30 fuel, the car is at the hardware limit, an upgraded LPFP is needed to go further.

Continuing the data review, Air-Fuel Ratio remains about the same:

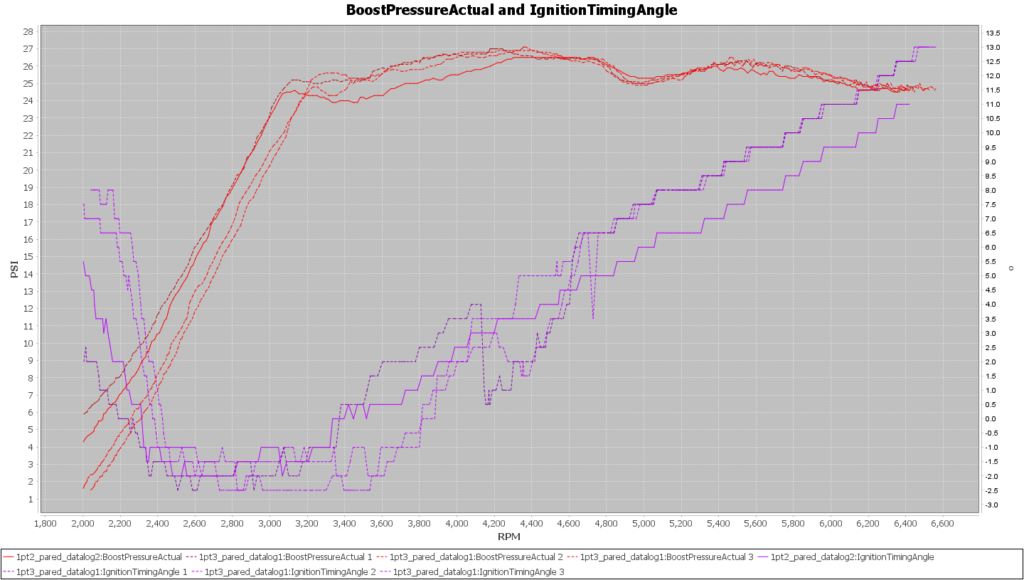
Timing is a little higher near the top end, but wheel slip is causing problems soon after boost levels off:
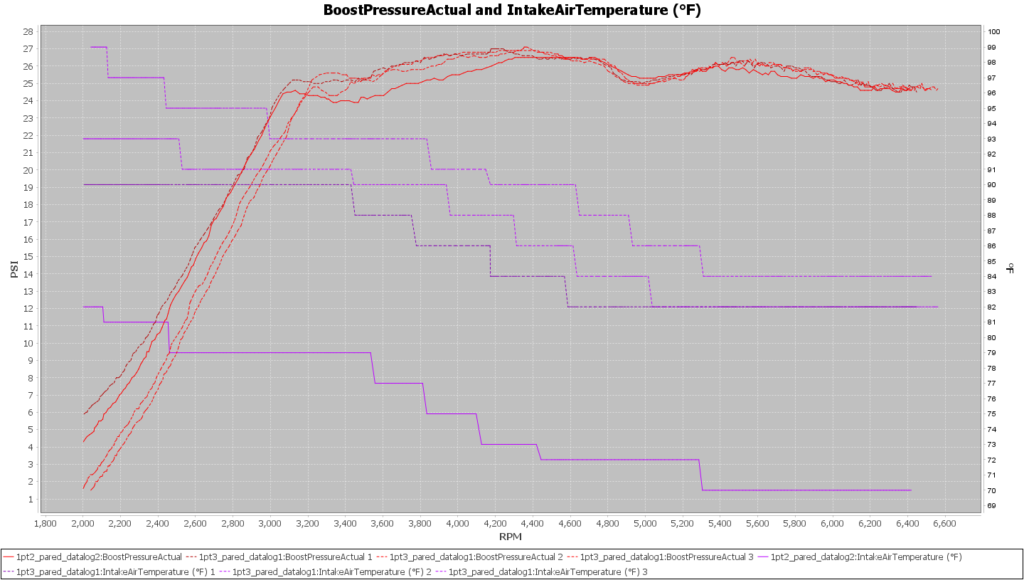
Intake Air Temperature is a bit higher for v1.3, a result of the change in season:
Acceleration time increased slightly with this revision. The three bars to the right are the pulls with this v1.3 tune.

My initial thought was that the warmer air temperatures might be driving this:

It might be the air temperature is contributing to the slower times, the dark blue dots are these latest three pulls. The other consideration is that wheel slip may be occurring more. If power output is continuing to rise, and the tires are spending more time slipping rather than accelerating the car, logically the acceleration time would increase.