
Background:
Turbocharger compressor efficiency is a property that indicates how much work is required for the device to compress the intake air compared to how much work would be required in an ideal process.
The property can be related to the air temperatures entering and exiting the compressor, although for the ideal case the exit temperature must be calculated since the ideal case will never exist in the real world. Estimating the ideal case exit air temperature requires knowing inlet and exit pressures, and the specific heat of the air at the inlet and exit temperatures. Bottom line, determining the compressor efficiency takes some effort.
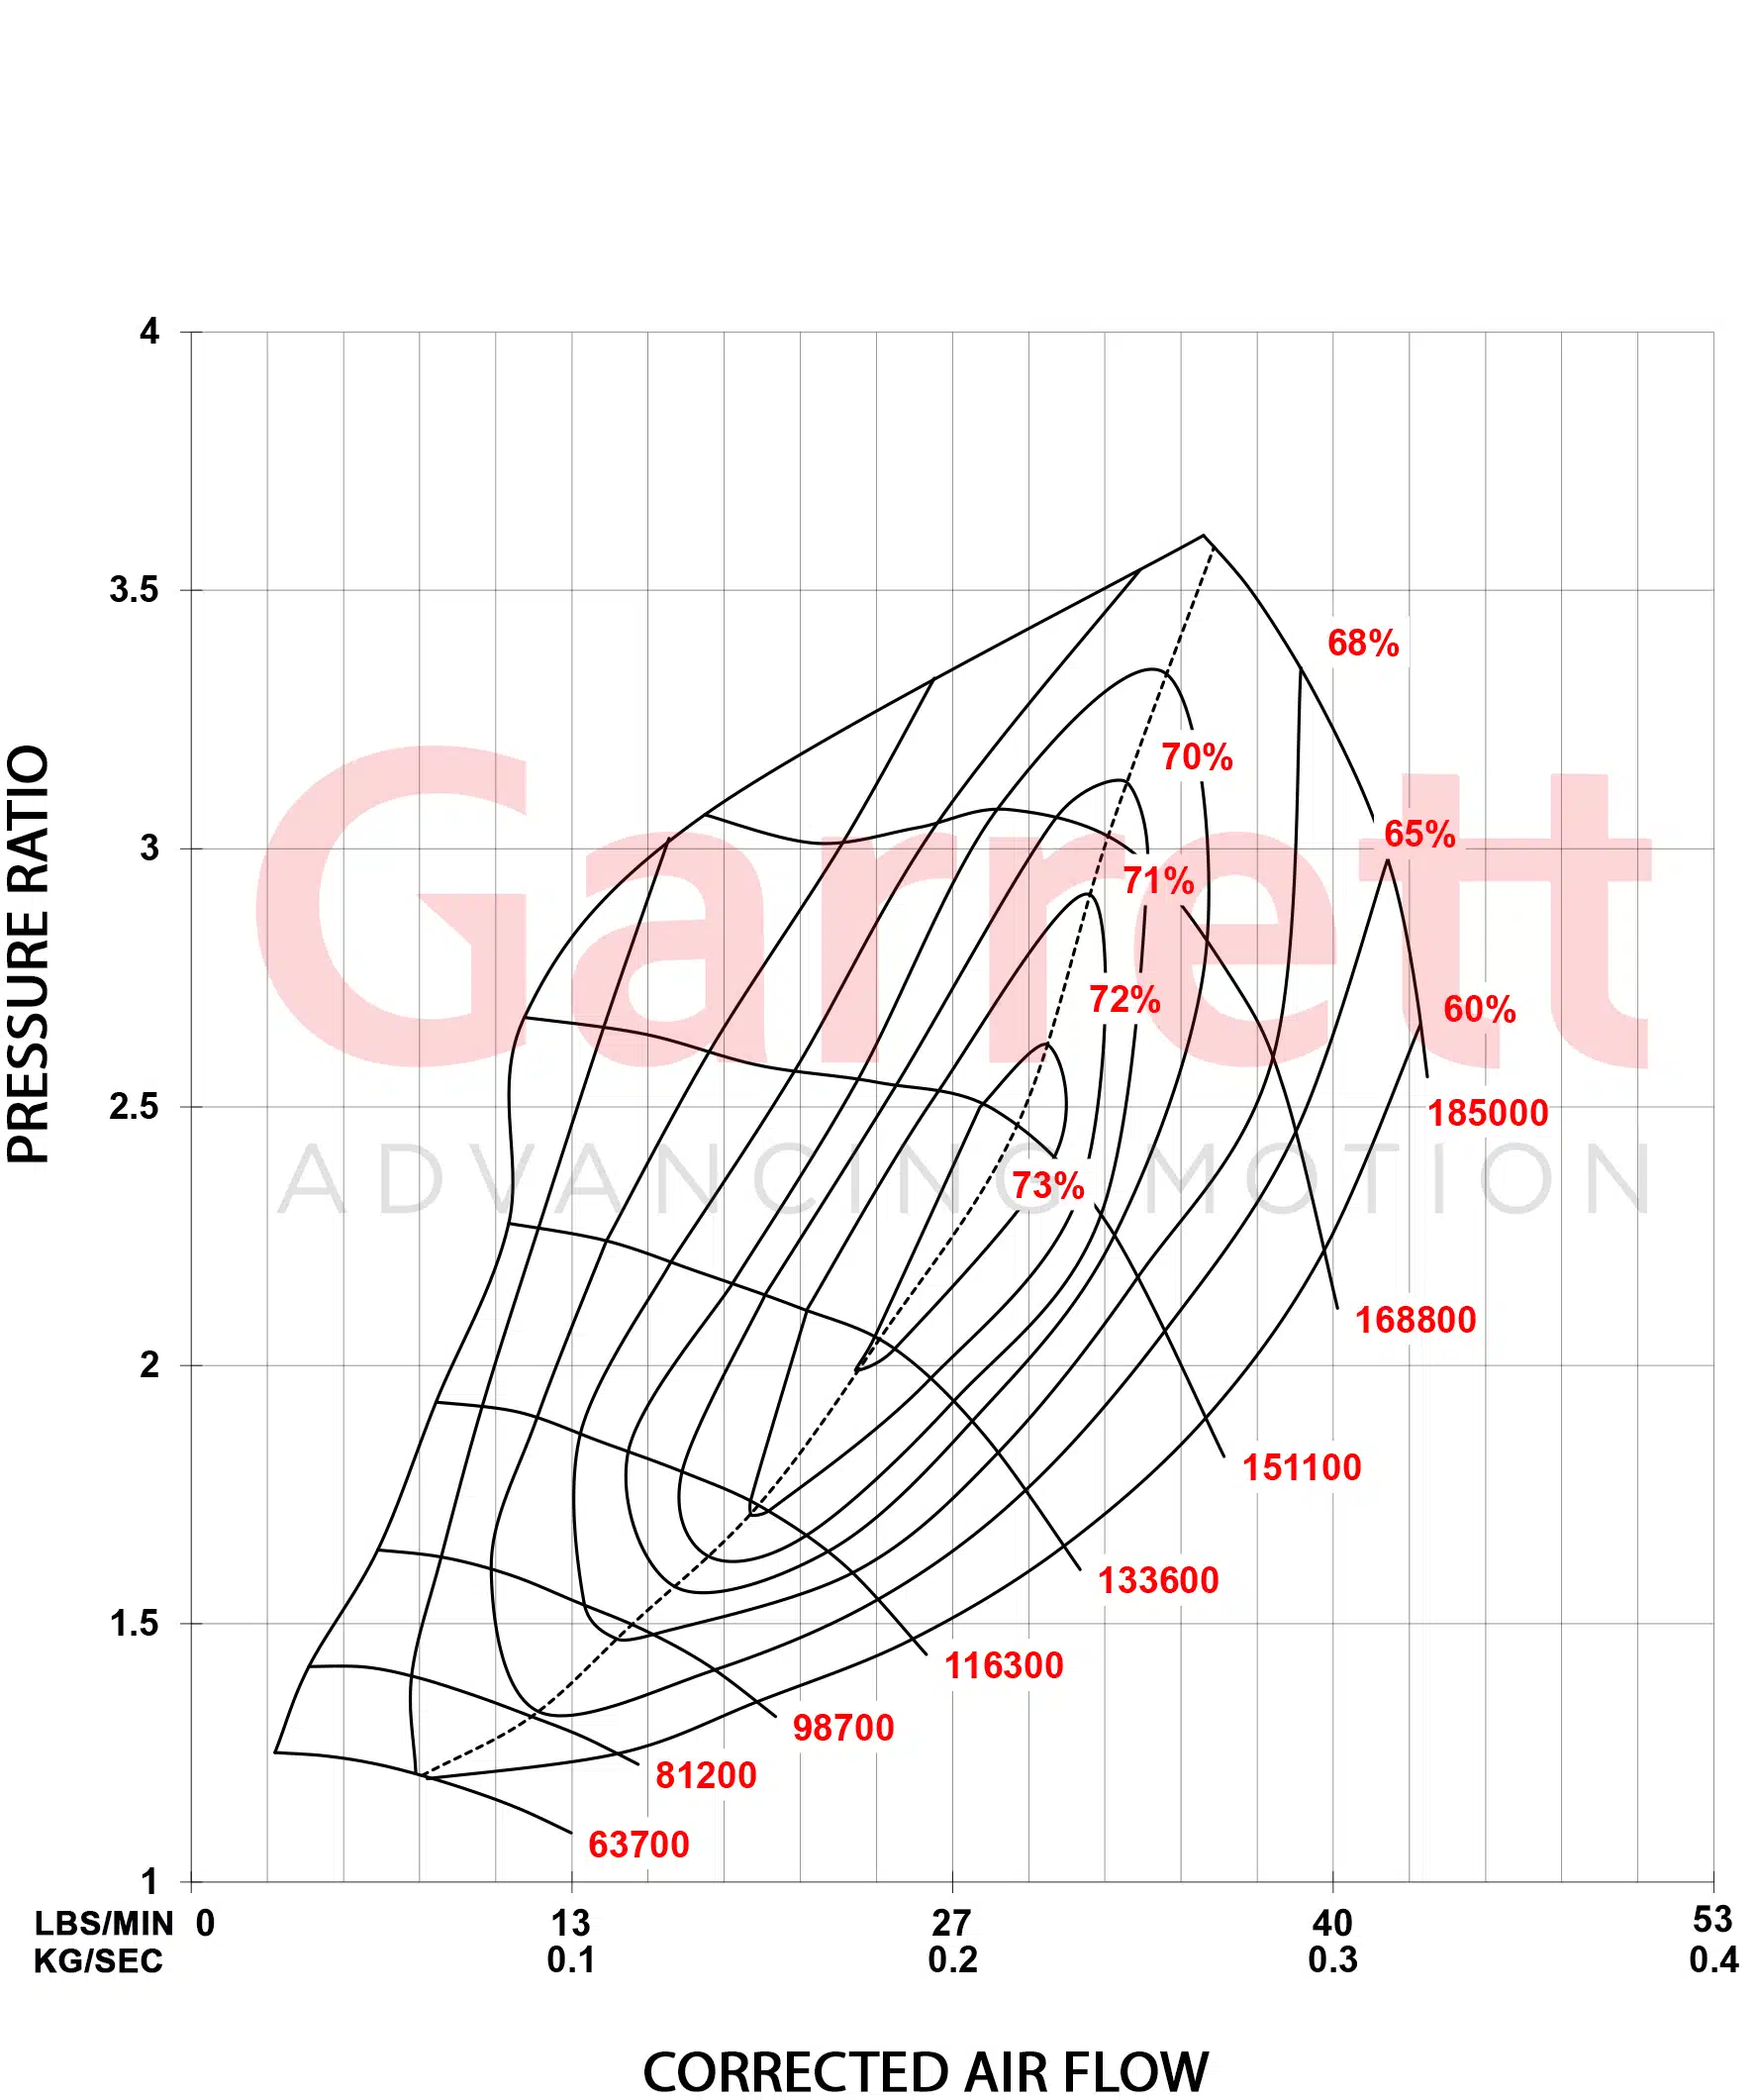
This efficiency is usually provided on a turbocharger compressor map as efficiency “islands”.
The example below is from Garrett’s PMAX Stage 1 turbo for the Mk7. The percentage values are the compressor efficiency at different operating points.
Vendor Example:
I came across this bit of information being presented by Equilibrium Tuning on the product description page for their Vortex Turbocharger.
Below is a chart showing just how quickly the EQT Vortex can spool. This was done on the road in 4th gear (2015 Golf R DSG) on E30. You can see that the turbo hits 27psi right at 3000RPM and holds it to redline with ease. You can also see that the Intake Air Temperature barely moves through the entire pull. This shows how efficient the turbo is at these boost/power levels.
EQT Vortex Turbo Product Description

Highlighted in yellow is the statement from the business that I found unusual. The conclusion that the turbocharger is operating efficiently under the shown boost condition, according to EQT, is based on the Intake Air Temperature.
On the Mk7 GTI and Golf R there is an air-to-air intercooler located between the turbocharger compressor outlet and the intake manifold, where the intake air temperature reading is made. This part has a significant contribution to the air temperature.
Air leaves the turbocharger at the part shown in red. It then travels through the parts in green, including the Intercooler, and the air temperature is measured by the IAT sensor which is located just after the part shown in blue.

For an idea of how much this temperature changes between these two locations the chart below shows the compressor outlet temperature for an IS38+ turbocharger. This is the purple line that is increasing with time. The temperature at the intake air temperature (IAT) sensor is shown by the red line.
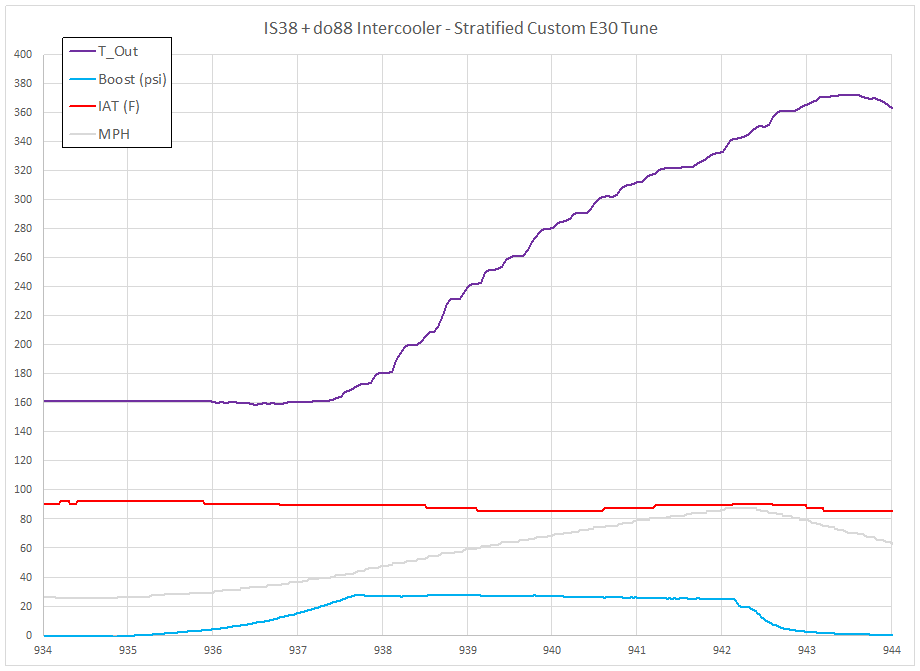
What is odd about the statement EQT has made about their Vortex turbocharger is that they are concluding how the turbocharger is affecting the compressor outlet air temperature, the purple line, by only using the information contained in the red line.
It’s not evident from their product description how they are using the IAT (red line) to calculate the compressor efficiency.
Even if they were to somehow determine the compressor outlet temperature from the intake air temperature, there are several other measurements from the turbocharger that are needed to estimate the compressor efficiency.
Comparison data:
How does this data compare with an IS38 turbocharger that is factory equipment on a Golf R?
Note: This data is from a Shuenk IS38+ turbocharger, not the IHI IS38. The Shuenk turbo is intended to be a direct replacement for the OEM IS38, being of the same dimensions and working with OTS IS38 software. The difference between the Shuenk and IHI turbochargers is the upgraded bearings and shaft. I’ll address this subject again in the conclusions.
The data from the IS38+ turbocharger example above can be compared with the data presented by EQT.
EQT states that the Vortex turbocharger is operating at 27 psi from 3000 rpm to redline.
The boost curve shown below is for the IS38+ turbocharger being used for comparison:
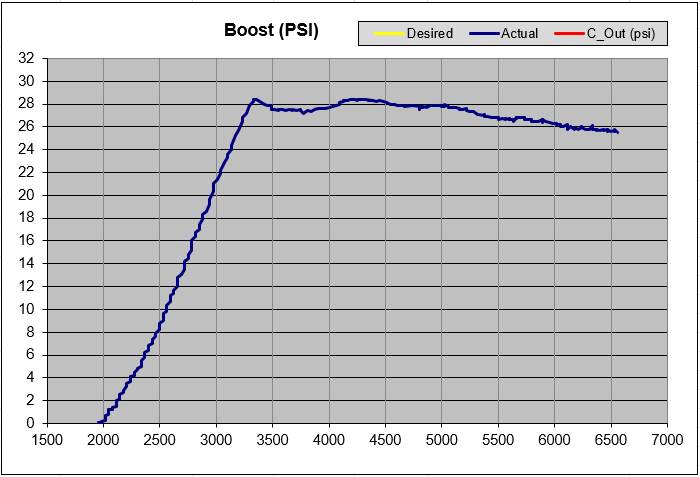
Initially, the boost pressure is 28 psi, then after 5000 rpm gradually tapers down to just below 26 psi after 6500 rpm.
Adding the IAT to the boost curve and rescaling the axis to be similar to those used by EQT results in the following chart:

Note: As identified on the chart, the do88 intercooler is being used during this data recording.
Next, the EQT IAT data is added to the chart and shifted upward to match the starting conditions of the IS38+ data log.
Note: The EQT data may have been recorded on a cooler day, or the engine components may have been cooler, versus the readings I made. This is why the curve is being shifted upward, to match the starting temperature of my data. Alternatively, I could have shifted the IS38+ IAT data downward to match EQTs starting IAT data. The goal is to have a comparison of the shapes of the curves since this is what EQT is pointing out in their product description.
The composite chart is shown below:
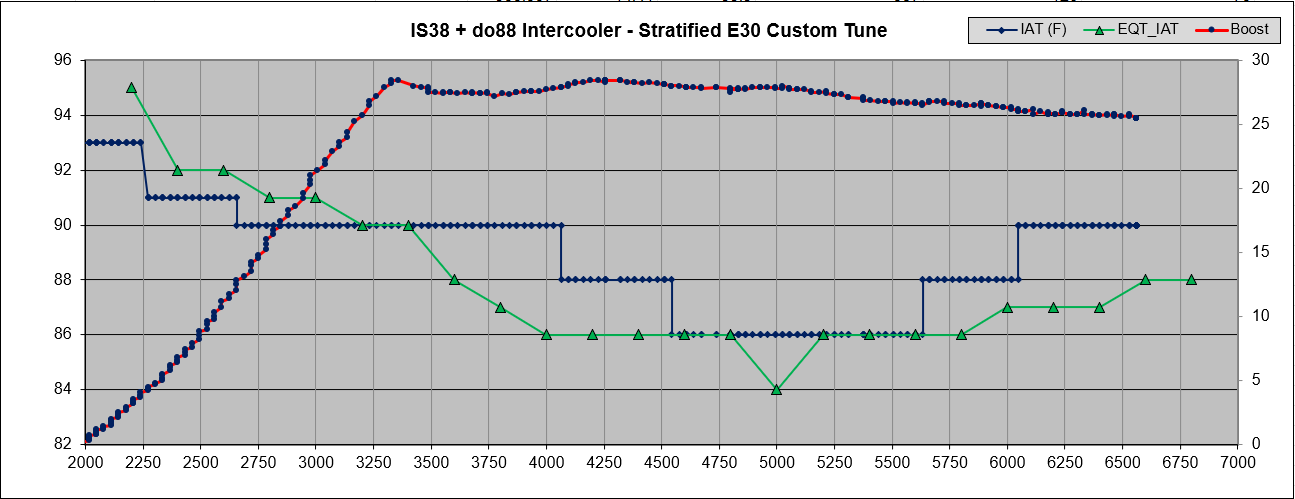
There are some small differences between the IAT measured using the Vortex turbocharger and those with the IS38+ turbocharger. The difference is mostly around 1-2 degrees with a momentary 4-degree Fahrenheit difference.
Note: EQT does not indicate what intercooler was used when they recorded their data.
Comparing the EQT results to the IS38+ turbocharger, the IS38+ appears to produce intake air temperatures similar to those of the Vortex.
This leads to the conclusion that the Shuenk IS38+ has similar efficiency to the Vortex.
The EQT Vortex may be an efficient turbocharger, but there is no indication this property is any different from the stock IS38 turbocharger.
Conclusions:
EQT makes a claim that Intake Air Temperature (IAT) measurements they have recorded demonstrate that their Vortex turbocharger is efficient.
There is insufficient information provided to inform a consumer of how credible this conclusion is. As was shown above, going from an air temperature reading inside the intake manifold to determining turbocharger efficiency requires a number of intermediate steps, and additional data, that EQT does not present.
Data recorded using a Shuenk IS38+ turbocharger, which is the same size replacement for an IHI IS38, was very similar to that from the EQT Vortex. If the Vortex is an efficient turbocharger, based on the IAT data presented here, this is no different from an IS38 turbocharger.
IS38+ Disclaimer:
The Shunk IS38+ is not an IHI IS38 turbocharger, but it’s really in close in terms of what parts were changed (bearings & shaft) and what aren’t changed (compressor and turbine wheel dimensions), insofar as the effect on compressor efficiency.
So how much did that factor into this comparison? My assessment is that it is little to none. Here’s why I think this.
The contribution an air-to-air intercooler makes to intake air temperatures is enormous, just look above at the difference between the purple line and red line. By the end of the pull, the IC is cooling the charge air by nearly 300 degrees Fahrenheit.
In comparison, most compressor maps I’ve seen for modern turbochargers show efficiency to be around the mid to low 70% range. If the Sheunk IS38+ were 75% efficient compared to an IHI IS38 at 72% efficient, the difference in the compressor outlet temperature (around 300 degF) would be 20 degrees Fahrenheit. After the IC got through with cooling, the difference would be 1 degF.
Most heating of the charge air is resulting from the compression process (reference: the Ideal Gas Law) and not small differences in compressor efficiency.