
Background:
A while ago the stock Mk7 GTI exhaust was flow tested and since that time the part occupied floor space in my garage waiting for an opportune time to install it on the GTI and see what resulted.
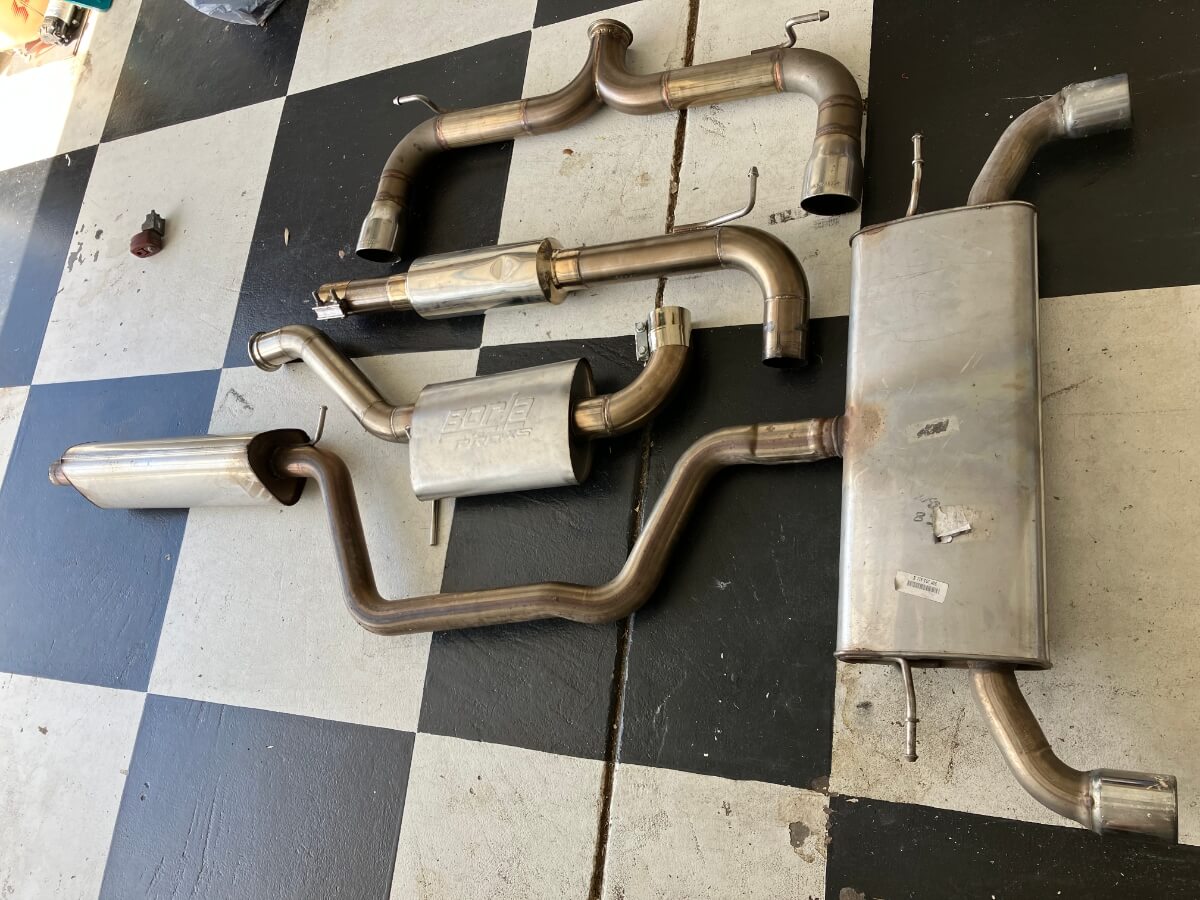
For establishing baseline performance data the Baun Performance mid-pipe and exhaust are installed on the GTI along with a Trackslag catted downpipe.
Details about the stock exhaust flow test are in this post.

Flow test results are shown below, indicating the aftermarket exhaust has the potential to correlate with increased performance from the engine.

Test Procedure:
For this test, two measures of performance will be key performance parameters, the rate at which boost pressure increases and the time it takes for the GTI to accelerate over a defined speed range. Both will be measured with the GTI operating in 3rd gear and at full throttle.
Other variables related to conditions affecting the engine and car will be recorded for analysis.
The GTI is operating with a Shuenk IS38+ turbocharger and a custom 93-octane tune from EQT. The operating range of interest begins at around 2,000 RPM and concludes at around 6,300 RPM. The vehicle starting speed for the timed interval is 47 mph and the ending speed is 84 mph.
Full throttle acceleration will be repeated several times using each configuration.
Test Results:
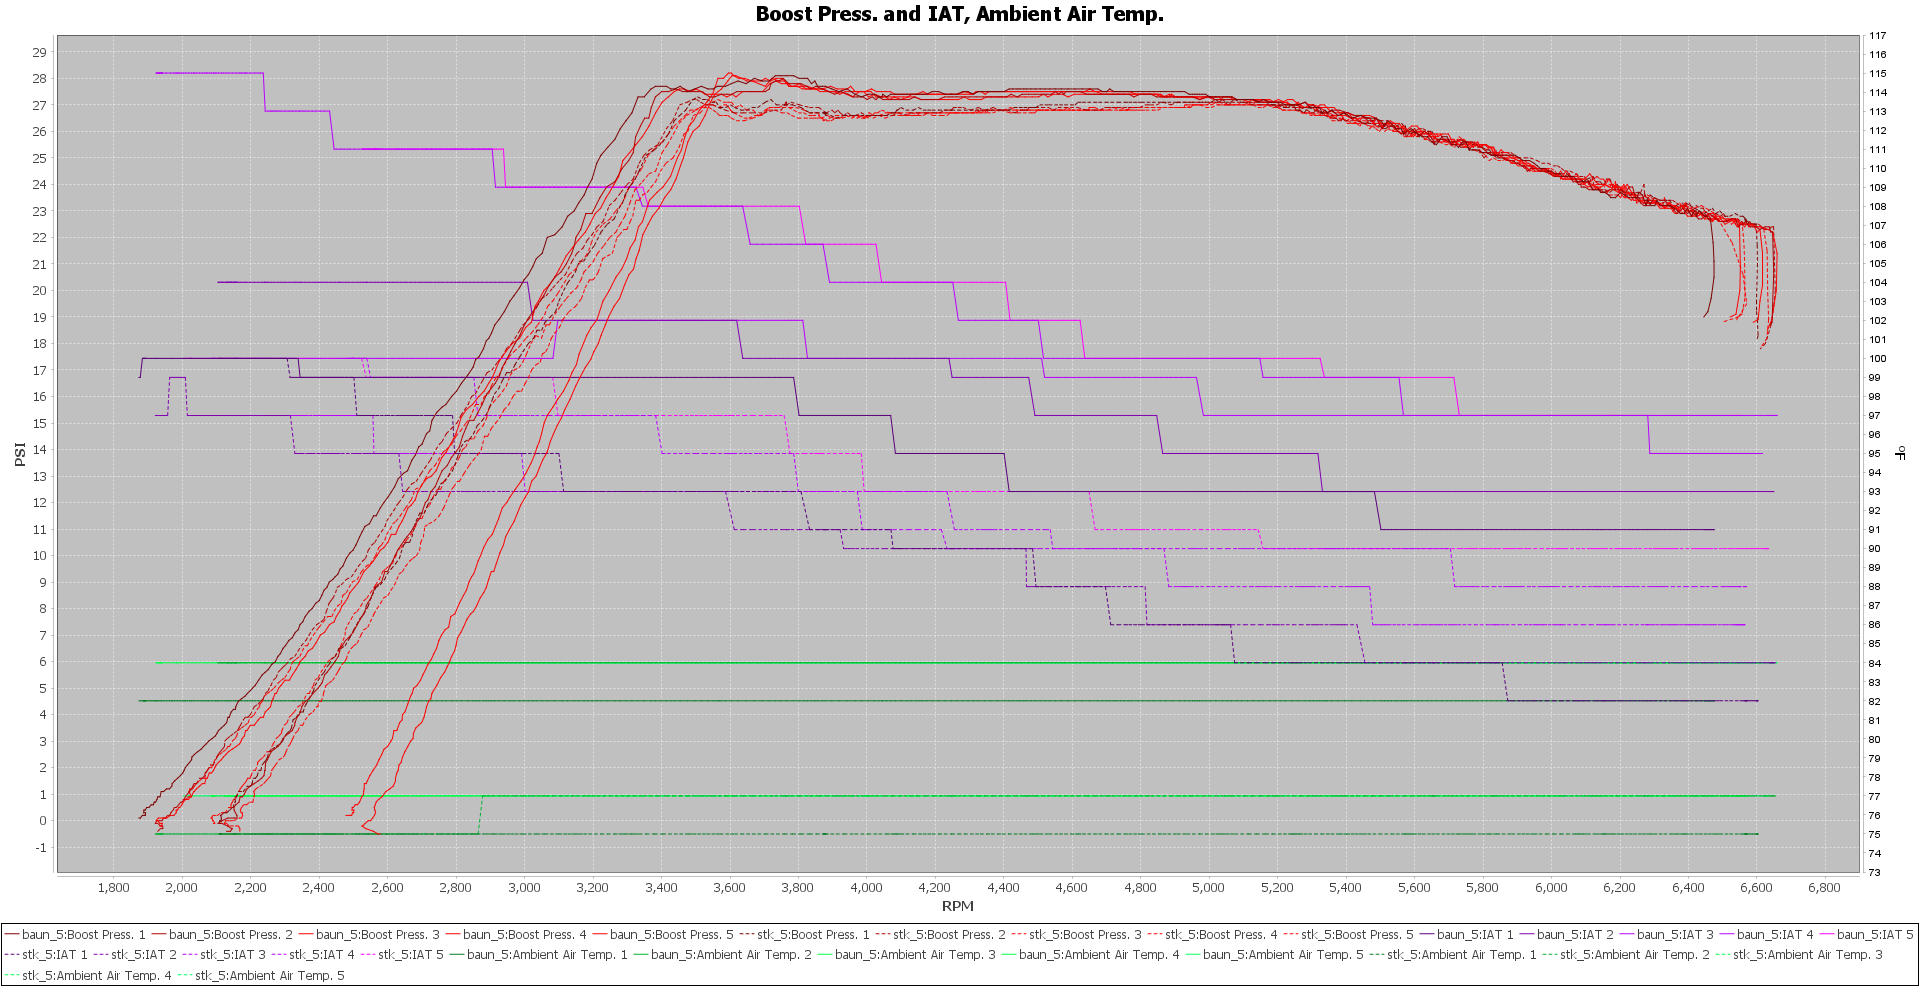
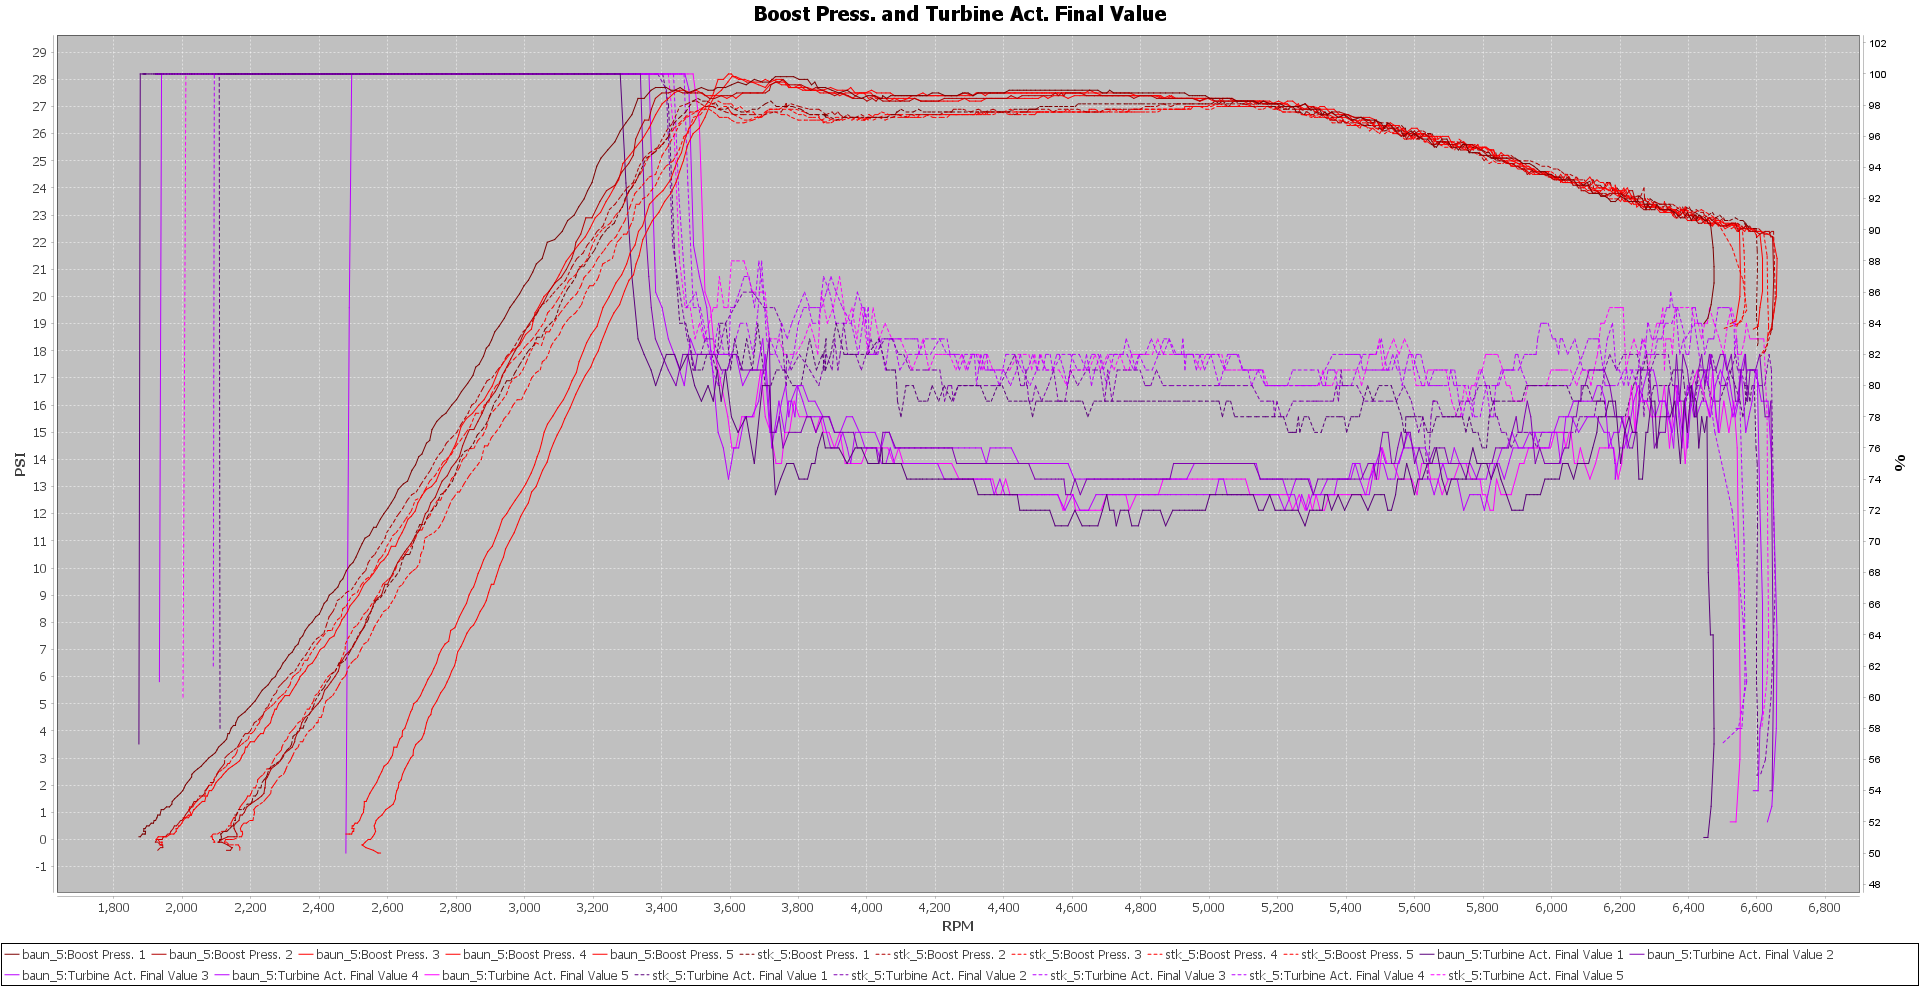
A comparison of the boost pressure curves is shown in the first chart.
While very similar, the data collected using the aftermarket exhaust shows boost pressure increasing slightly more after the initial rise and until approximately 5,000 RPM.
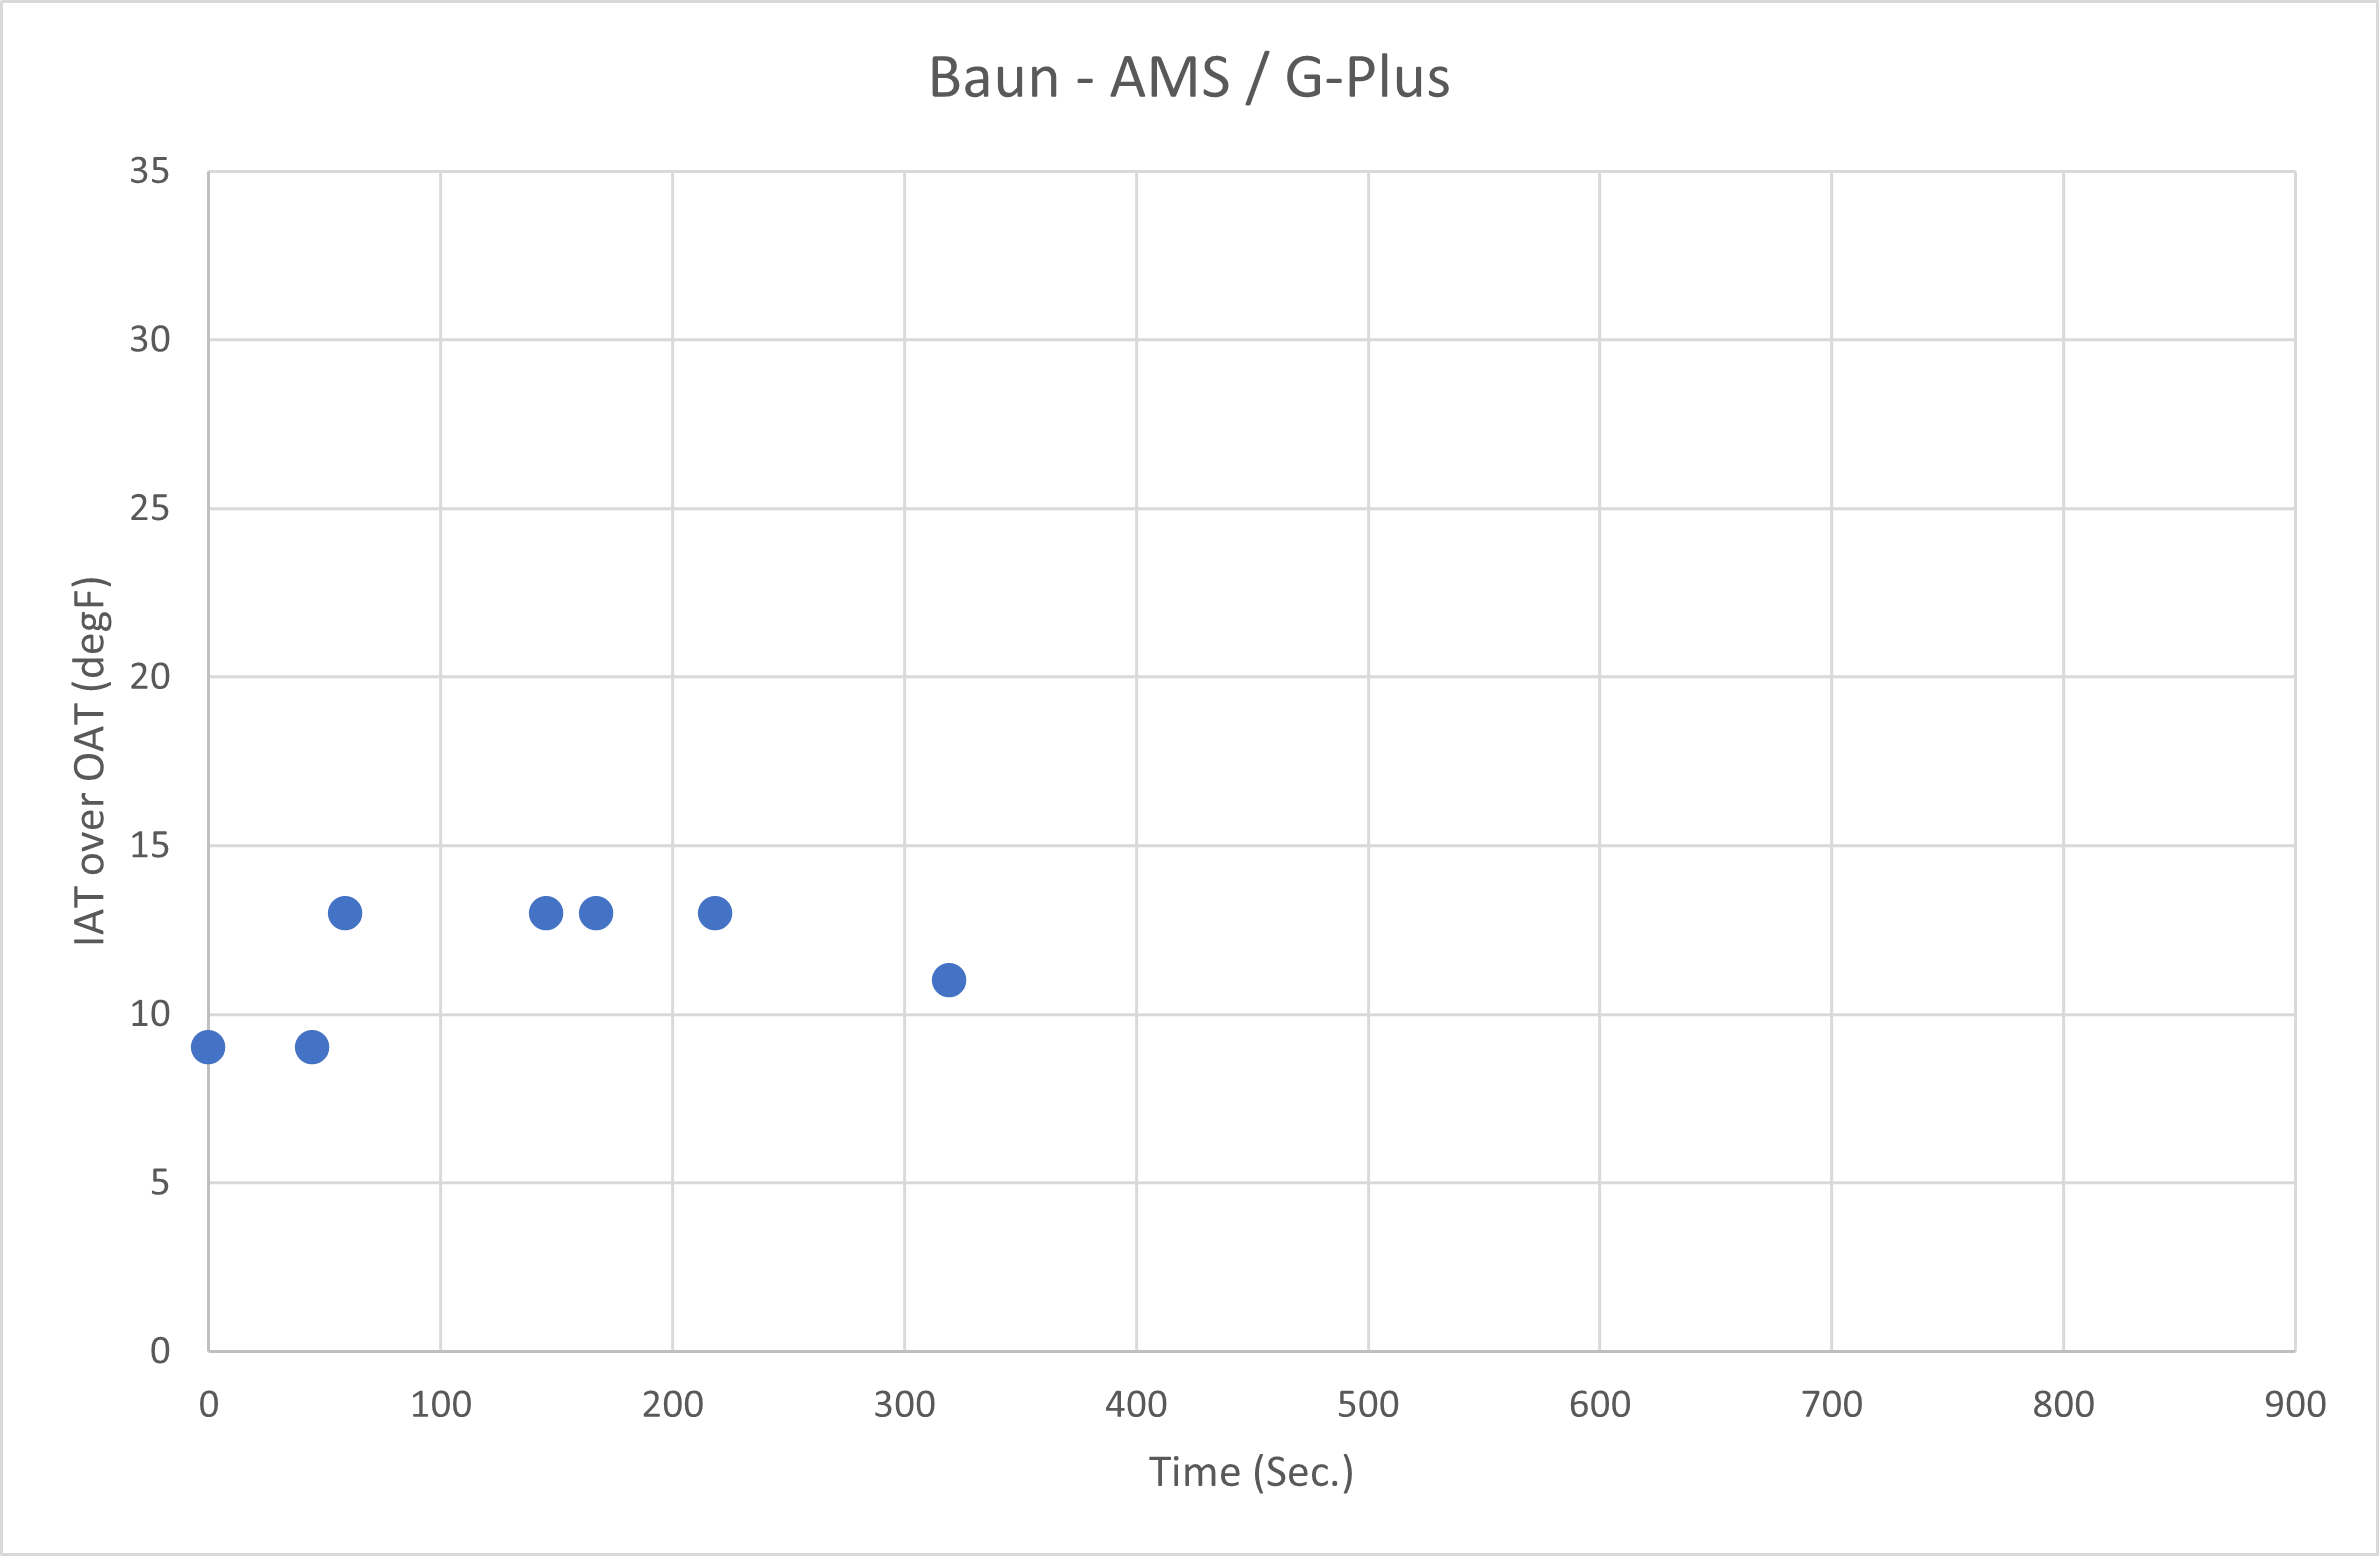
To check for consistency of the operating conditions the Intake Air Temperature (IAT) during each test session is compared using the two charts below.
The GTI pulls begin with a slightly lower IAT and end with a slightly higher IAT.
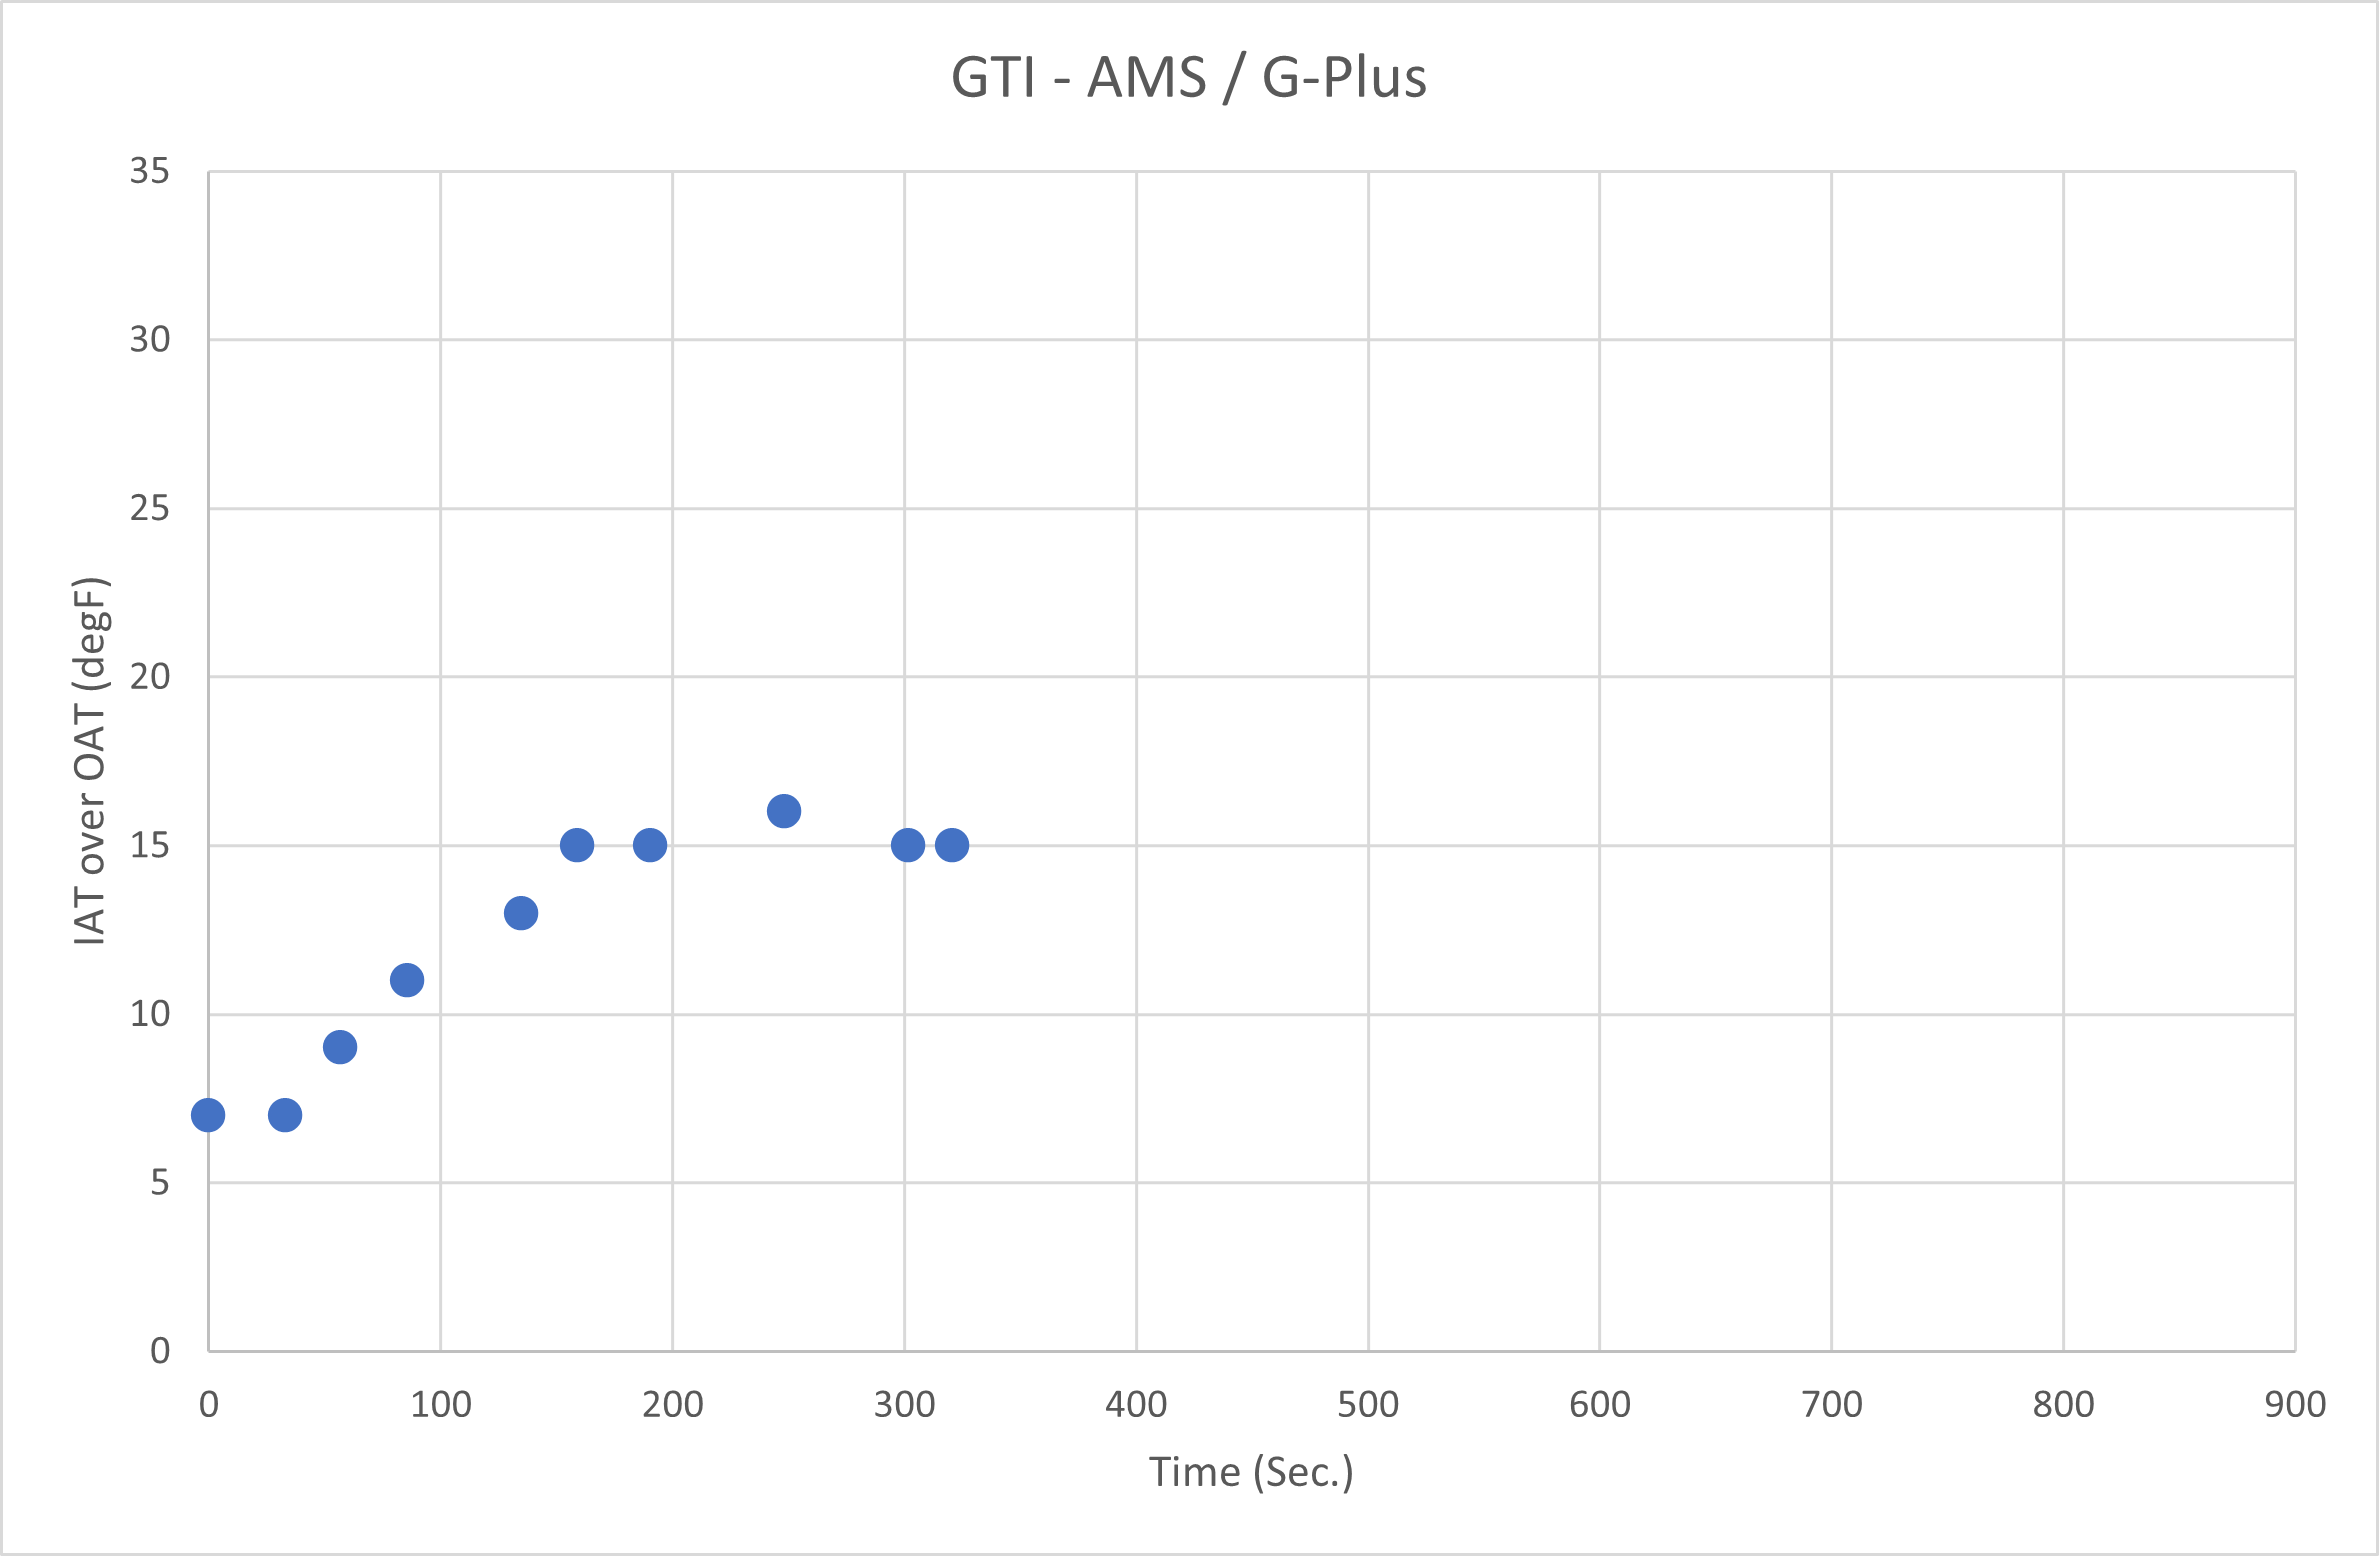
The IAT trend during the session with the aftermarket exhaust has less variation than during the stock exhaust session. Overall the difference in IAT as time passes is around 2-3 degrees Fahrenheit except for the final data points. These differences are discussed in the Confidence Check section.
A notable difference is seen in the turbocharger wastegate duty cycle, which is a rough indicator of the amount of exhaust gas being directed to the turbine to perform work compressing the intake air. If the turbine is operating more efficiently, less of a duty cycle will be required for a given amount of work output from the turbine.
The flow test of the stock and aftermarket exhausts showed that the aftermarket exhaust will create less exhaust gas backpressure, which the chart below also provides evidence of because the wastegate duty cycle with the aftermarket exhaust is less than with the stock exhaust.
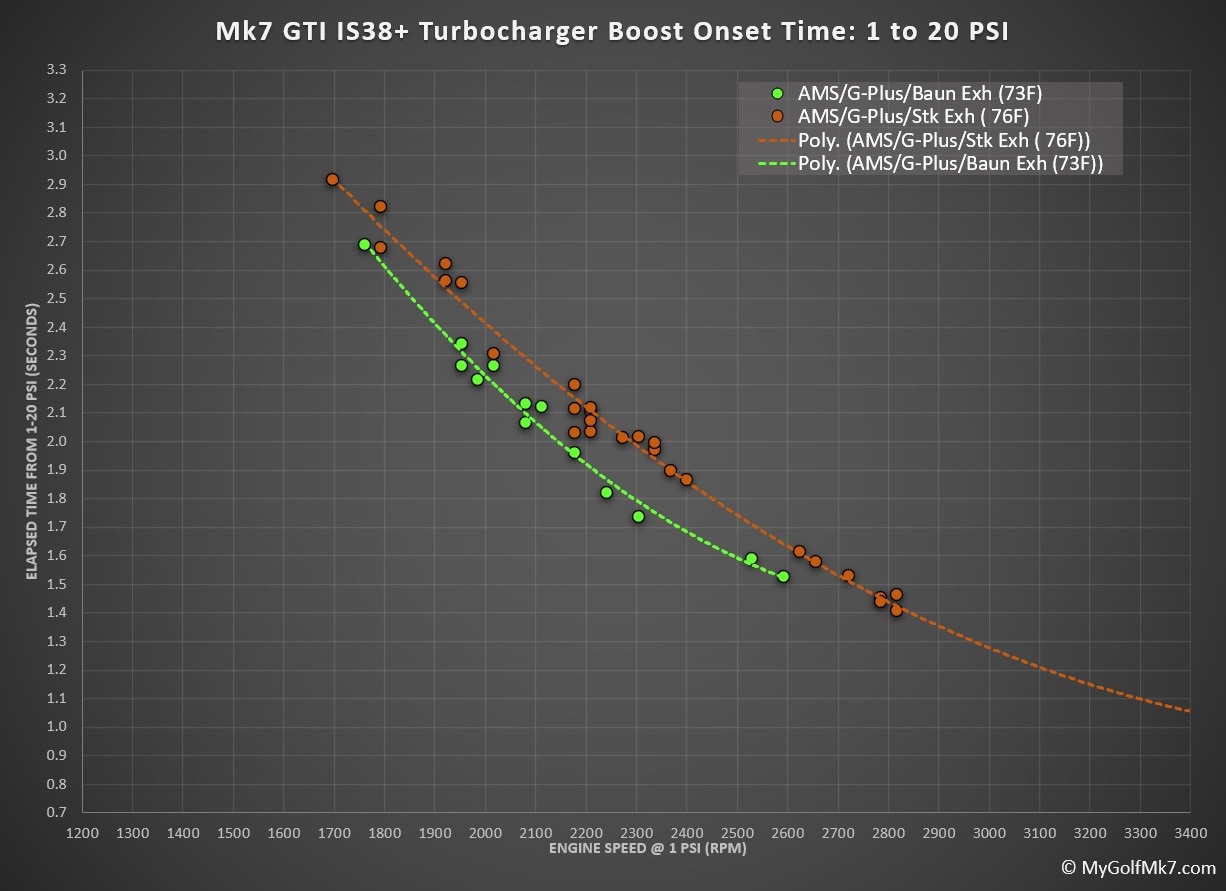
The next chart compares the time for the boost pressure to rise from 1 psi to 20 psi, a measure of the turbocharger responsiveness.
The aftermarket exhaust data shows a shorter time required for the boost pressure to increase to 20 psi.
The next chart is a comparison of the acceleration times for each configuration.

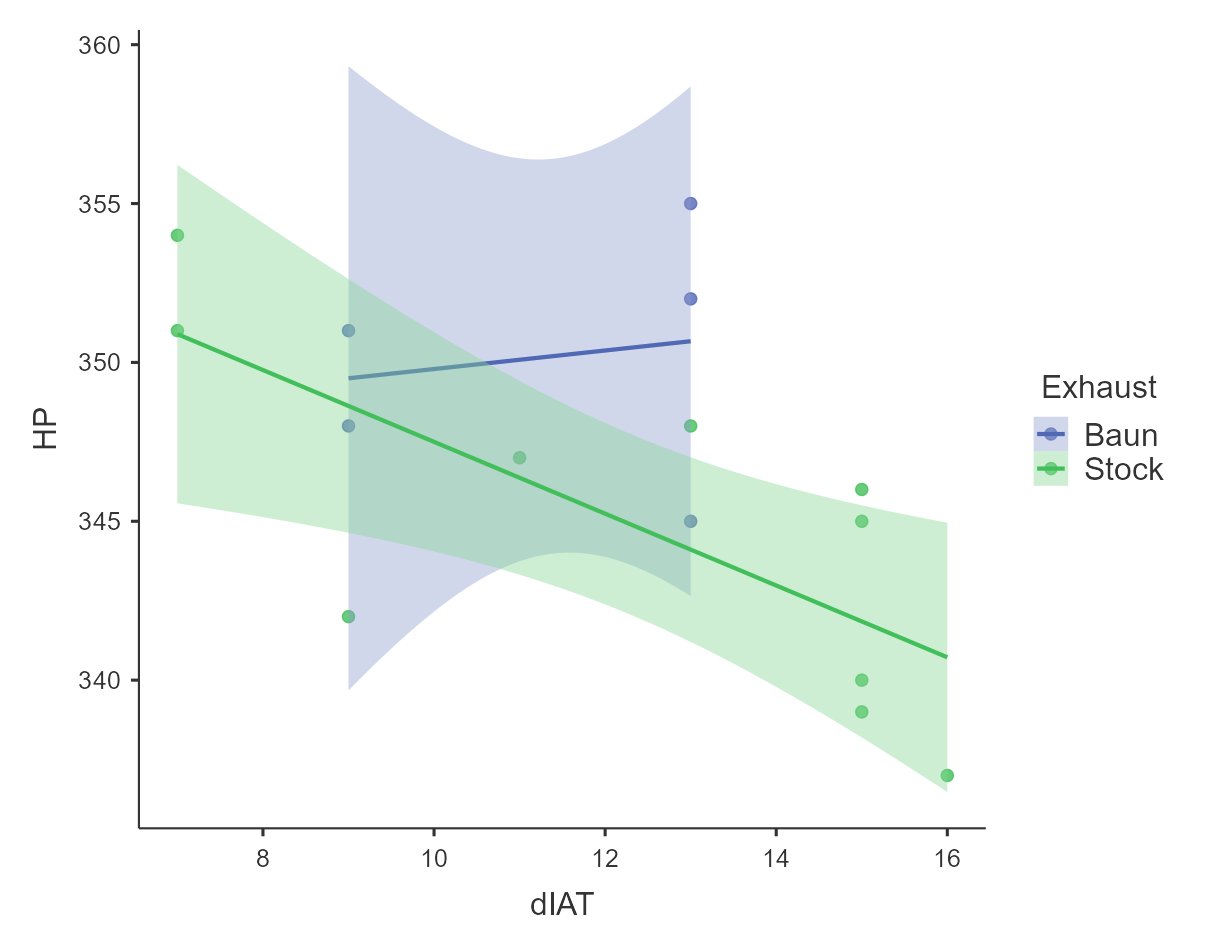
In the next chart, the vehicle speed versus time data is entered into the Virtual Dyno application to calculate the estimated peak wheel horsepower for each configuration.
Note: The relative ranking of the products will be the same between this HP chart and the time chart since the time values are used to calculate the power. This second format is being shown to put the differences into a measure (HP), that may be easier to relate to.

Confidence Check:
As mentioned towards the beginning of the test results section the IAT difference between the sessions grew slightly toward the later pulls.
Plotting the estimated HP versus time shows the stock exhaust pulls have a downward trend with subsequent pulls.
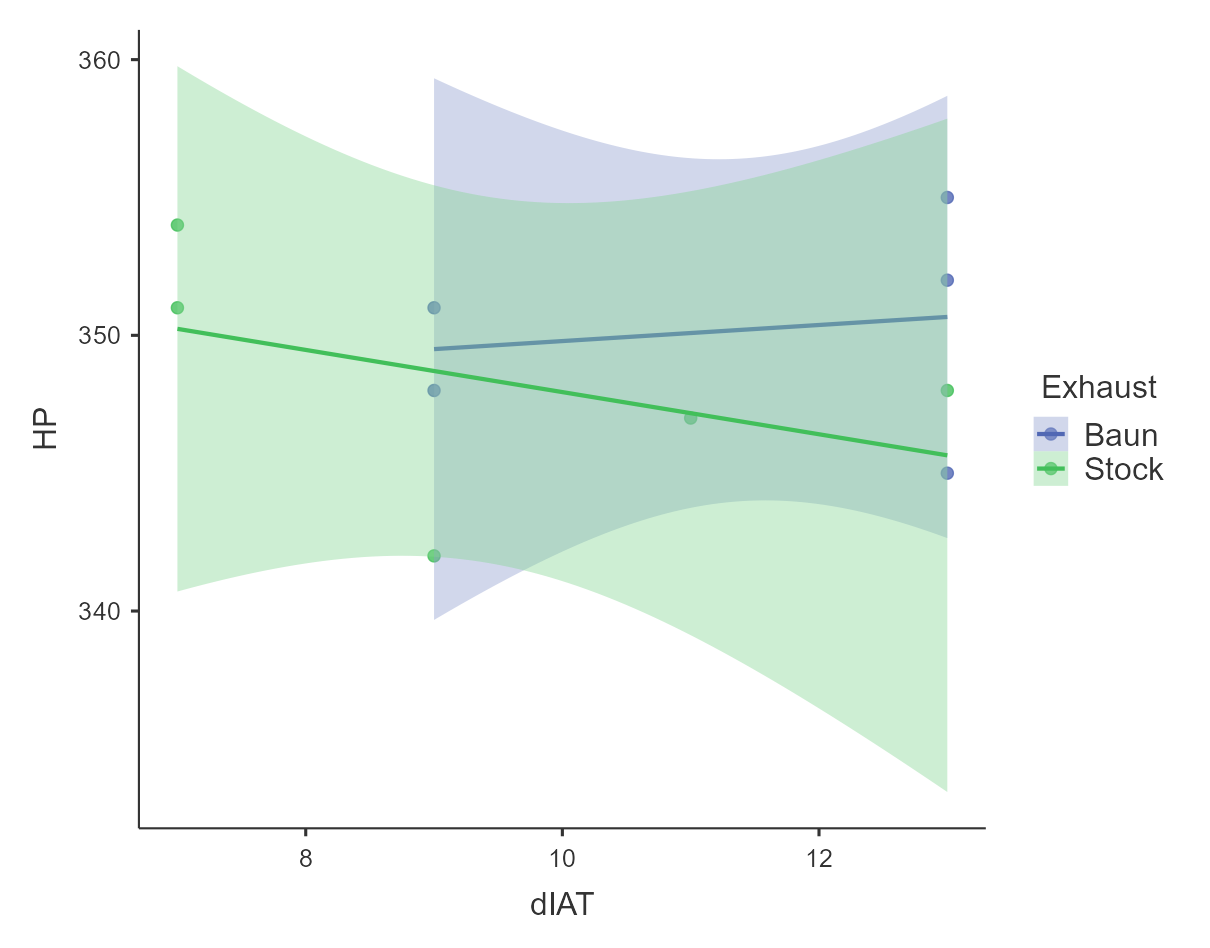
In order to try and eliminate some of the effects that were introduced during the later pulls the data sets were reduced.
Two pulls were dropped from the aftermarket exhaust data, leaving five (5) data points, shown above.
After limiting the stock exhaust pulls to the first five (5) data points the trend lines for the estimated wheel horsepower are more consistent between sessions.
Although dropping data points is undesirable for reducing uncertainty with the results, I believe it is unlikely the stock exhaust is having a growing negative effect on the power output. It is likely that another factor is affecting the vehicle’s performance as the session time grows longer with additional pulls.
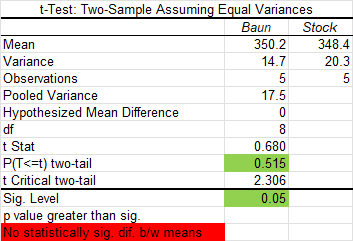
Focusing on the first five pulls made with each configuration, a t-Test is performed on the hypothesis that the mean acceleration times are not different between the tested configurations.

The sample means do not show a statistically significant difference, at a 5% significance level.
Next, the estimated mean peak horsepower is compared.
Unsurprisingly, again the sample values do not have a difference that is statistically significant.
Next, an assessment is made to estimate the number of samples that would have been needed to confidently detect a difference in vehicle performance of a magnitude as was measured, aka the effect size.
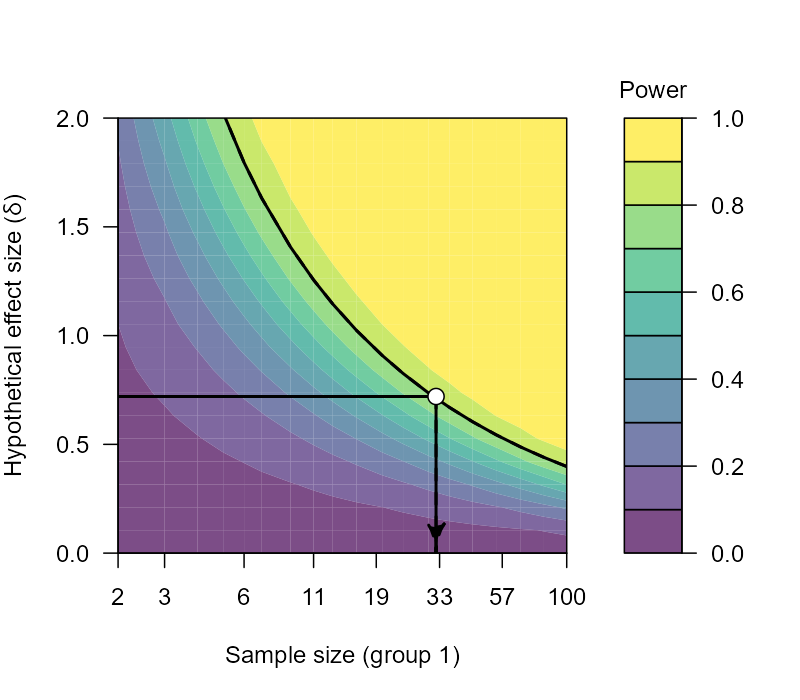
32 pulls with each setup.
Based on the number of samples used in this comparison, 5 for each setup, how much of a difference would there need to be for a reasonable chance of detecting the difference? Approximately 10 whp.

Note: This comparison is a good example of the difficulties involved with using the vehicle to collect data on the street, frequently described as “real-world” data. This method usually introduces nuisance variables that add noise to the response variable value and should be controlled. This test illustrated what happens when they are not controlled, by the decreasing WHP figures. In this example, to have decent “real-world” data to draw a conclusion from, it would have taken 64 pulls.
Conclusions:
The stock GTI exhaust was swapped out with an aftermarket exhaust and measures made with each exhaust were compared.
Boost onset time decreased slightly with the aftermarket exhaust and acceleration time decreased slightly with the aftermarket exhaust, although not by a large enough amount to have statistical significance.
It is likely that the acceleration time, or power output, may have been higher if the engine software had been revised as indicated by the lower wastegate duty cycle measured with the aftermarket exhaust. The cost to have the software revised was not justified to determine if this theory is true or not.
At the power level that this IS38-equipped GTI operates, without revising the engine software, the vehicle performance differences between using the stock exhaust and aftermarket exhaust are minor.