
Table of Contents
Background:
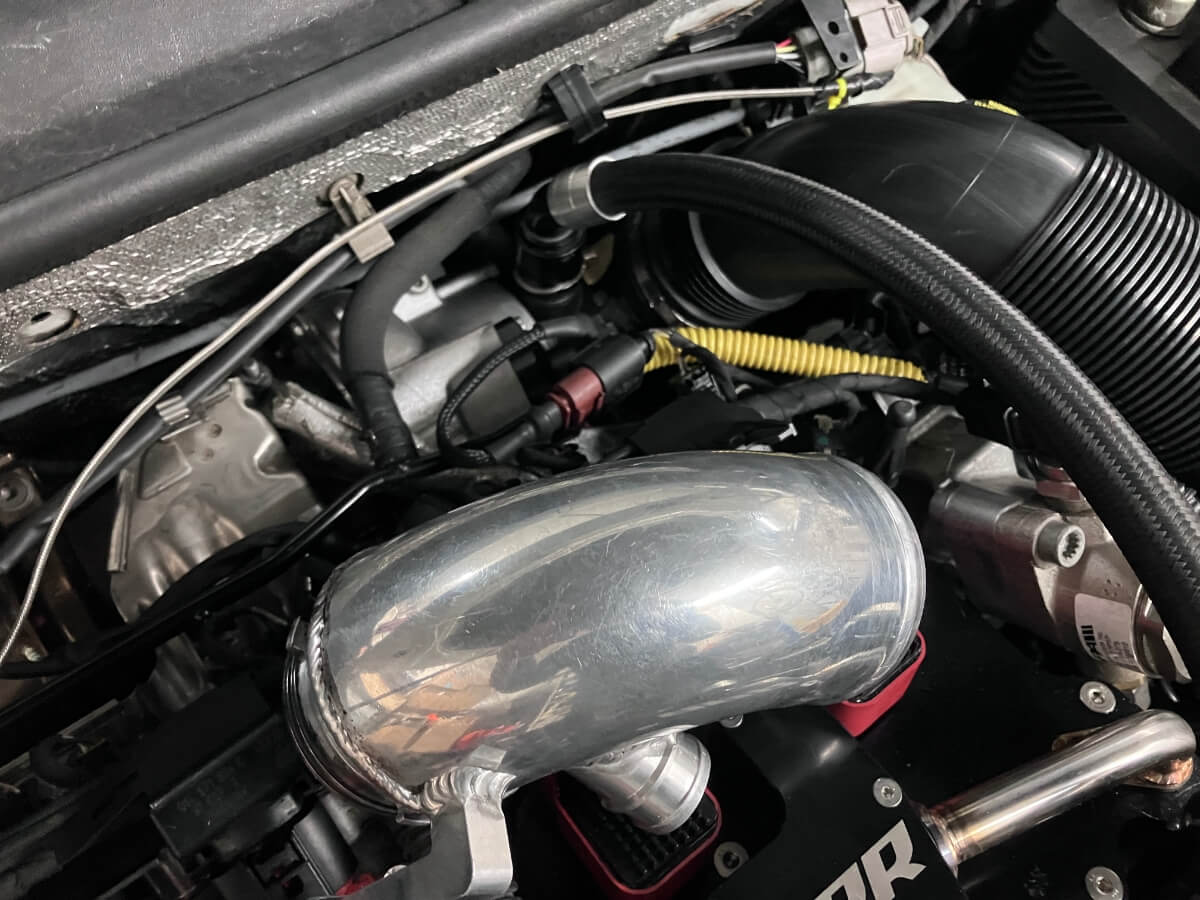
After a recent flow test of the stock turbo inlet elbow checking for the amount of vacuum produced at the PCV port, the stock TIP was sitting on the shelf and caught my attention after I’d made some pulls with a Eurodyne IS20 Stage 2 tune.
At the time that the logs were recorded with the Eurodyne tune I had an aftermarket turbo inlet elbow installed on my GTI. This seemed like a good opportunity to swap elbows and see what the result would be.
Test Procedure:
To determine what, if any, effect the change of inlet elbows causes I compared data logged during full throttle third gear pulls.
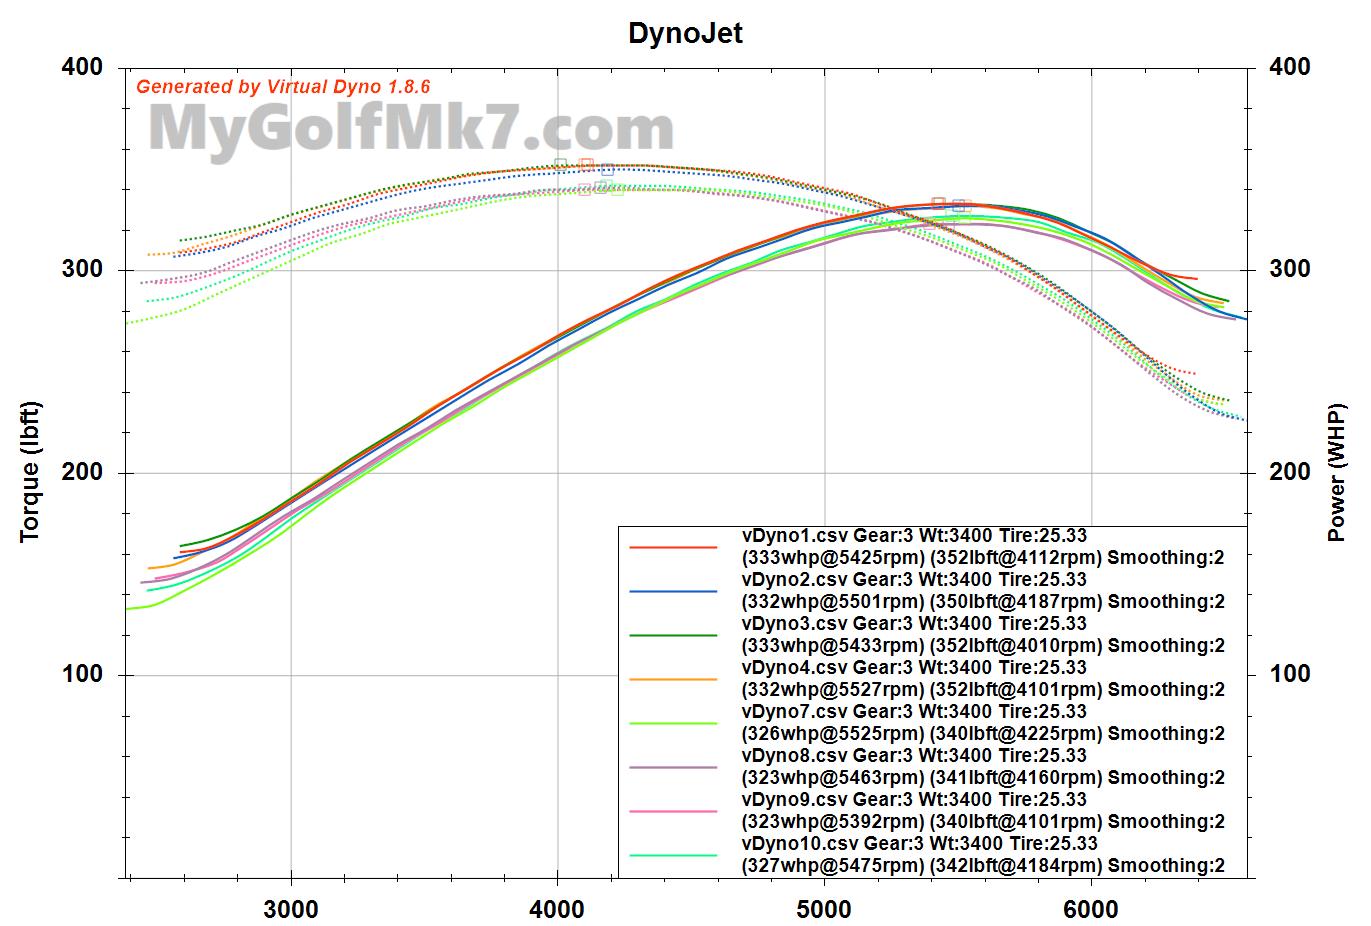
A Dragy data logger was used to record the acceleration times from 47 to 84 mph and an OBD data logger was used to record engine variables along with instantaneous vehicle speeds. The vehicle speeds would be processed with the Virtual Dyno application to calculate the maximum wheel horsepower developed during the pulls.

Test Results:
A total of ten (10) valid runs were recorded with each configuration.
Acceleration times:
Comparing the acceleration times with a boxplot shows that there is a good amount of overlap in the sample data.
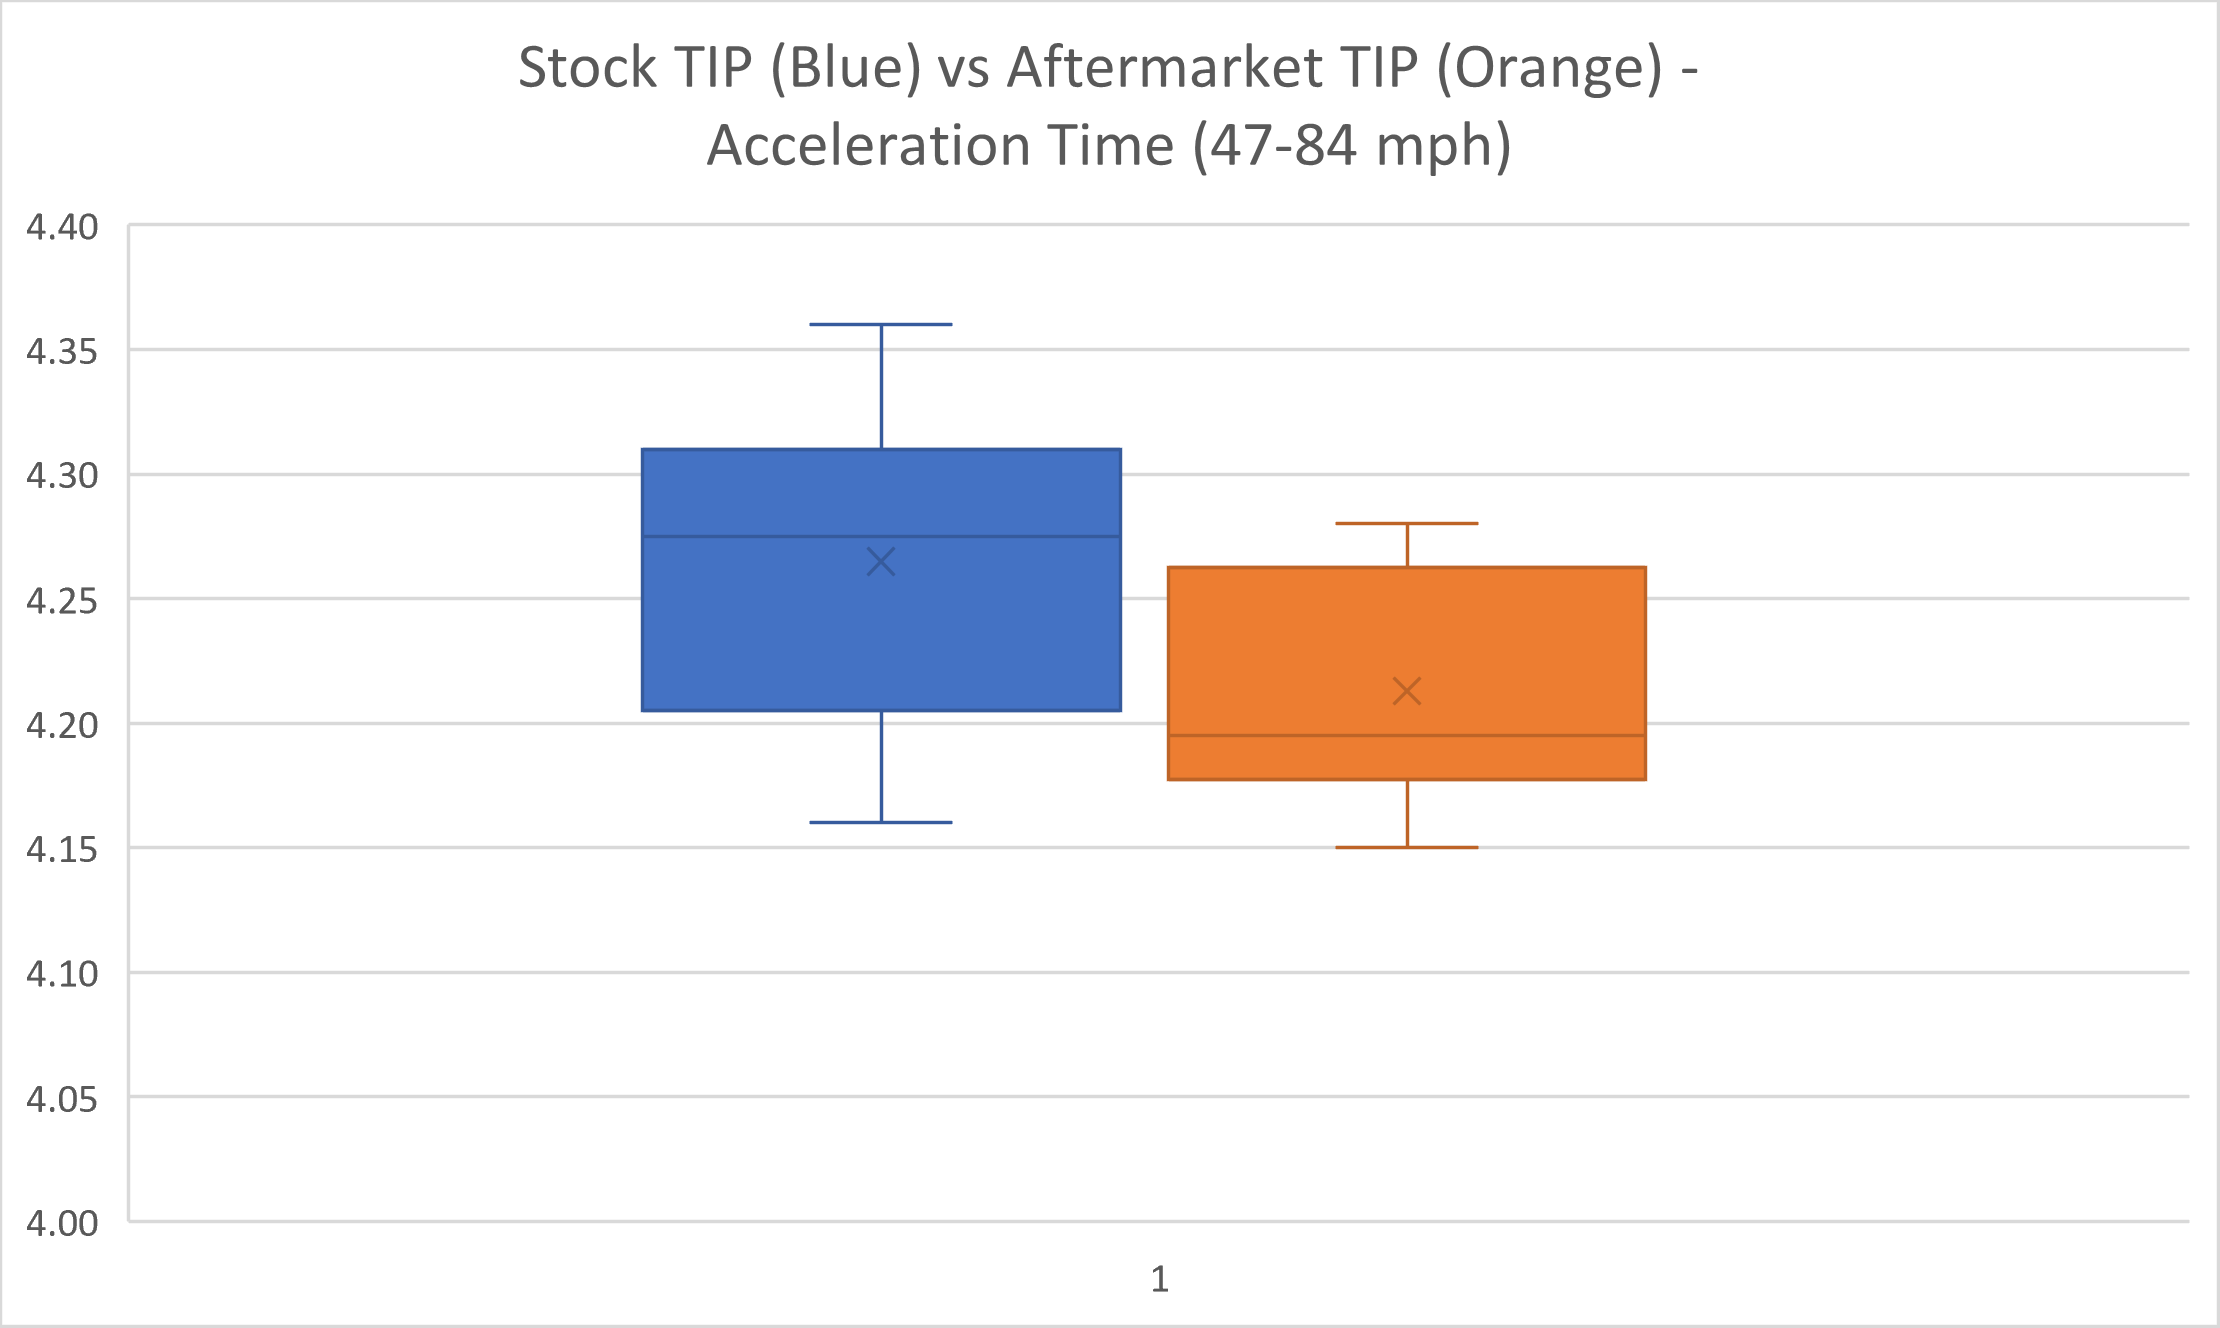
A t_Test is used to gauge if there is a significant difference between the means of the samples.

With a significance level of 0.05 the results do not support rejecting the hypothesis that the means are the same.
This result points to there being no statistically significant difference in the mean acceleration times.
The next question was whether enough samples were recorded to have confidence in this conclusion.
Because there is little difference between the means the effect size this comparison is looking for is small. A power analysis is a tool for determining if the number of samples is sufficient for this comparison.

With a statistical power of 80% (the likelihood that the test will detect the effect), a total of 21 samples from each inlet elbow are needed.
Since only 10 samples were recorded for each configuration this comparison is inconclusive.
Peak WHP Calculations:
The next value for review is the Peak Wheel Horsepower.
Note that Peak WHP is a value representing a momentary outcome, whereas the Dragy time is a measure that covers several seconds. While the two measures have some commonality, they are different measures and therefore can have different outcomes.
The peak wheel horsepower values for each setup are shown in the boxplot chart. In this case, there is more difference in the results which is reflected by the smaller area of overlap of the interquartile range (colored boxes) .
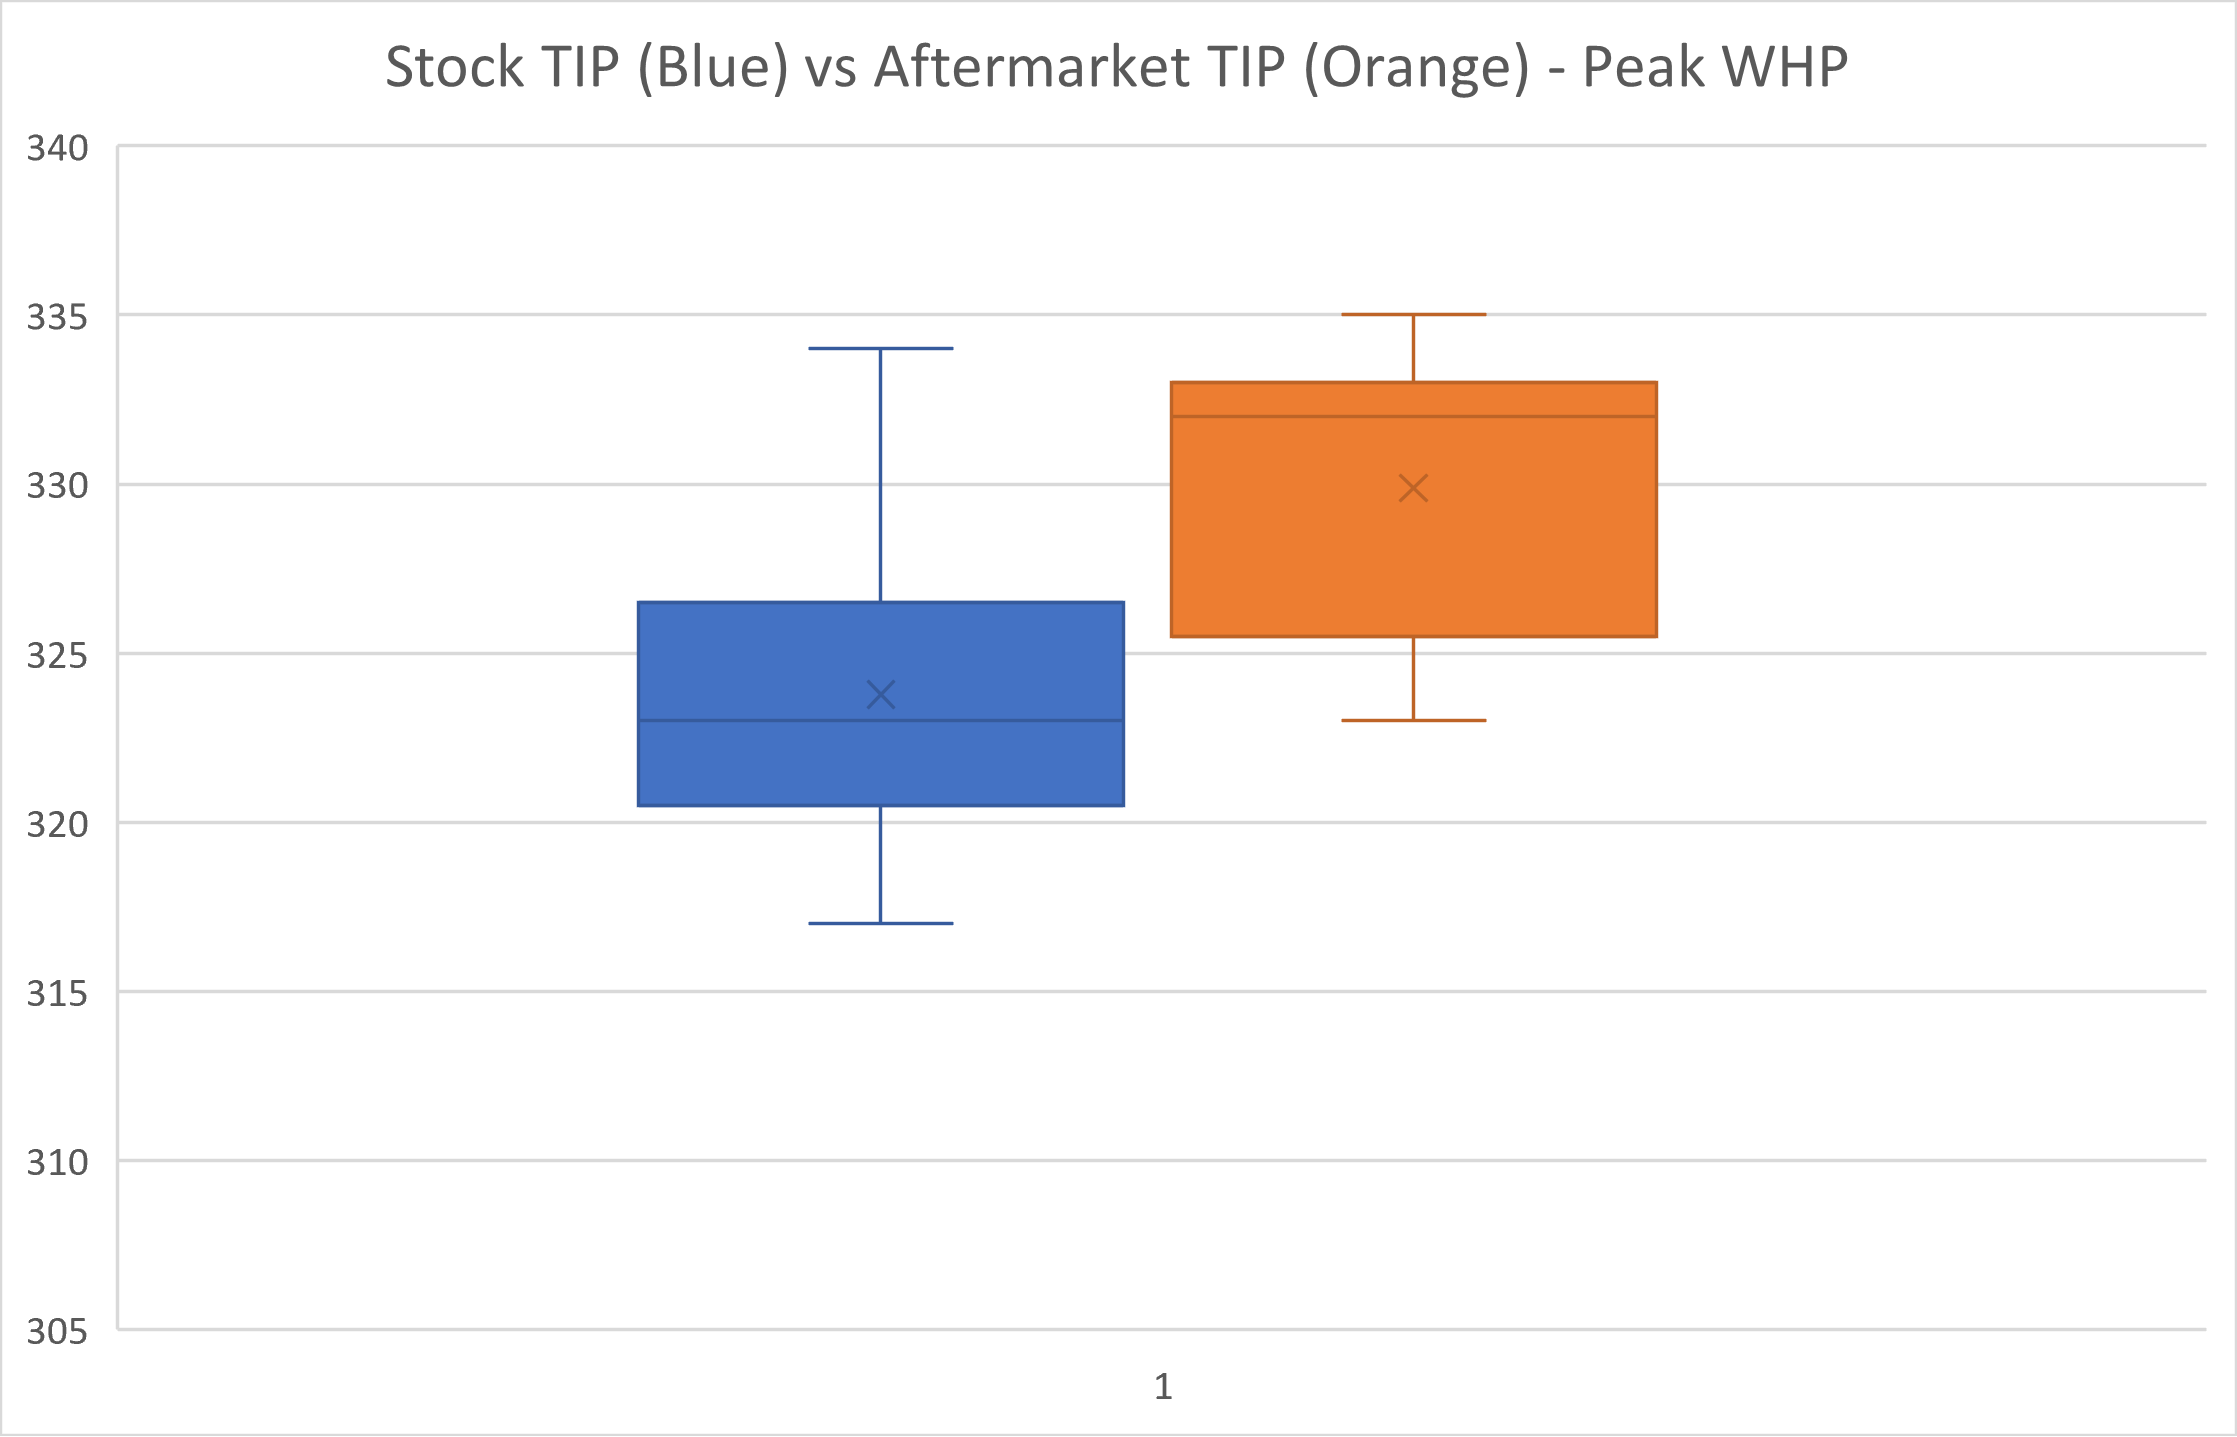
Once more the t-Test is used to gauge if there is a significant difference between the mean peak WHP values.
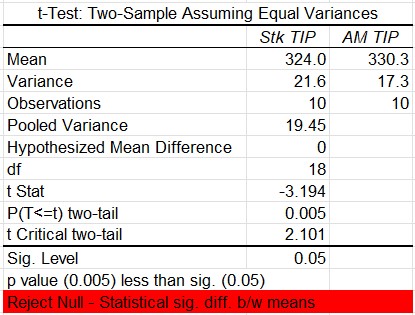
In this case, the hypothesis that the means are the same is rejected, the difference between the mean values is likely to be something other than zero.
The power analysis is repeated with the WHP data.

The difference between the peak WHP mean values is approximately 6 whp, and to detect this amount of difference only nine (9) samples are required, and ten (10) samples with each inlet elbow were recorded.
WGDC comparison:
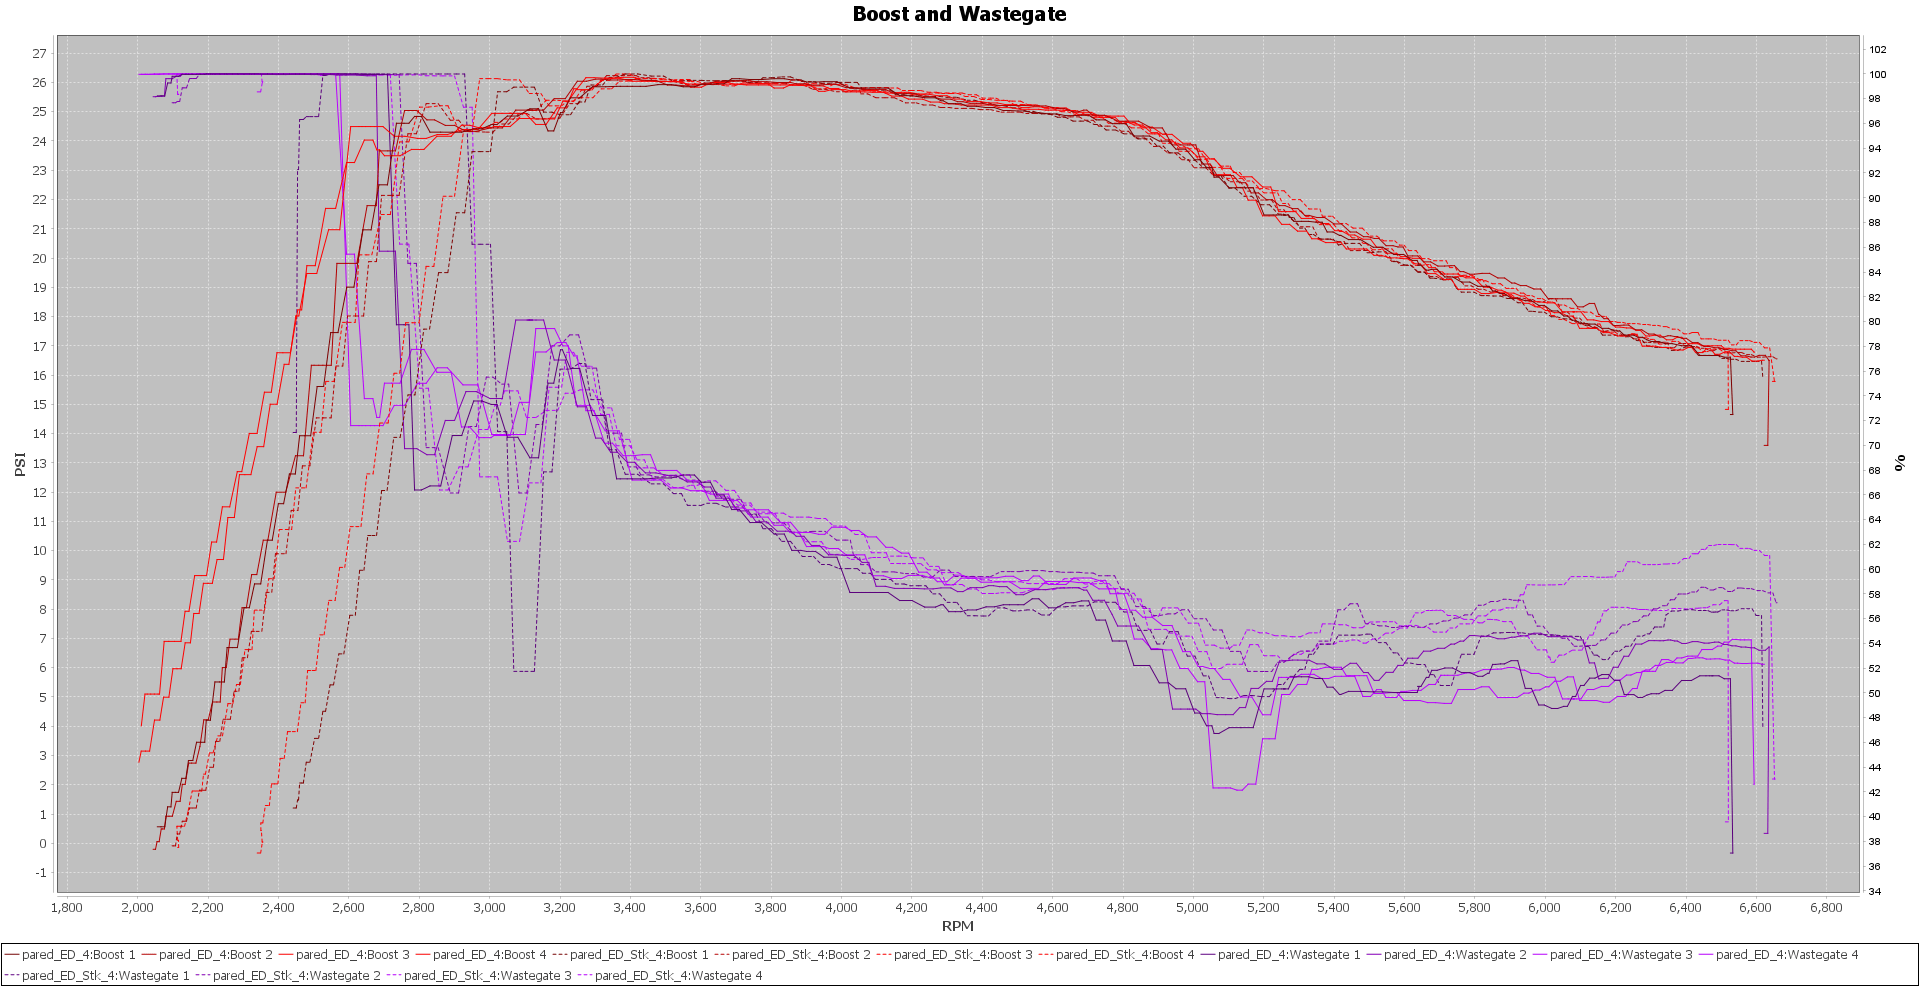
Last, a comparison of the turbocharger wastegate duty cycle with each inlet elbow installed is made.
First, a subset of individual samples is compared. Dashed lines are the stock elbow and solid lines are the aftermarket elbow.
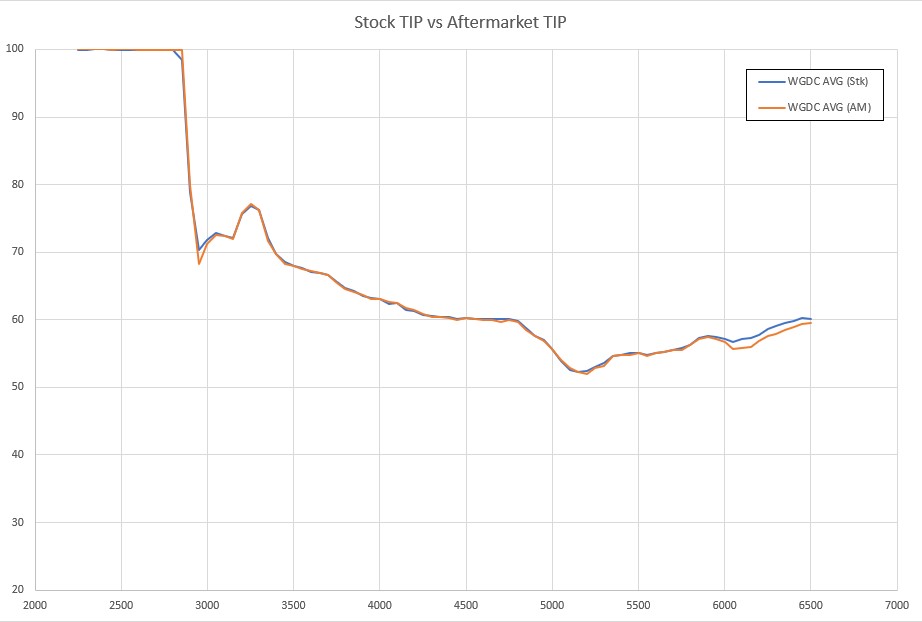
Looking at the average over the ten (10) pulls the difference can be seen to be small.
Conclusions:
An aftermarket turbo inlet elbow (TIP) and the stock GTI TIP were installed on a Mk7 GTI equipped with an IS20 turbocharger and Stage 2 aftermarket ECU software.
Acceleration and wheel horsepower data recorded during full-throttle third-gear acceleration are compared.
No significant difference was found in acceleration times, but this result is inconclusive due to insufficient samples for the effect size being compared.
The peak wheel horsepower average is greater with the aftermarket TIP by 6 WHP and this result is statistically significant at an 80% statistical power.
What I would expect. Nice work/testing.