
Background:
The ECS Tuning FMIC (Front Mount Intercooler) is the first FMIC to be installed as part of a focused FMIC comparison test. The purpose of the testing is to collect data to compare with other FMIC options, and also the stock GTI IC.

Test Procedure:
The details of the FMIC test are contained on the test comparison page.
Test Results:
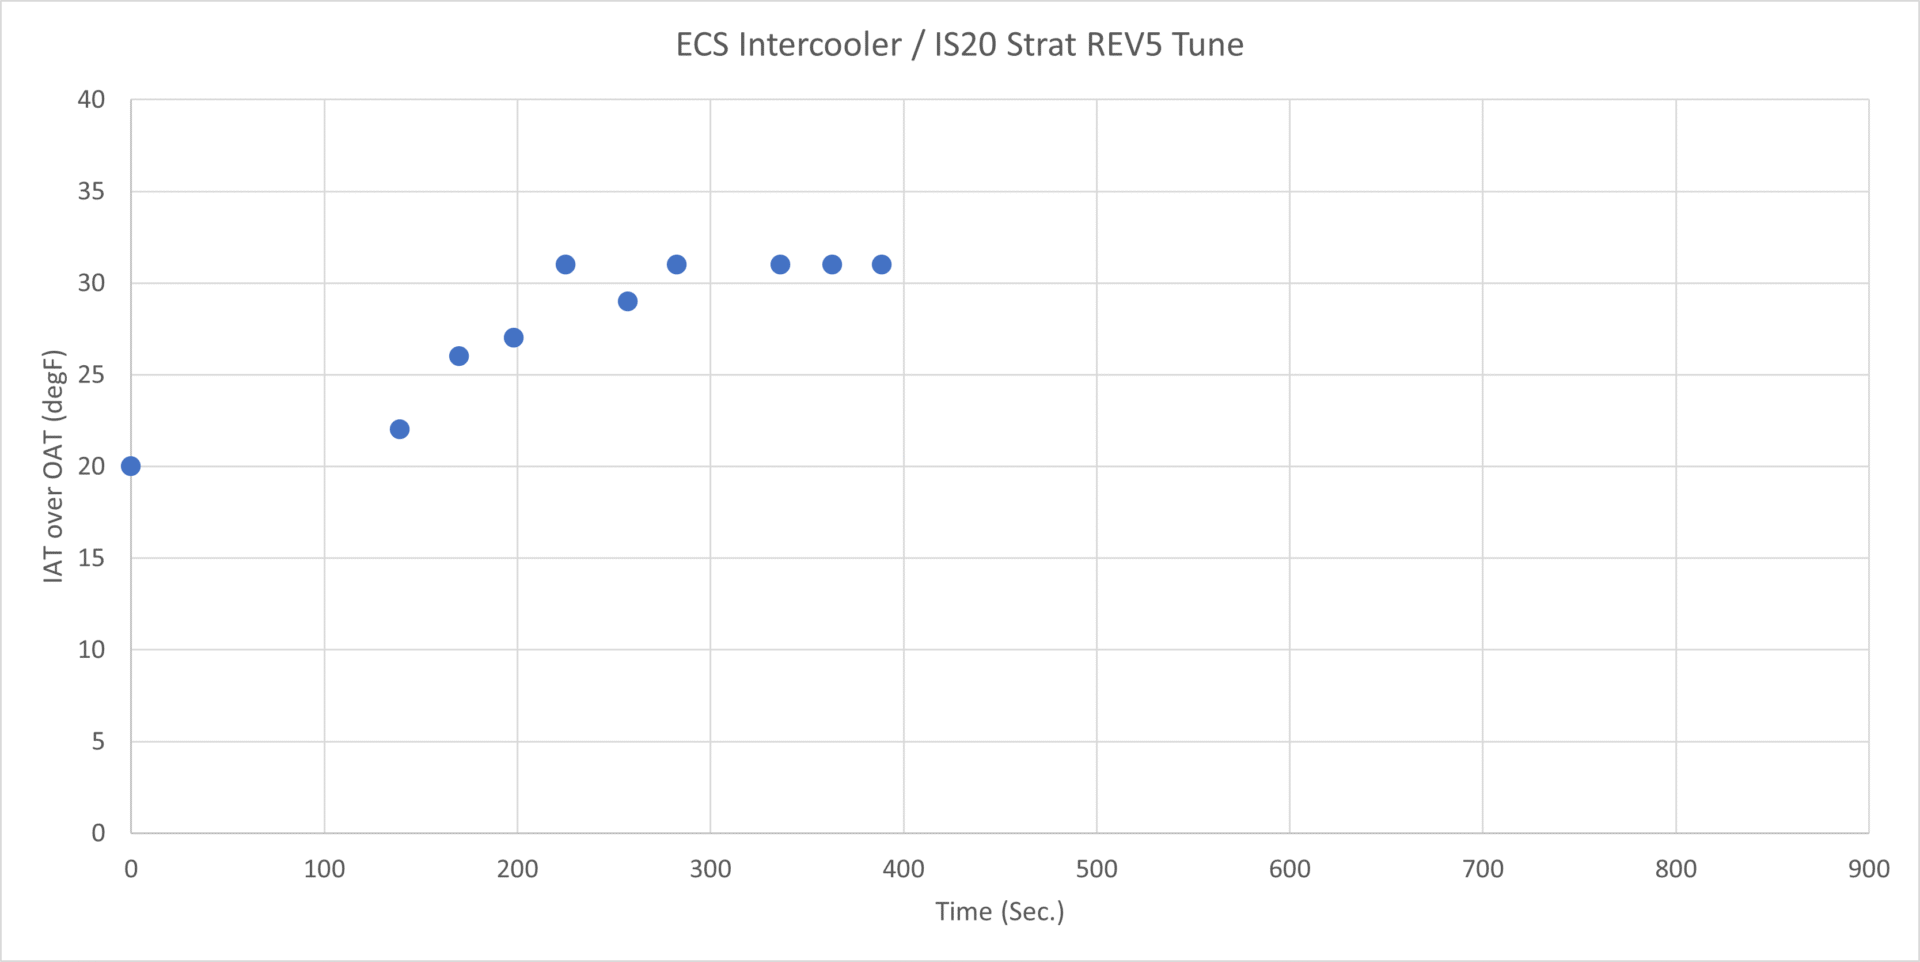
The first chart shows the trend of the delta IAT over the series of pulls.
Delta IAT is the difference between the Intake Air Temperature (IAT) and the Ambient/Outside Air Temperature (OAT) at an engine speed of 6,000 RPM while operating at full boost.
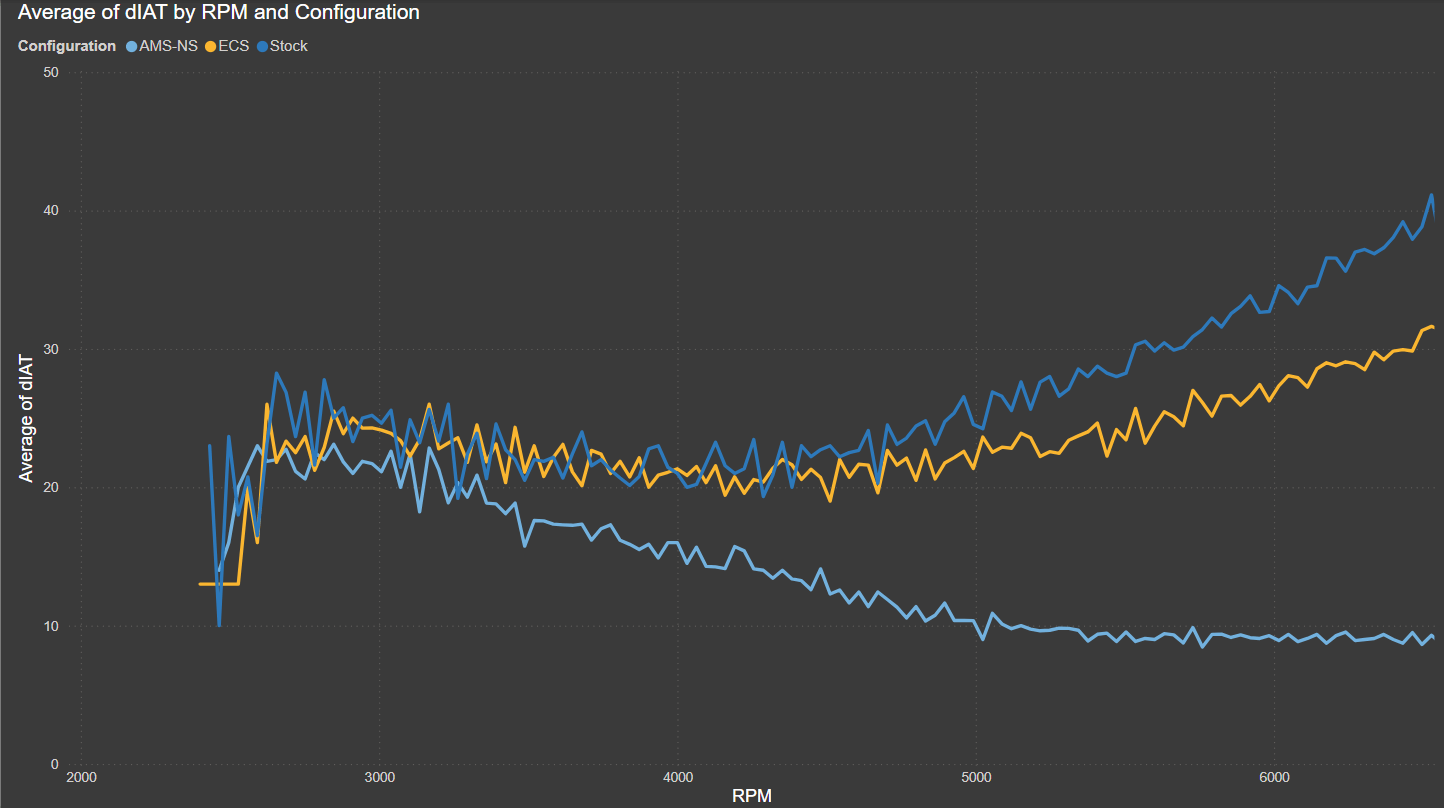
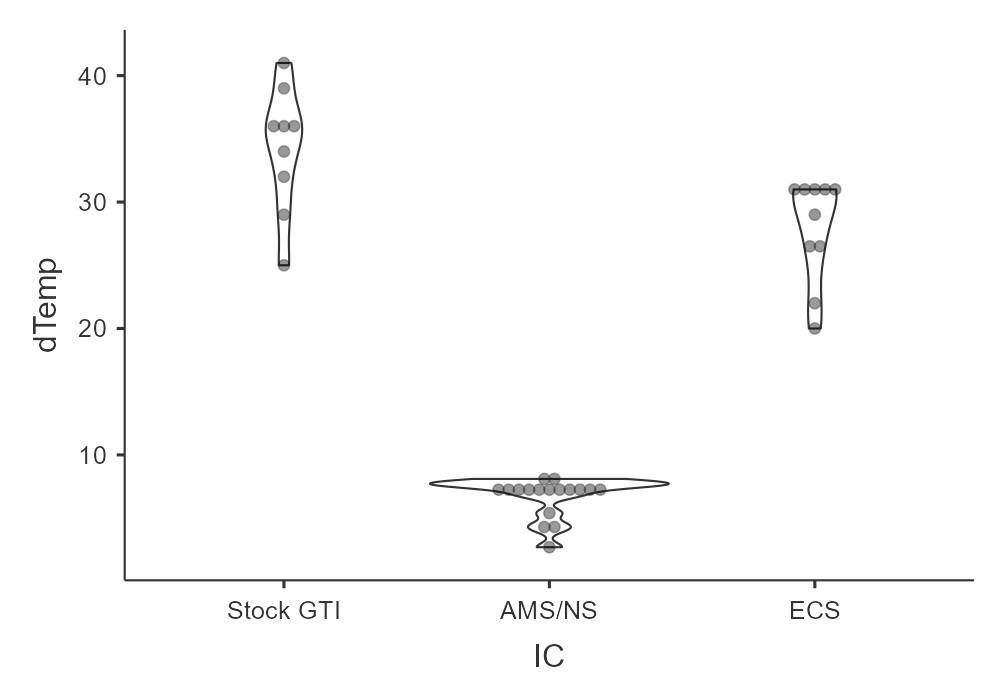
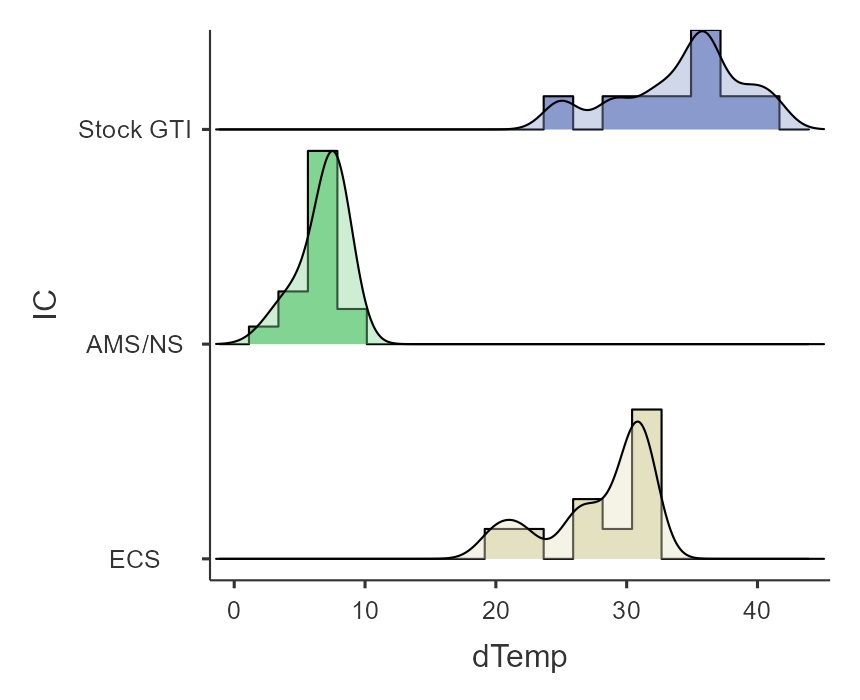
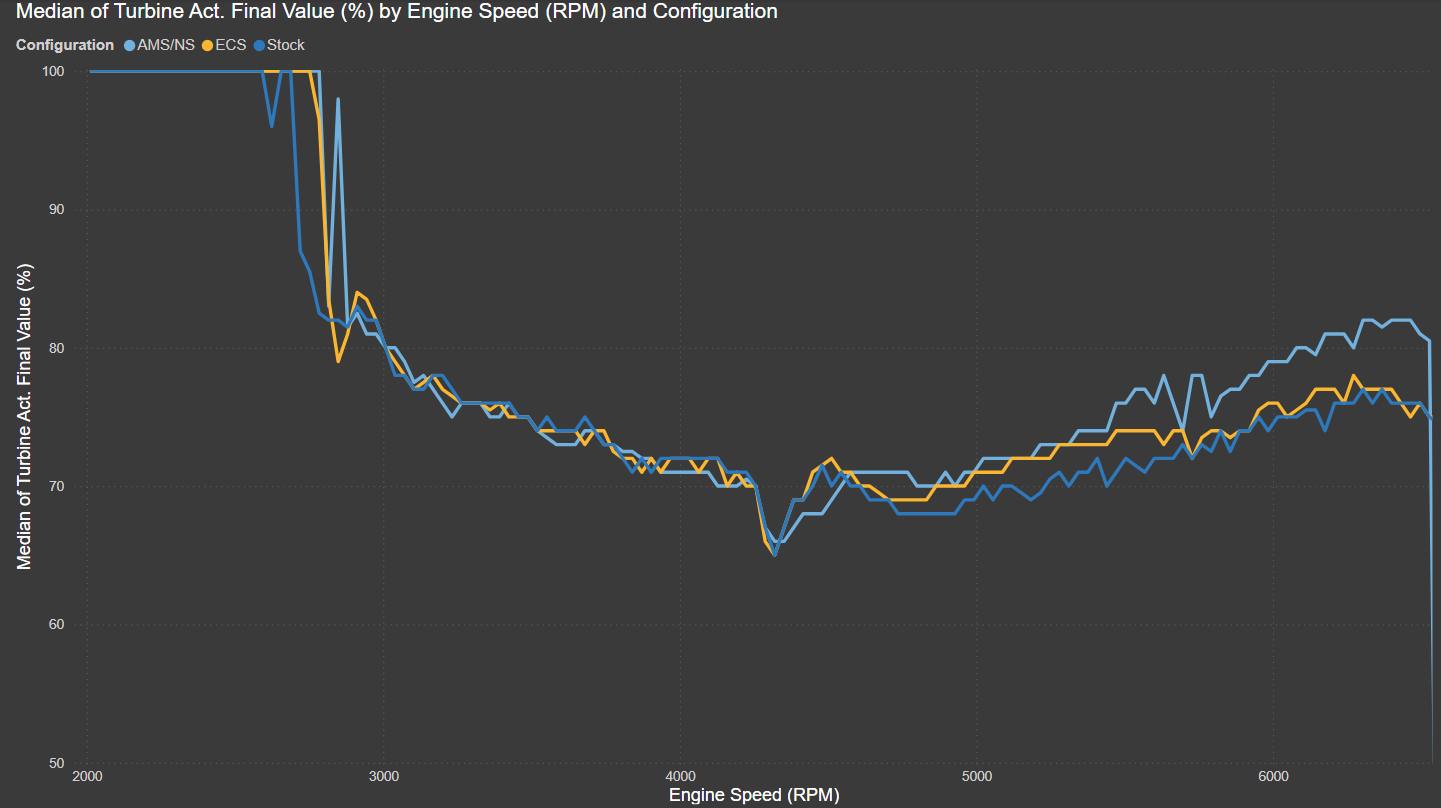
The ECS Tuning FMIC will be compared with the stock GTI IC and AMS/Neuspeed Bicooler in the following charts.
This chart shows the average of the delta IAT throughout the series of pulls.
This chart shows individual data points making up the delta IAT at 6k RPM for all of the intercoolers.
This chart shows the delta IAT at 6k RPM in a histogram format.
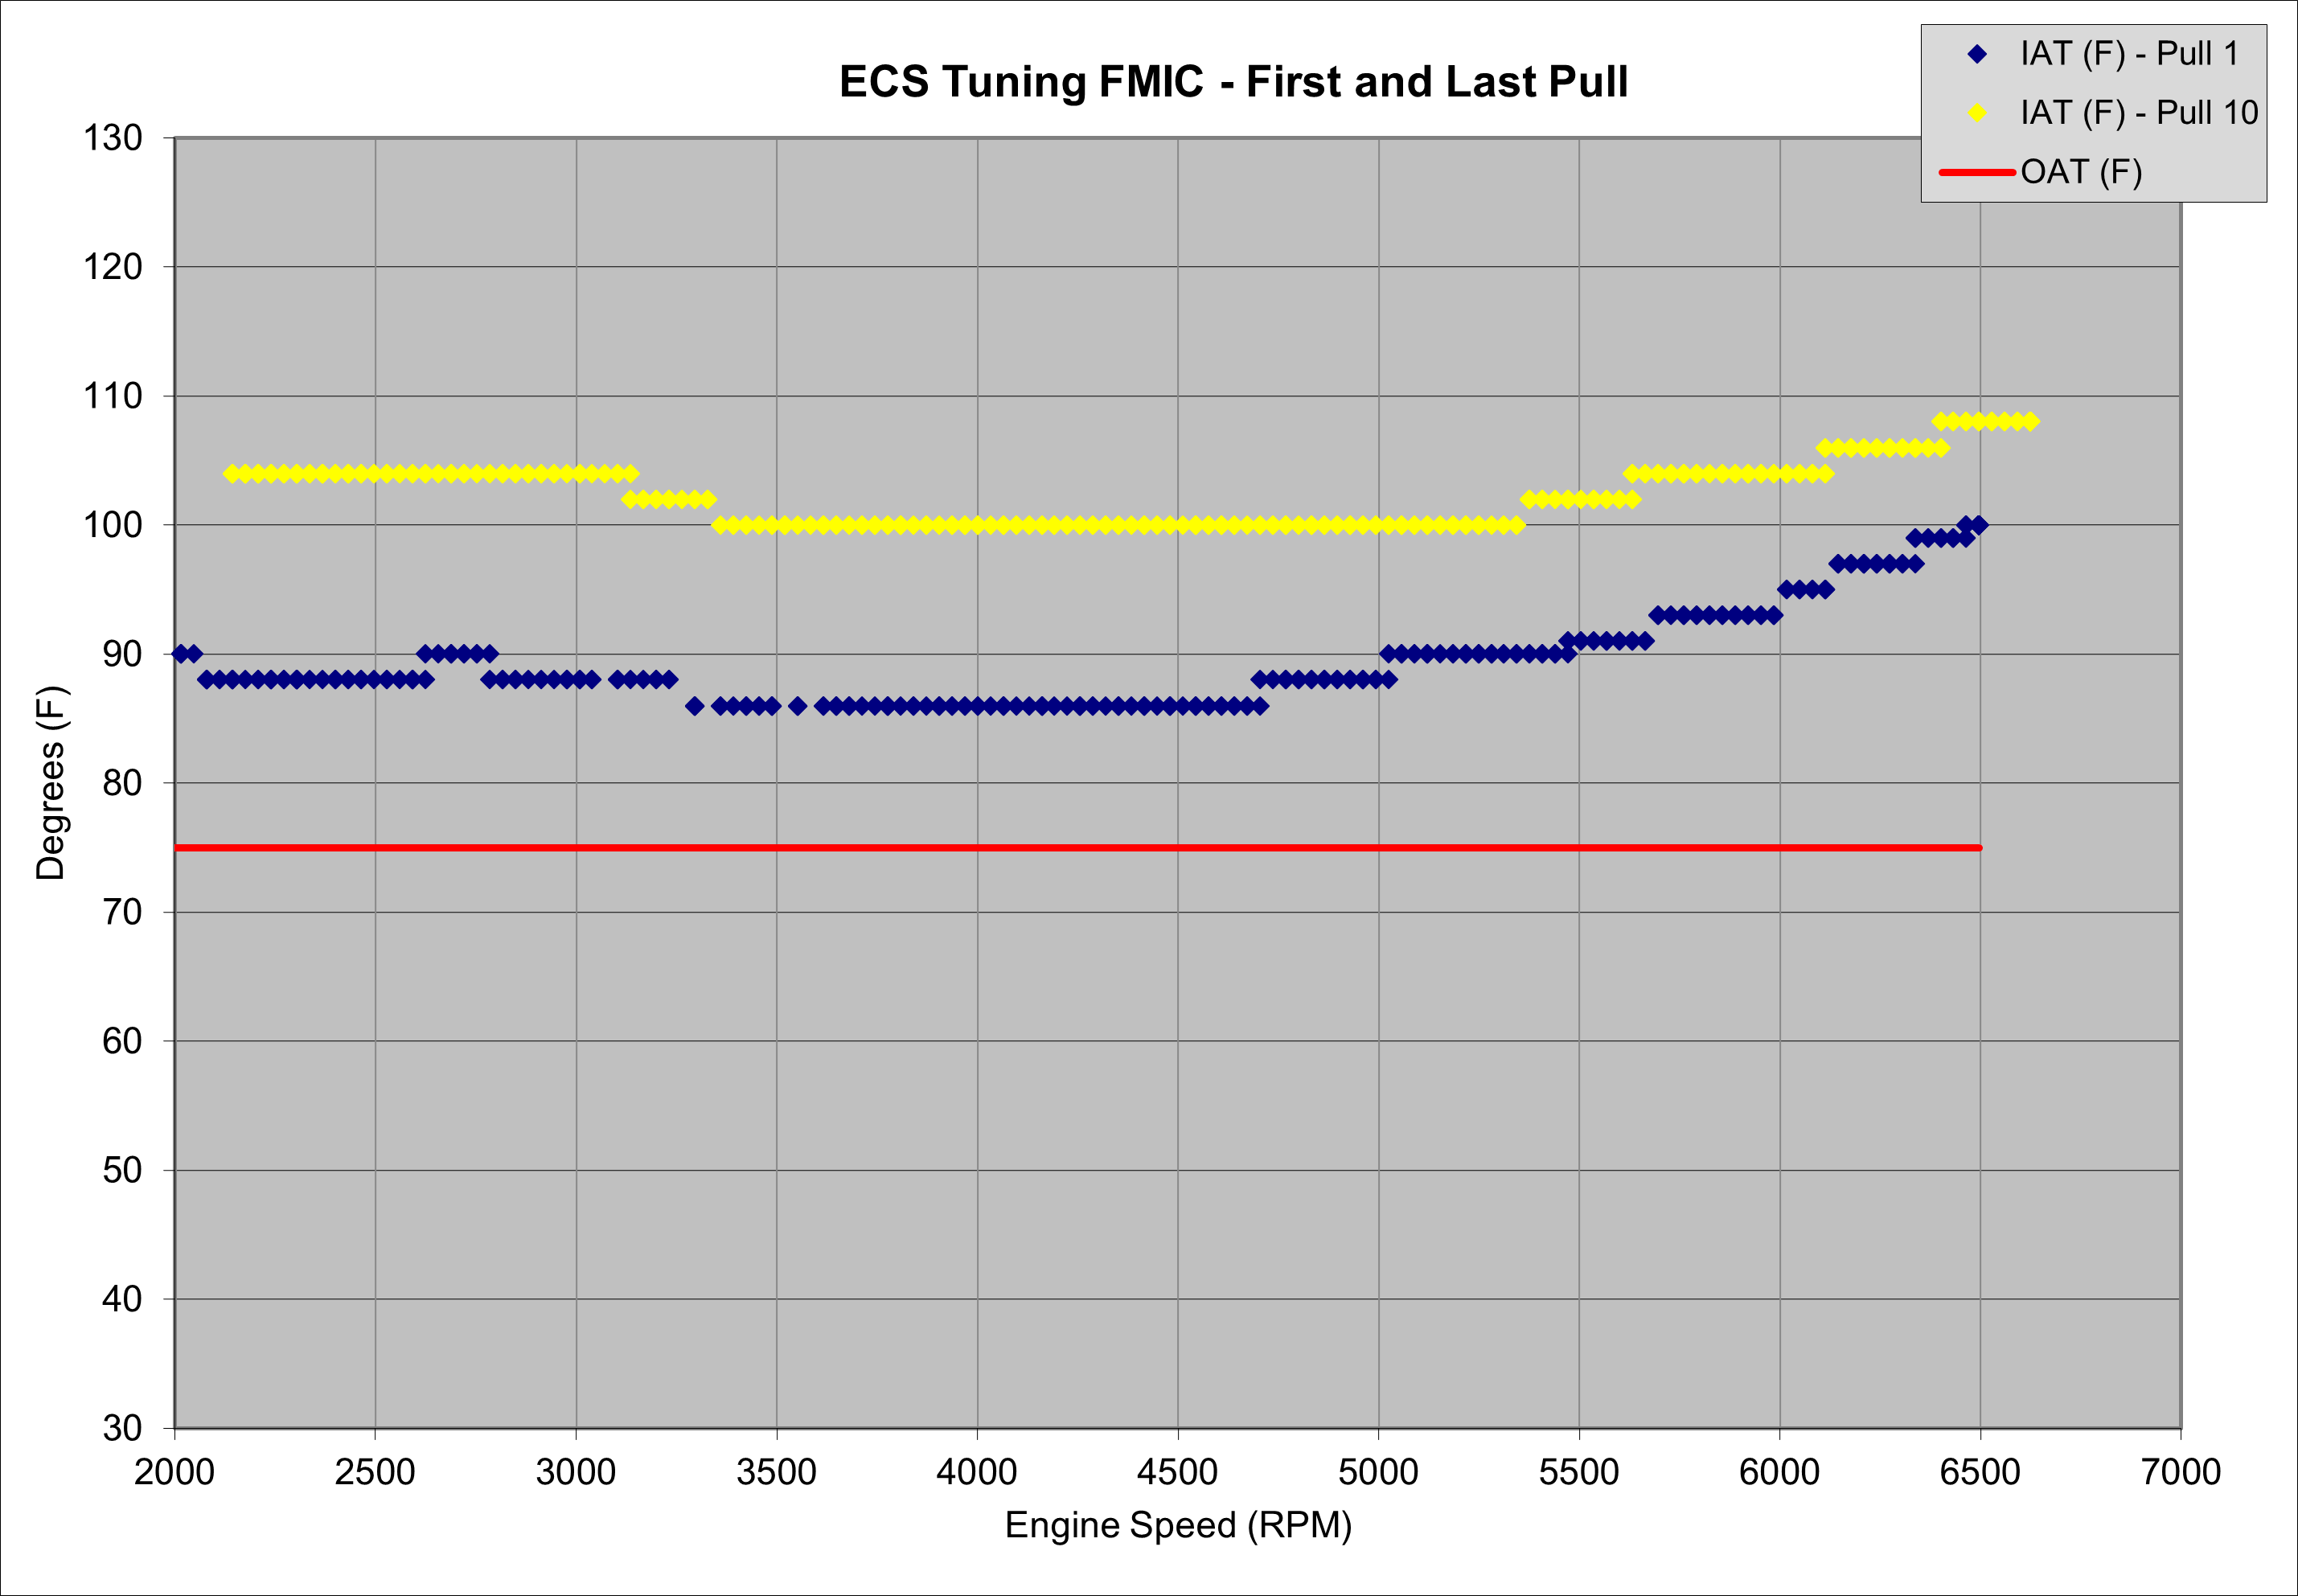
The next chart shows the IAT of the first and last pulls of the ECS Tuning FMIC collection session, there is no comparison with the other intercoolers on this chart.
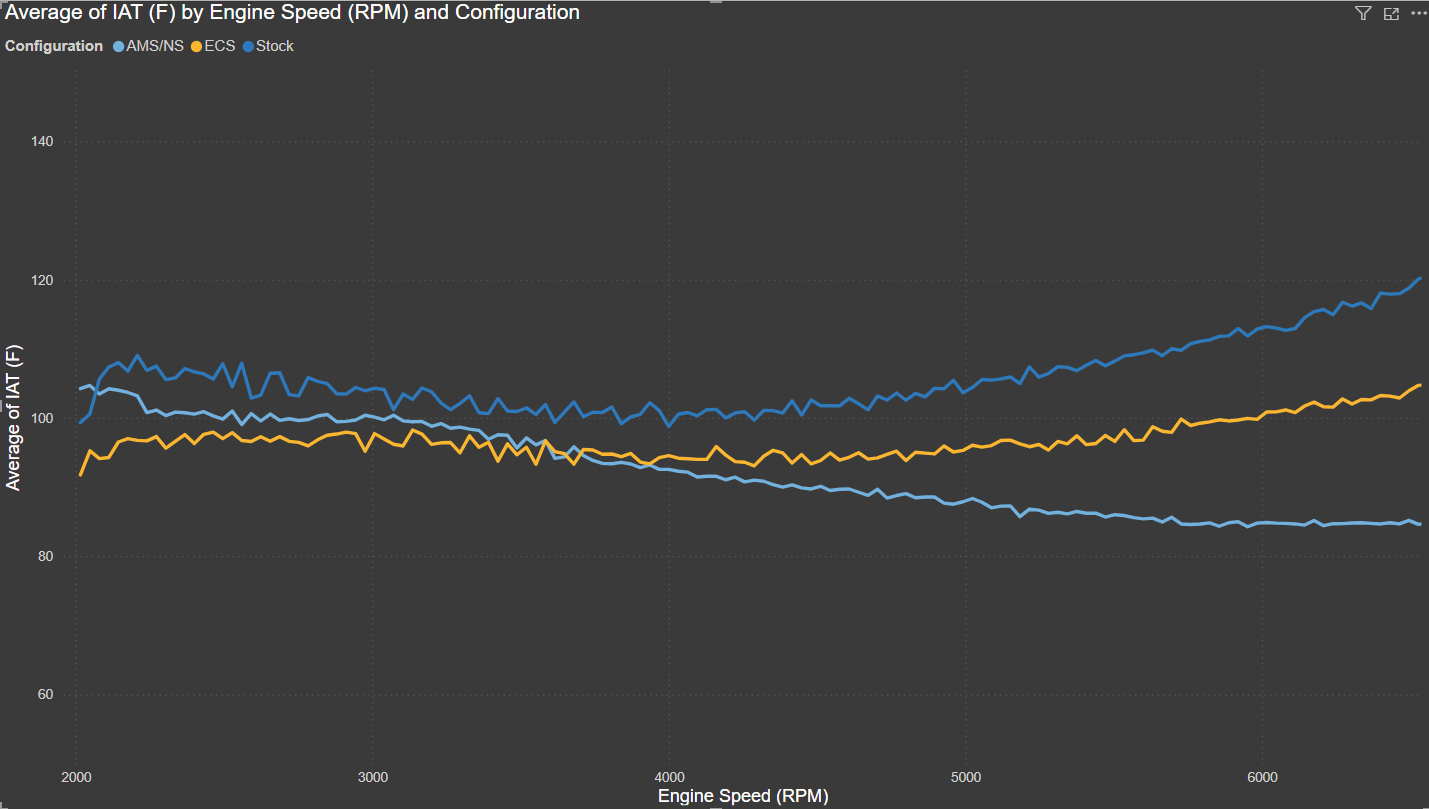
This chart shows the average IAT across the pulls.
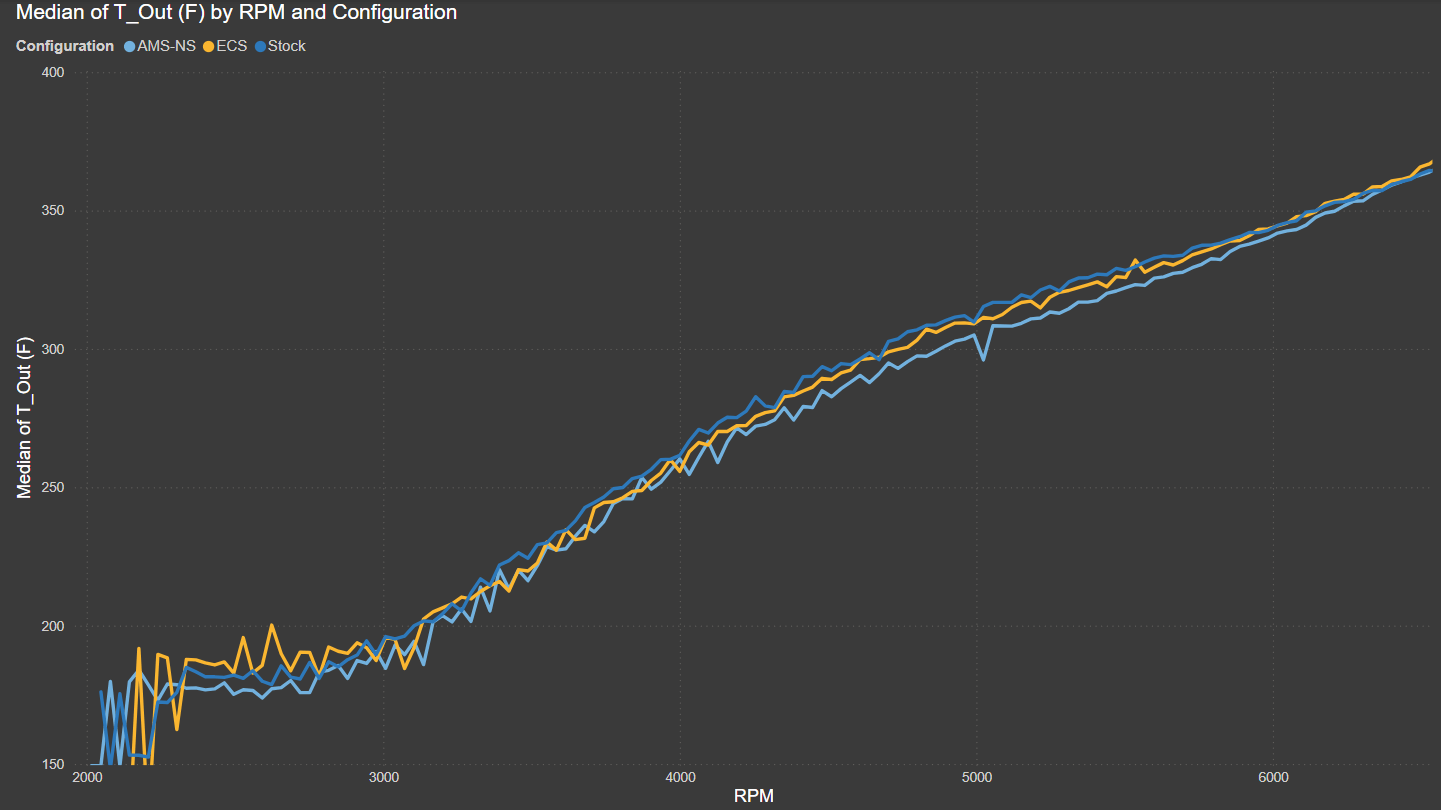
Next is the average temperature exiting the turbocharger throughout the pulls.
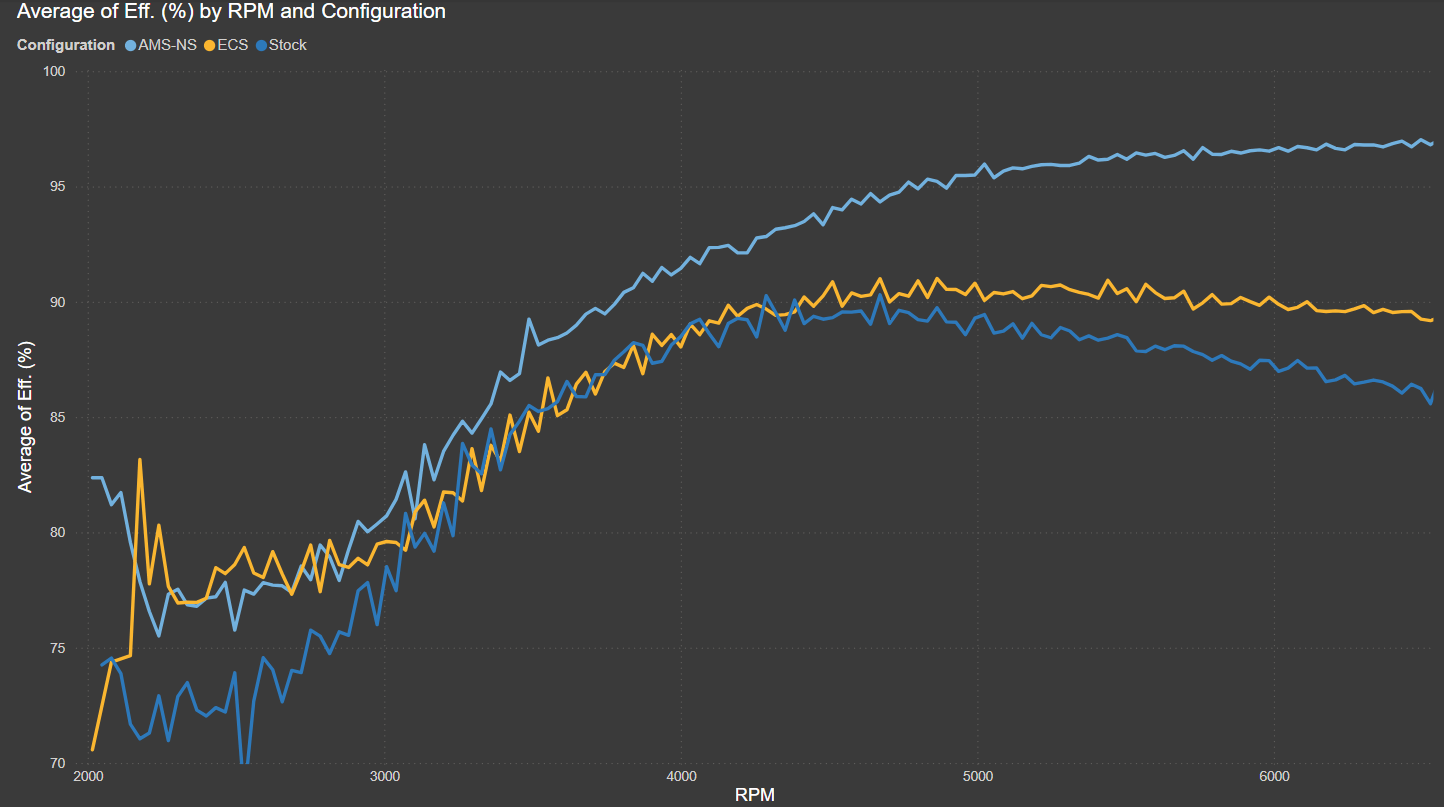
Next is the average intercooler cooling efficiency throughout the pulls.
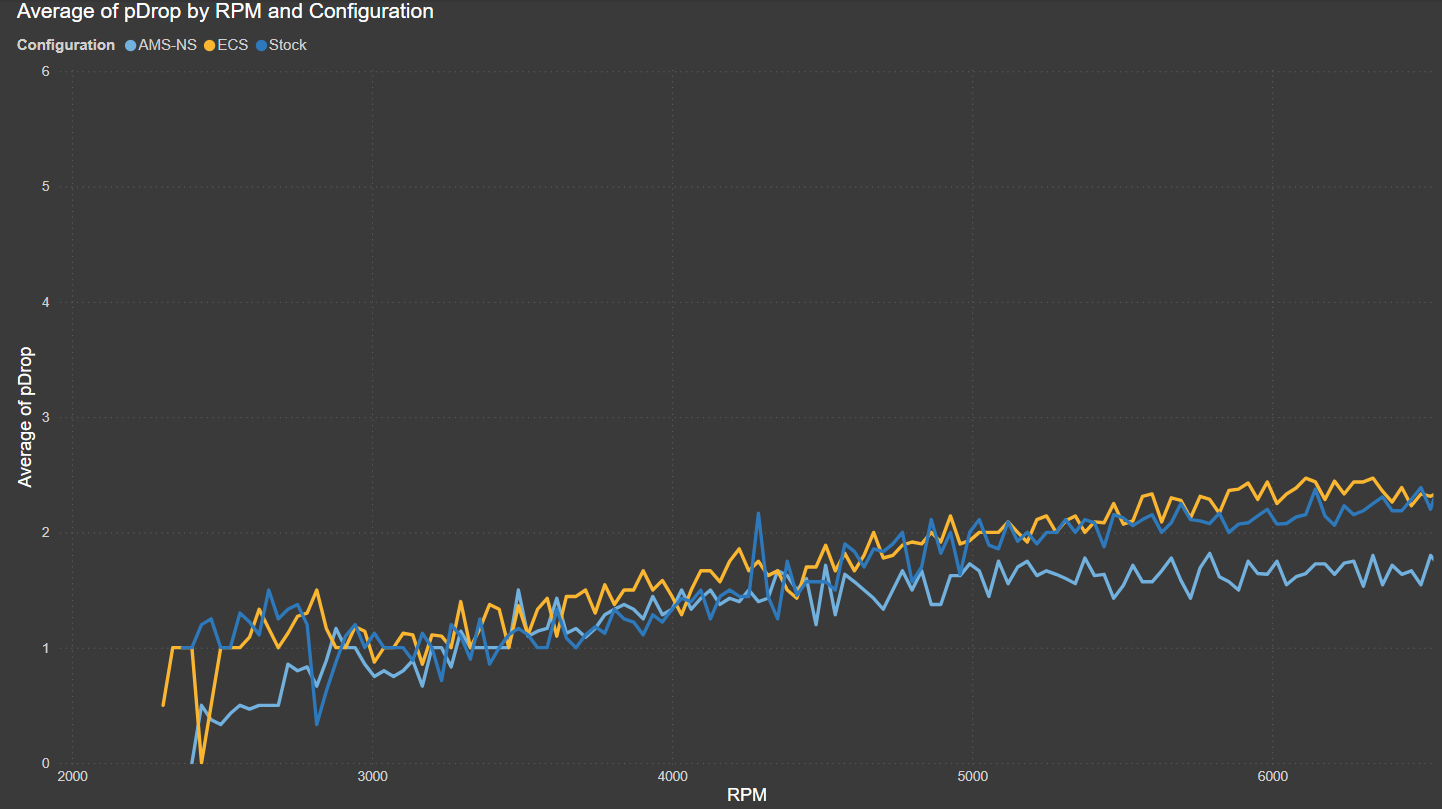
This chart shows the average pressure drop between the turbocharger compressor outlet and the intake manifold.
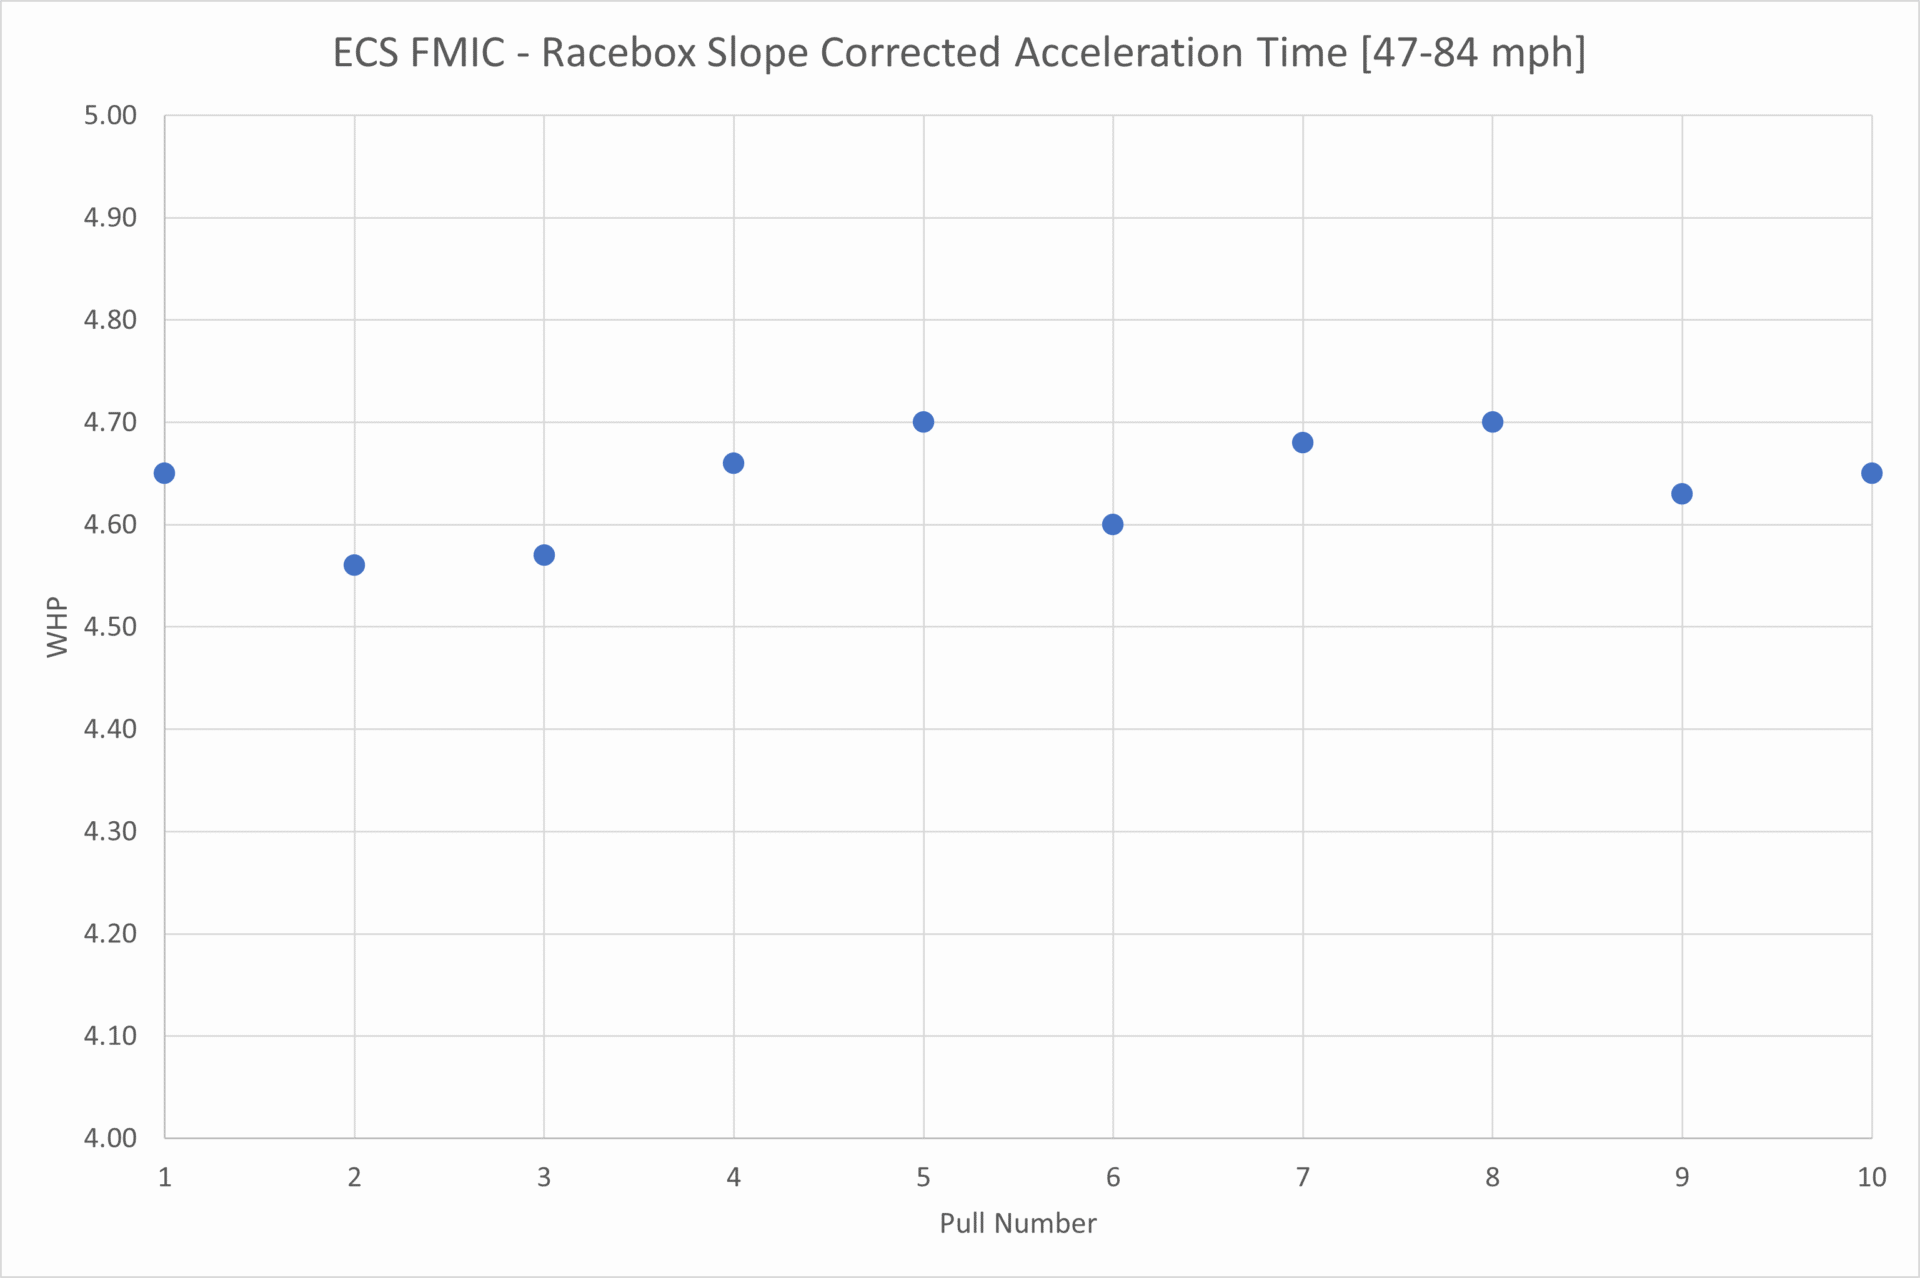
The trend of acceleration times using the ECS Tuning front-mounted intercooler is shown next.
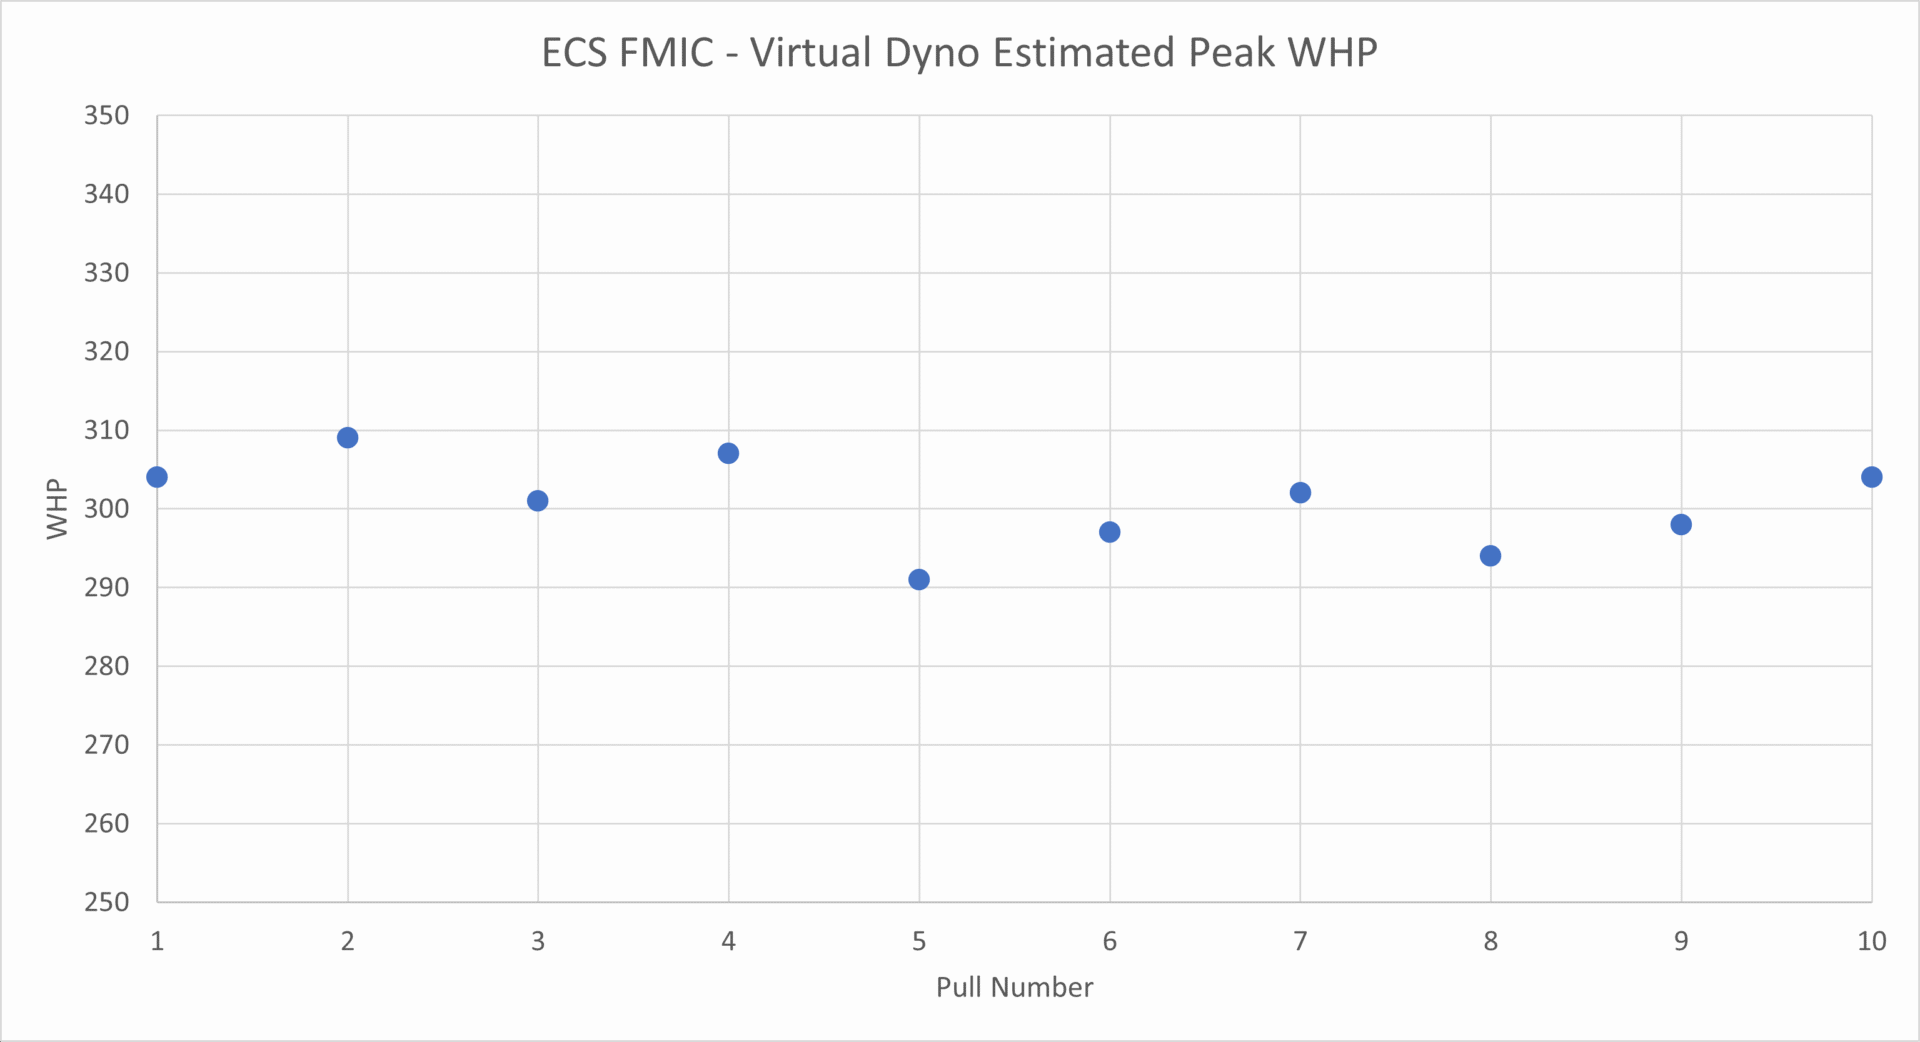
The trend of peak Wheel Horsepower is shown next:
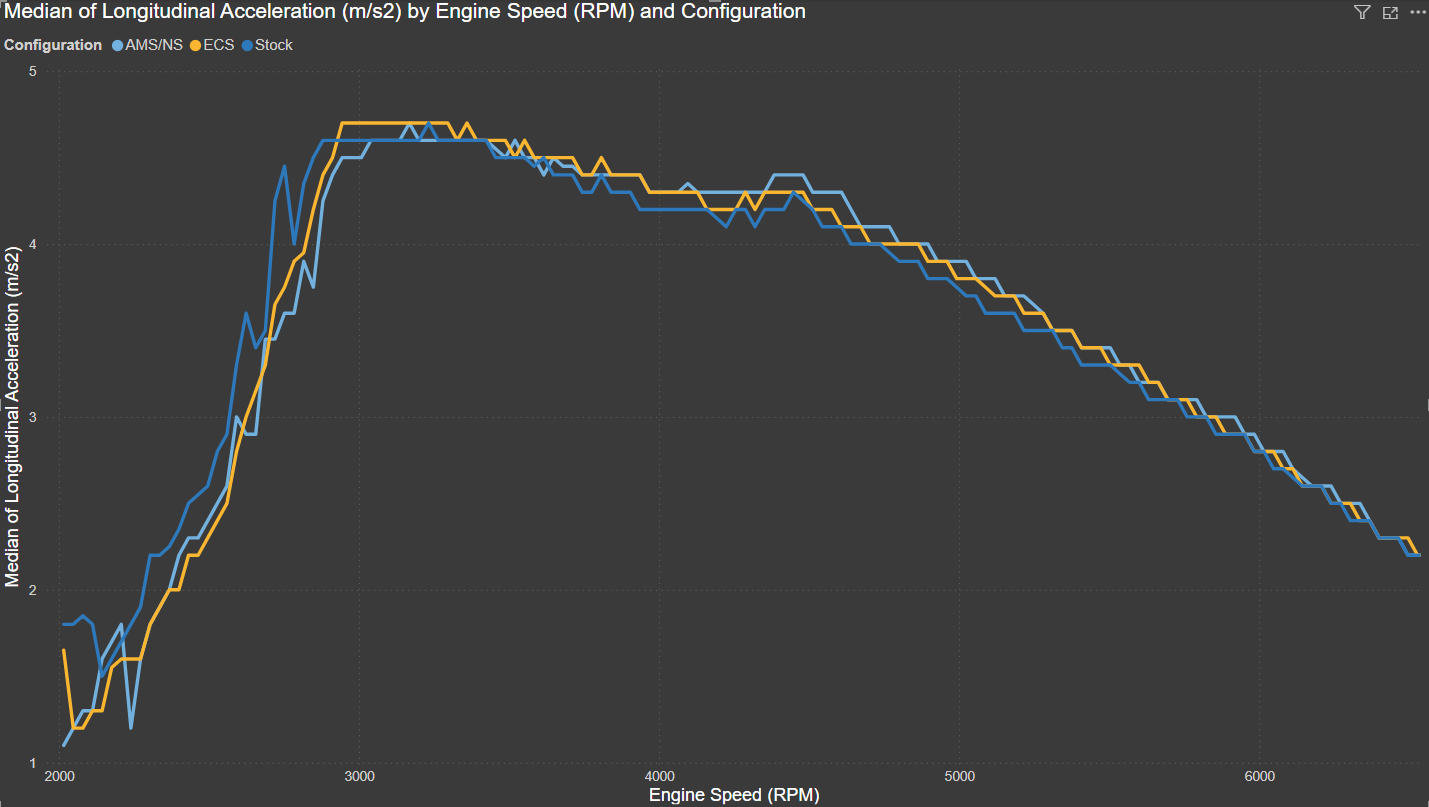
The next chart shows the average longitudinal acceleration of the GTI with each of the intercoolers installed.
Notably, even though the AMS/NS combination has the lowest pressure drop and lowest IAT the wastegate duty cycle (WGDC) is slightly higher than with the stock IC and ECS Tuning FMIC. This points to another factor contributing to the wastegate duty cycle, most likely the pre-turbo air temperature since the ambient air temperature was 79F for both the stock GTI IC session and AMS/NS session. (The ambient temperature was 5F lower during the ECS Tuning session.)
Conclusions:
The ECS Tuning FMIC for the Mk7 GTI was installed on an IS20-equipped GTI and operated on the street to collect engine and vehicle data.
In general, the performance of the ECS Tuning FMIC fell between the the stock GTI IC and the AMS/NS bicooler.
This result was expected since the purpose of recording the stock GTI IC was to establish an expected lower bound of performance and the AMS/NS bicooler is expected to set an upper performance bound.