Background:
In a previous post, I discussed the reasoning for adding an additional muffler to the CC Design turboback exhaust.
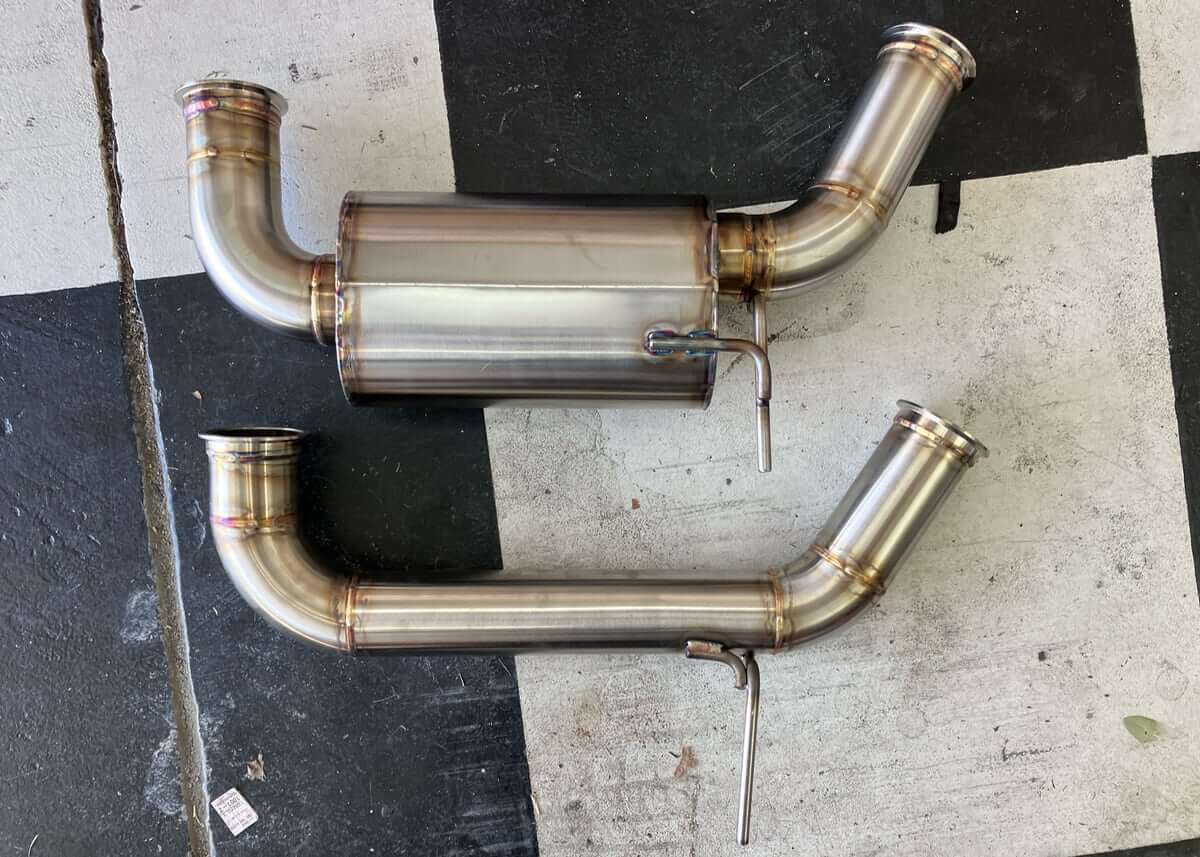
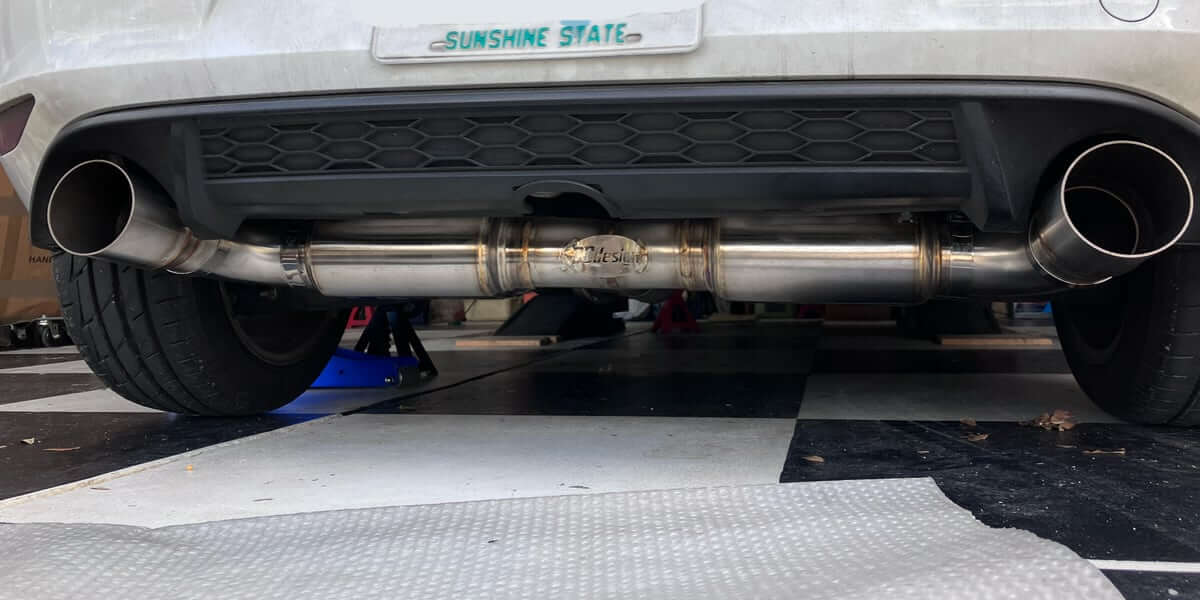
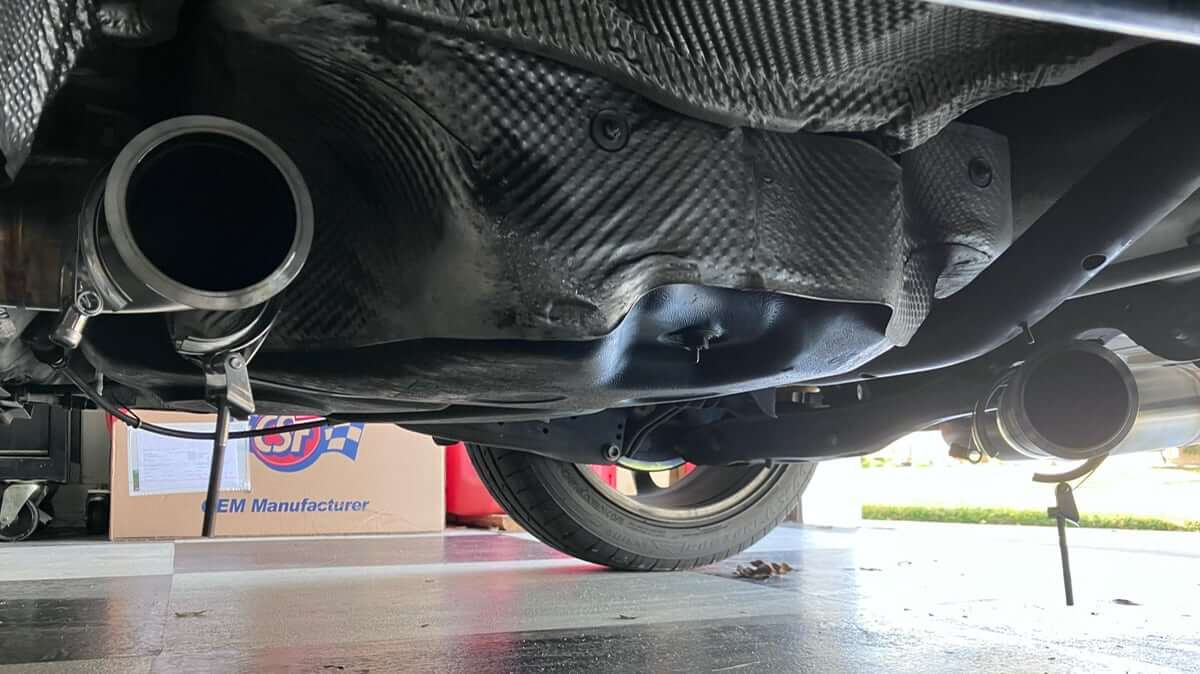
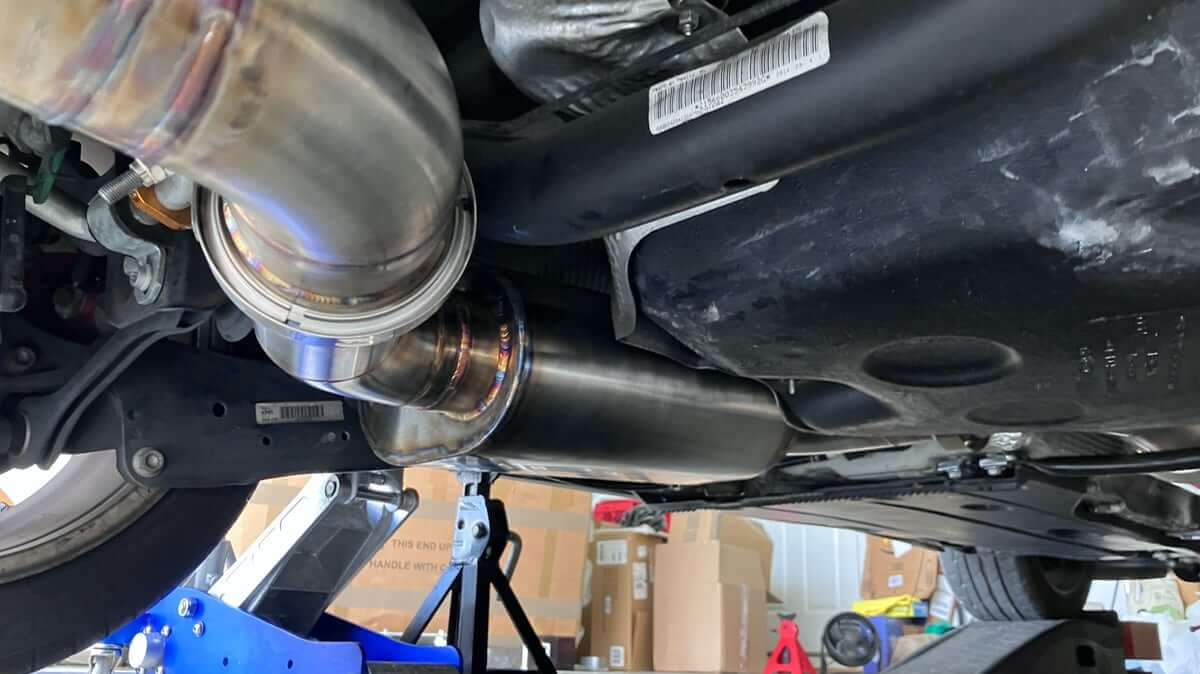
Following the recent delivery of the muffler, I set about installing it. This was made easier by the V-band clamps, which allowed me to drop the one pipe segment and slide in the new muffler.
With the muffler in place, I was ready to head out and record the sound levels inside the cabin.
In this post, I review the sound readings obtained with the muffler installed and compare them with those from previous exhaust setups.
Data collection:
Driving was conducted on the same roads but did not follow a specific speed profile, though I roughly adhered to the posted speed limits.
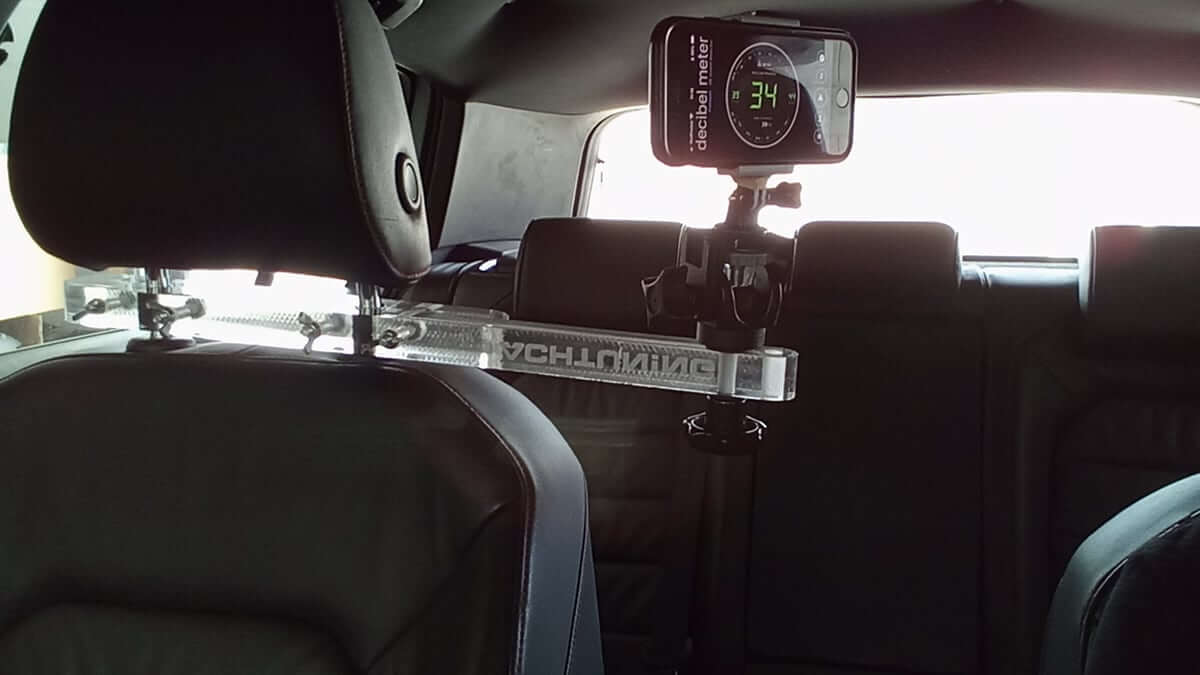
Sound volume is being measured with an iPhone App that applies A-weighting to the measured sound levels. The phone is placed at approximately head level between the front headrests.
Data:
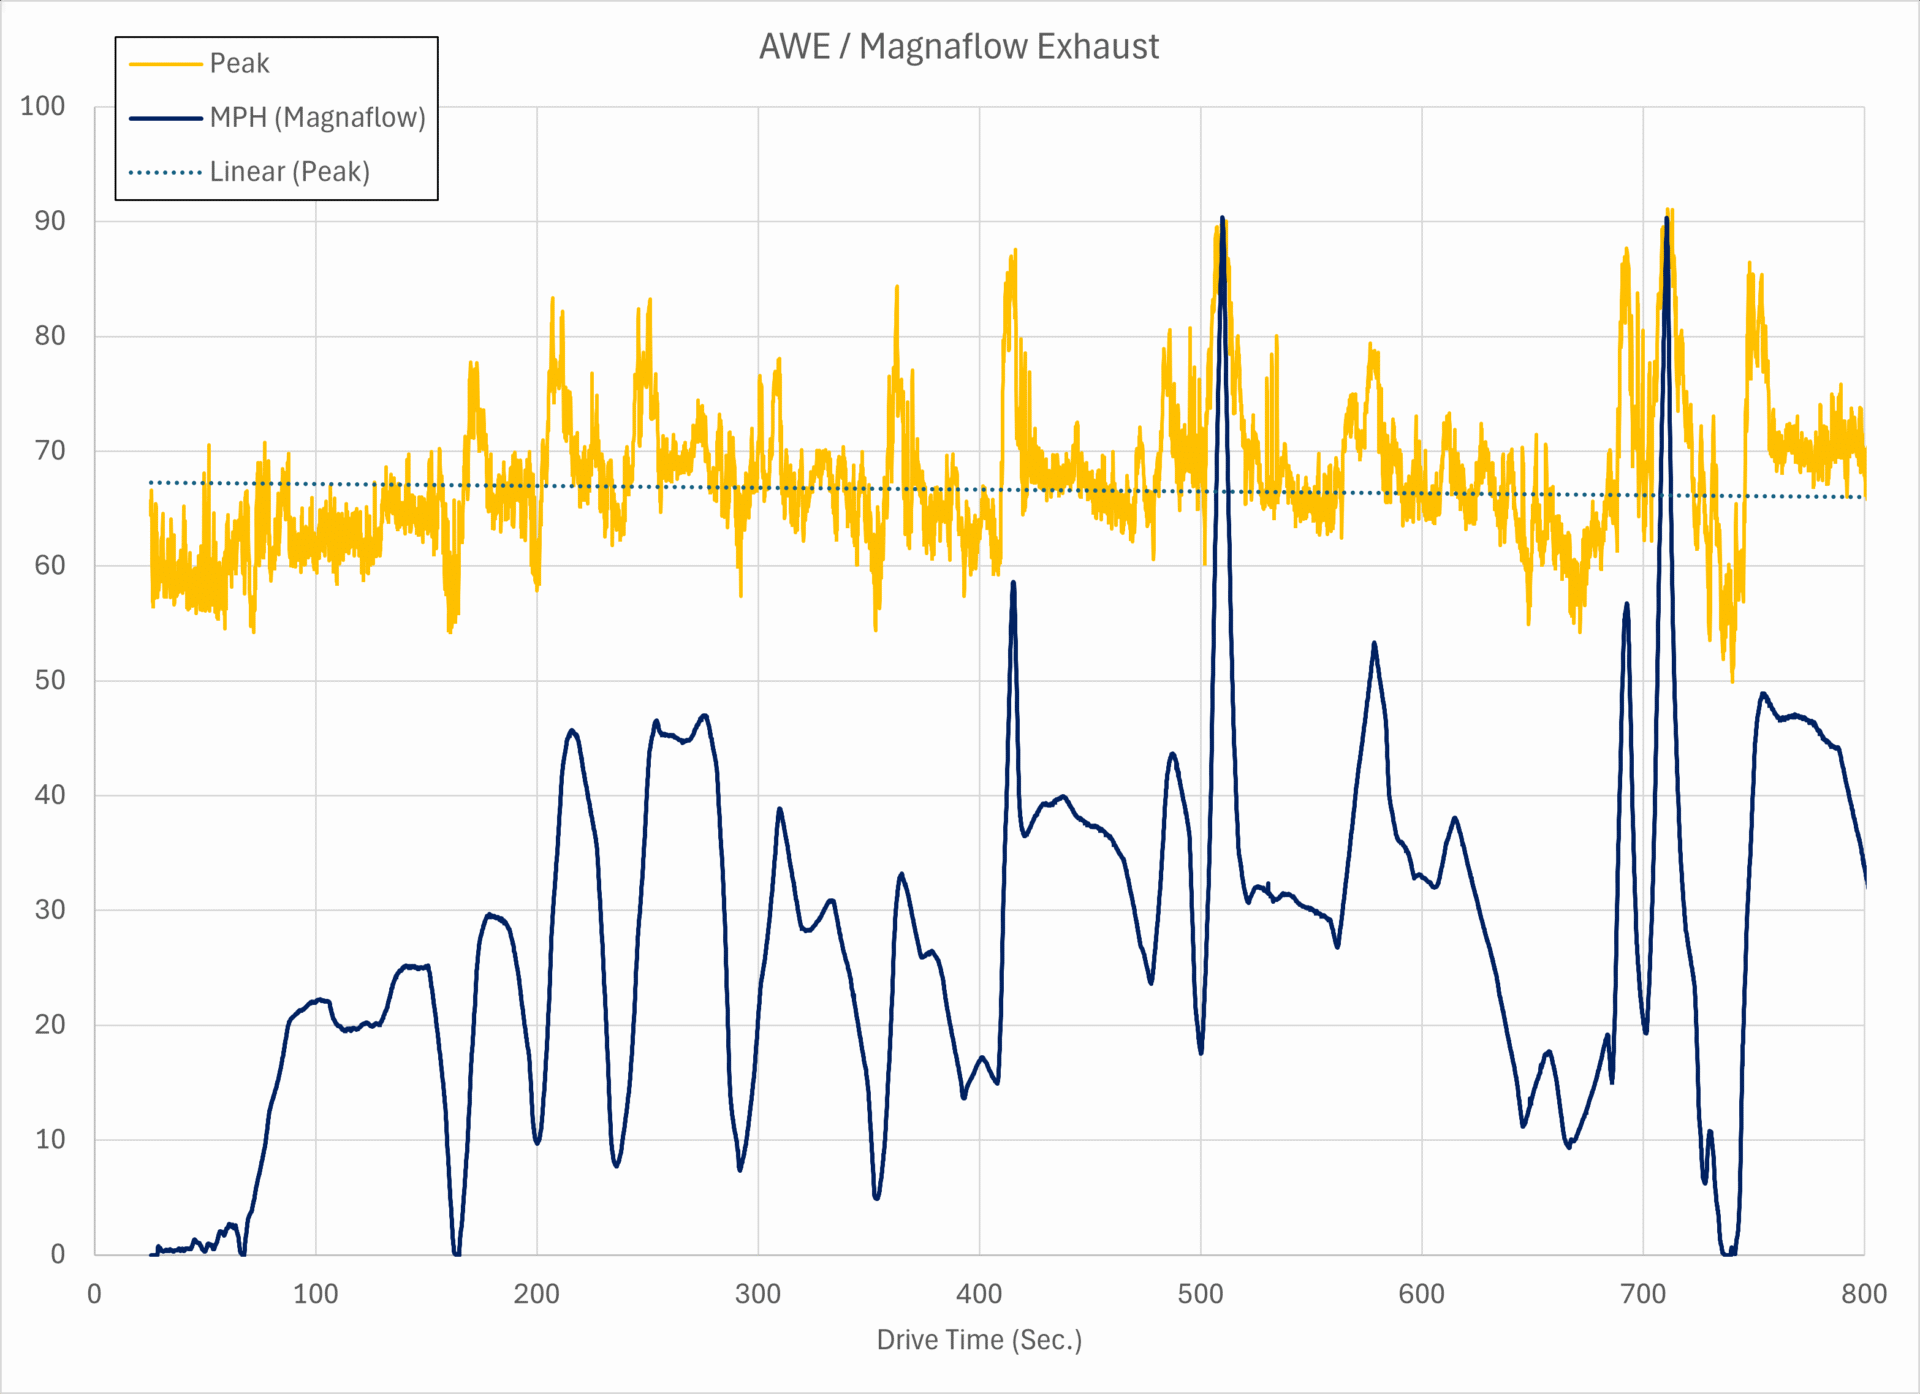
The sound level and GTI speed are plotted over time for the baseline setup (Left), which consists of a catless Trackslag downpipe, a Baun midpipe with a Vibrant resonator, and an AWE-Tuning exhaust with a Magnaflow muffler.
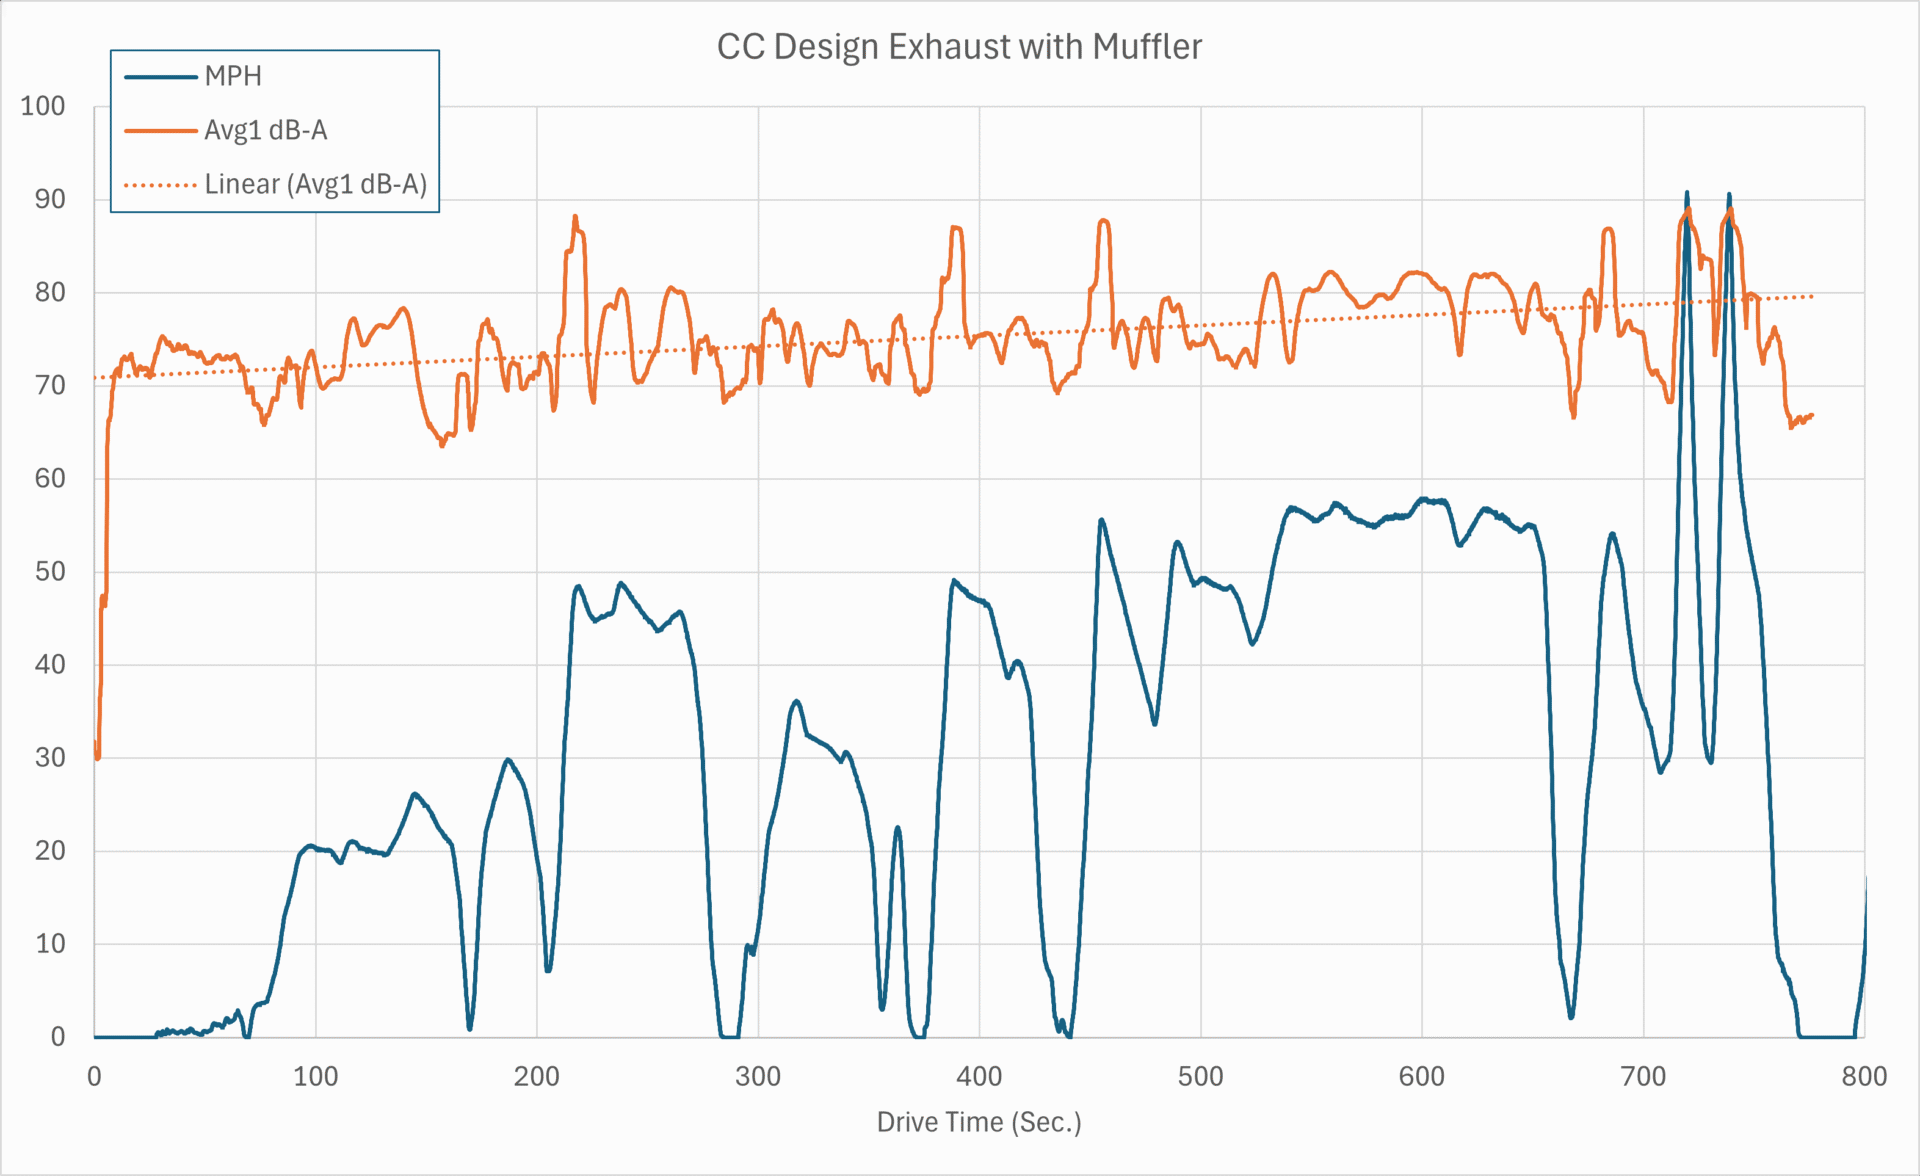
The CC Design muffler setup is shown in the Right chart.
A linear trend line is added to the sound level plots.
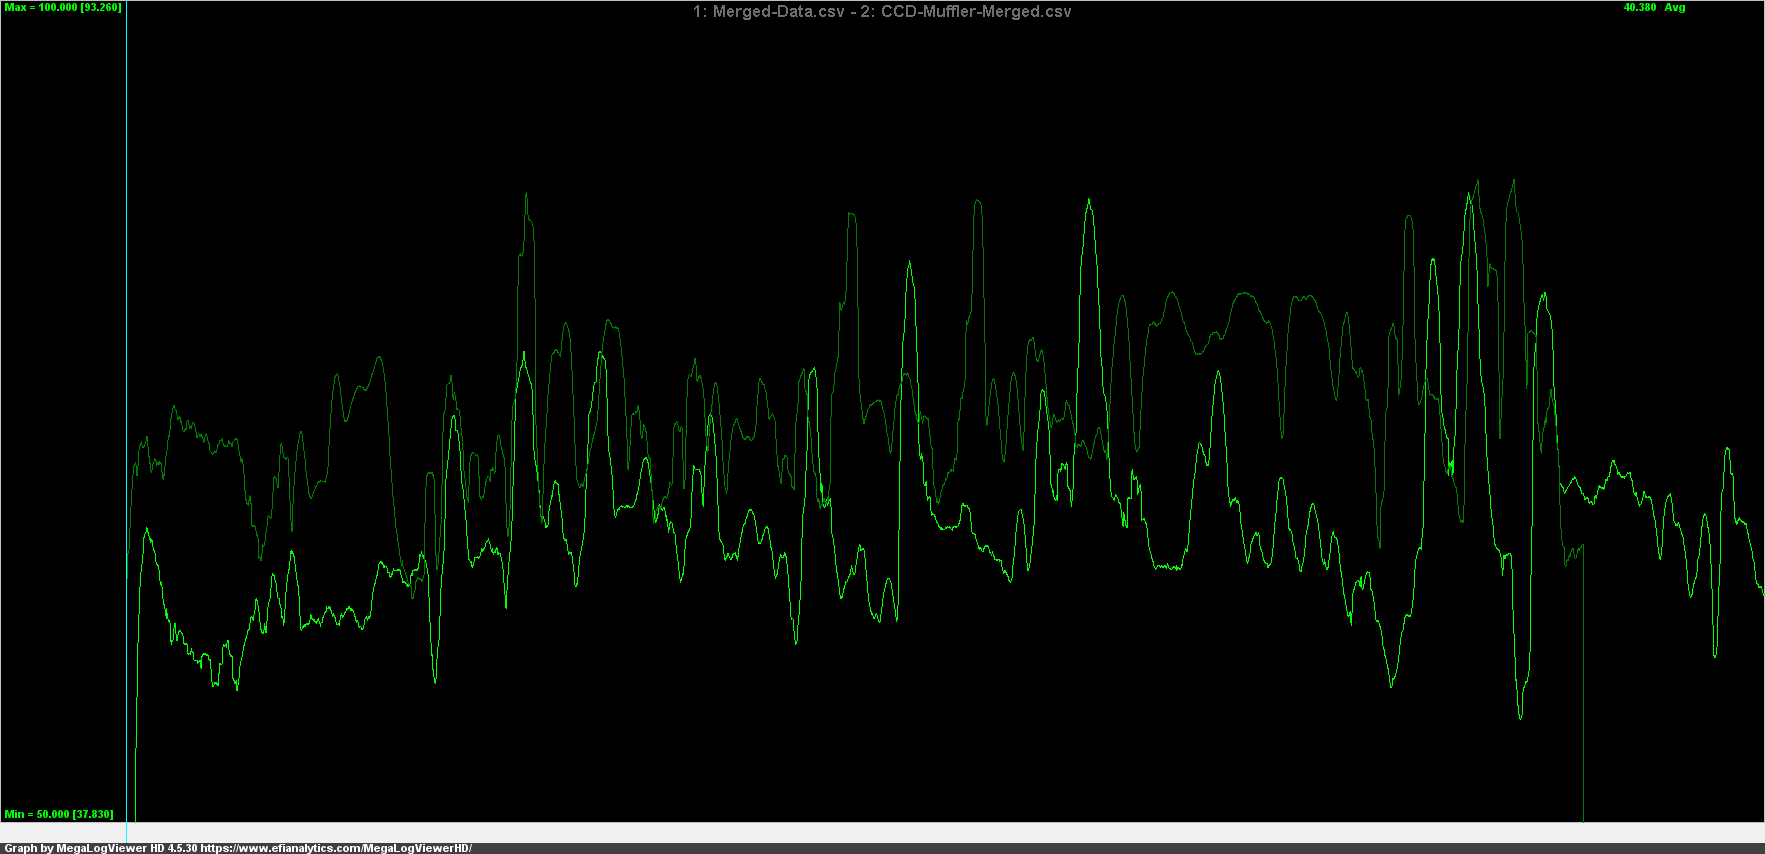
The sound levels for each setup are shown overlaid in the next chart. The brighter green lines are the baseline, and the lighter green lines are the CC Design muffler.
The next chart includes the CC Design exhaust with the straight pipe, still showing the sound level over the drive duration.
- Category 1 (Orange) – AWE/Magnaflow baseline
- Category 2 (Blue) – CC Design w/ Straight Pipe
- Category 3 (Red) – CC Design w/ Muffler
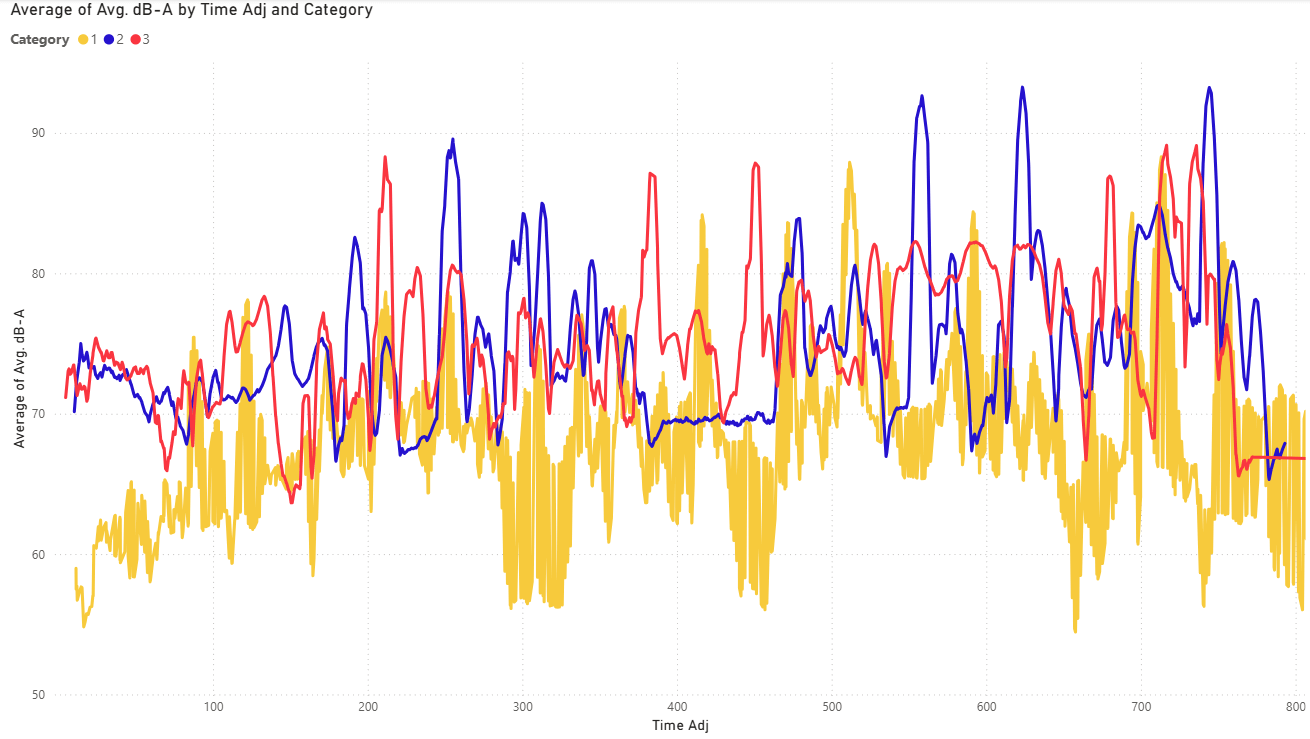
The previous charts show an overall trend: the CC Design muffler is louder than the AWE/Magnaflow exhaust.
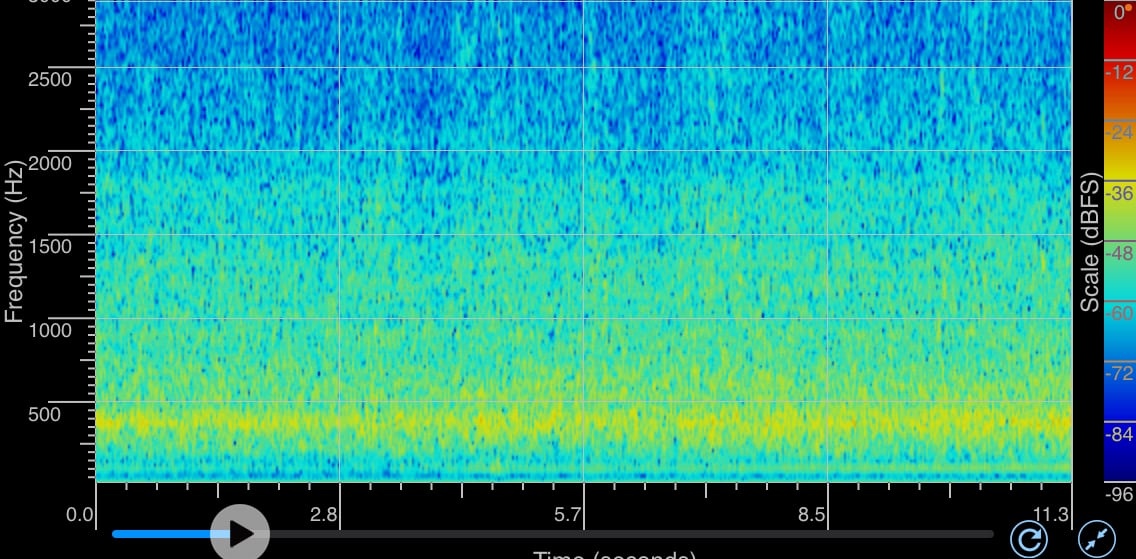
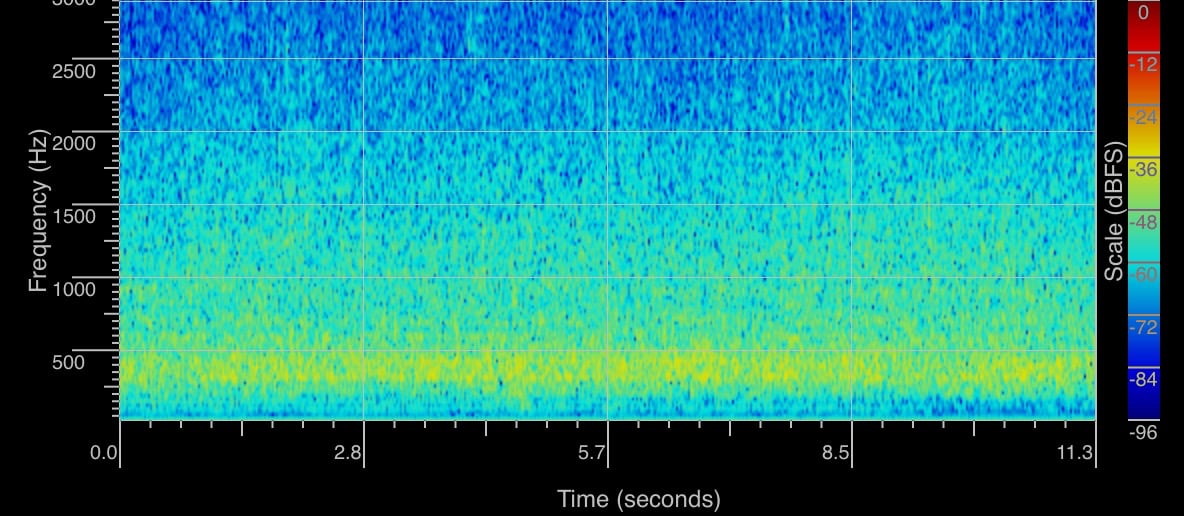
The next comparison is steady-state driving. Of interest to me is the elevated sound level around 375 Hz. This is present with both exhaust setups, but the CC Design muffler is slightly louder (brighter yellow) at this frequency.
The following is a frequency-spectrum snapshot comparison from steady-state driving. The red line is from the CC Design muffler data, and the blue-shaded area is from the AWE-Tuning exhaust.
The elevated sound level at 375 Hz from both exhausts is evident here. The CC Design muffler also has a higher sound level at 125 Hz than the Magnaflow muffler.
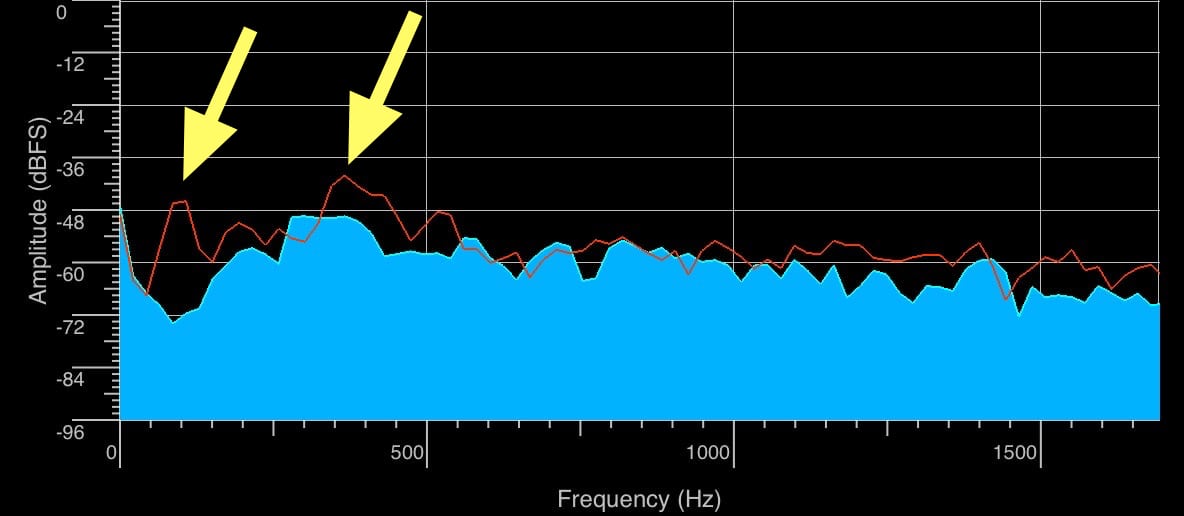
Note: These sound profiles change as you view the recording; the snapshot captures a moment in time and should be viewed as an estimate of how sound levels compare at different frequencies.
My guess is that the 125 Hz and 375 Hz harmonics are combining to create a more annoying sound level in the cabin during steady-state driving.
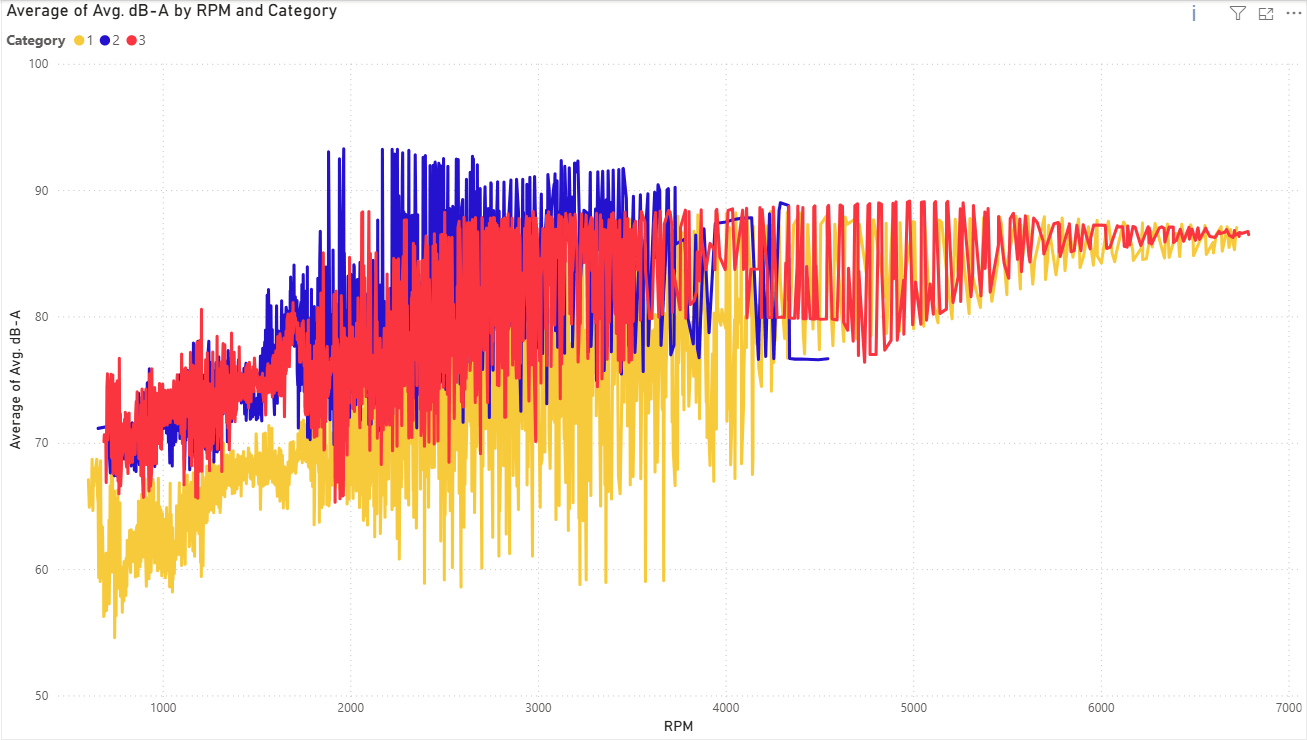
The following charts show how sound levels across the different setups vary with factors such as engine speed, vehicle speed, throttle position, etc.
The category to set up matching remains the same:
- Category 1 (Orange) – AWE/Magnaflow baseline
- Category 2 (Blue) – CC Design w/ Straight Pipe
- Category 3 (Red) – CC Design w/ Muffler
This chart shows how the sound level changes with engine speed across all gears.
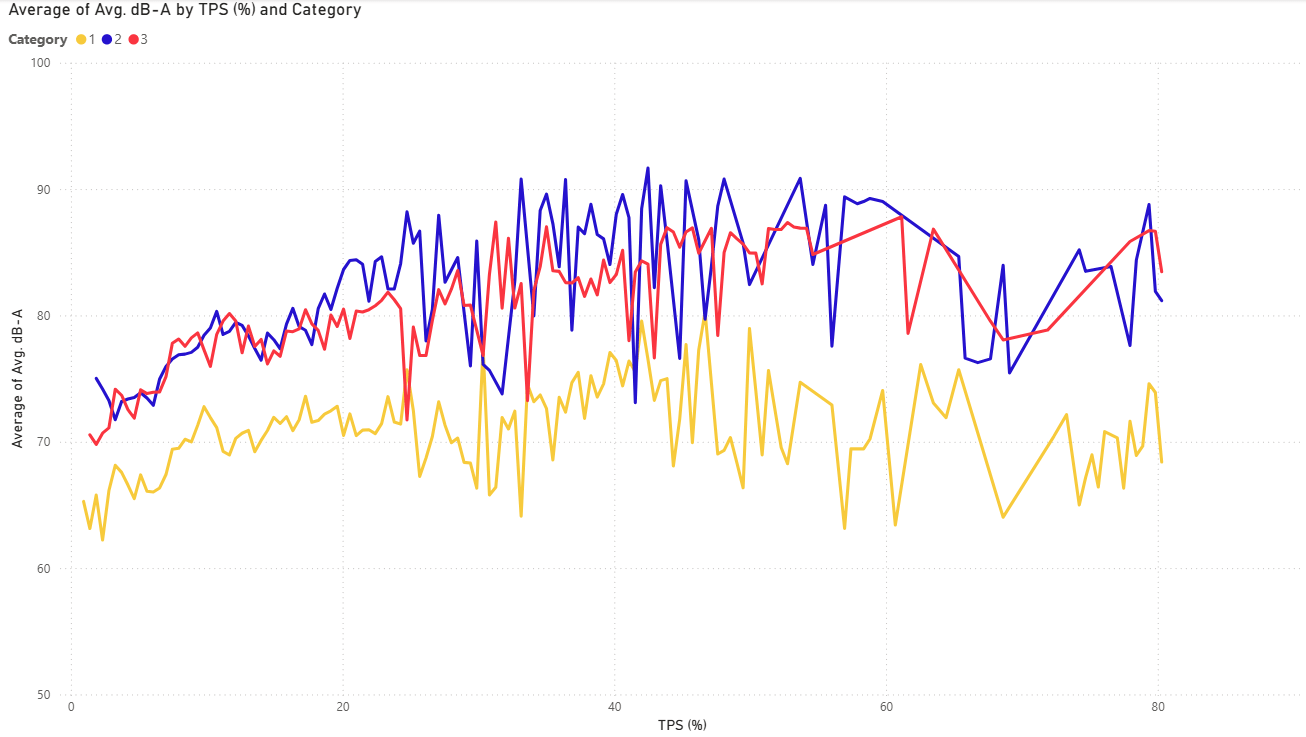
This chart shows the change in sound level with Throttle Position.
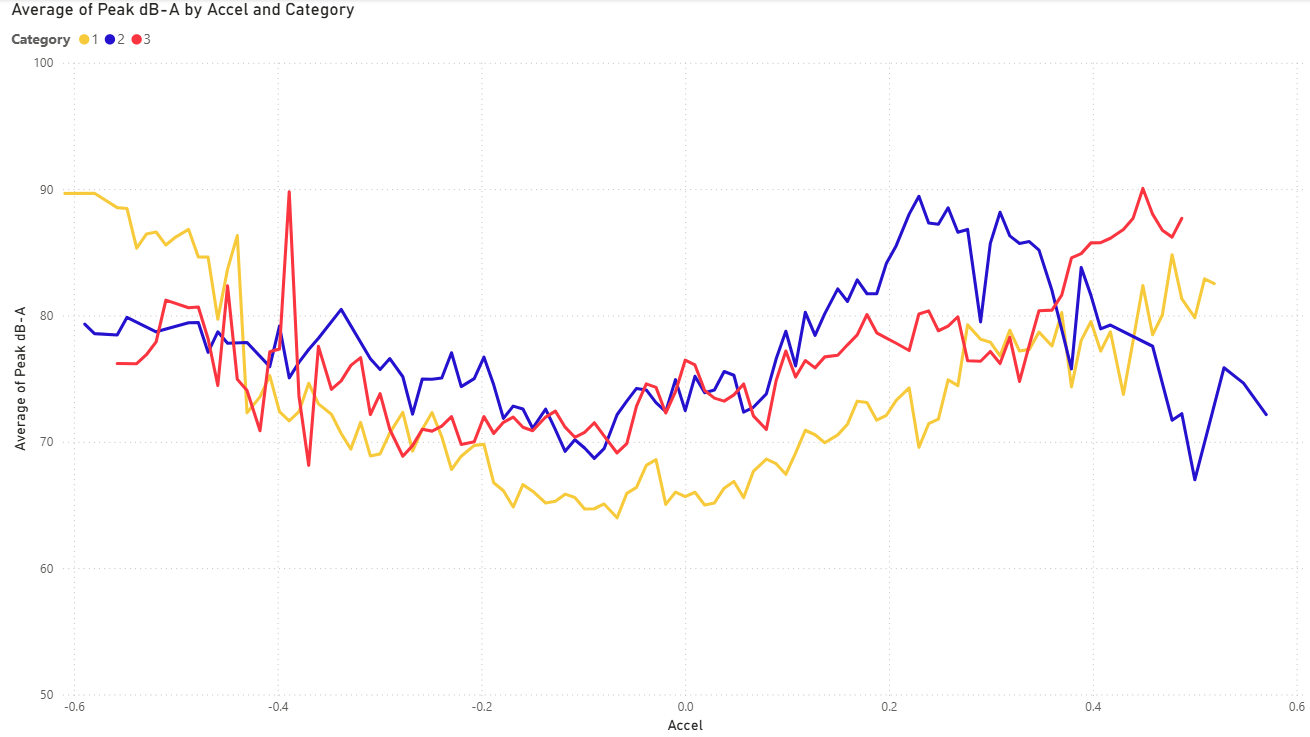
This chart shows the change in sound level with the vehicle’s acceleration (positive values) or deceleration (negative values).
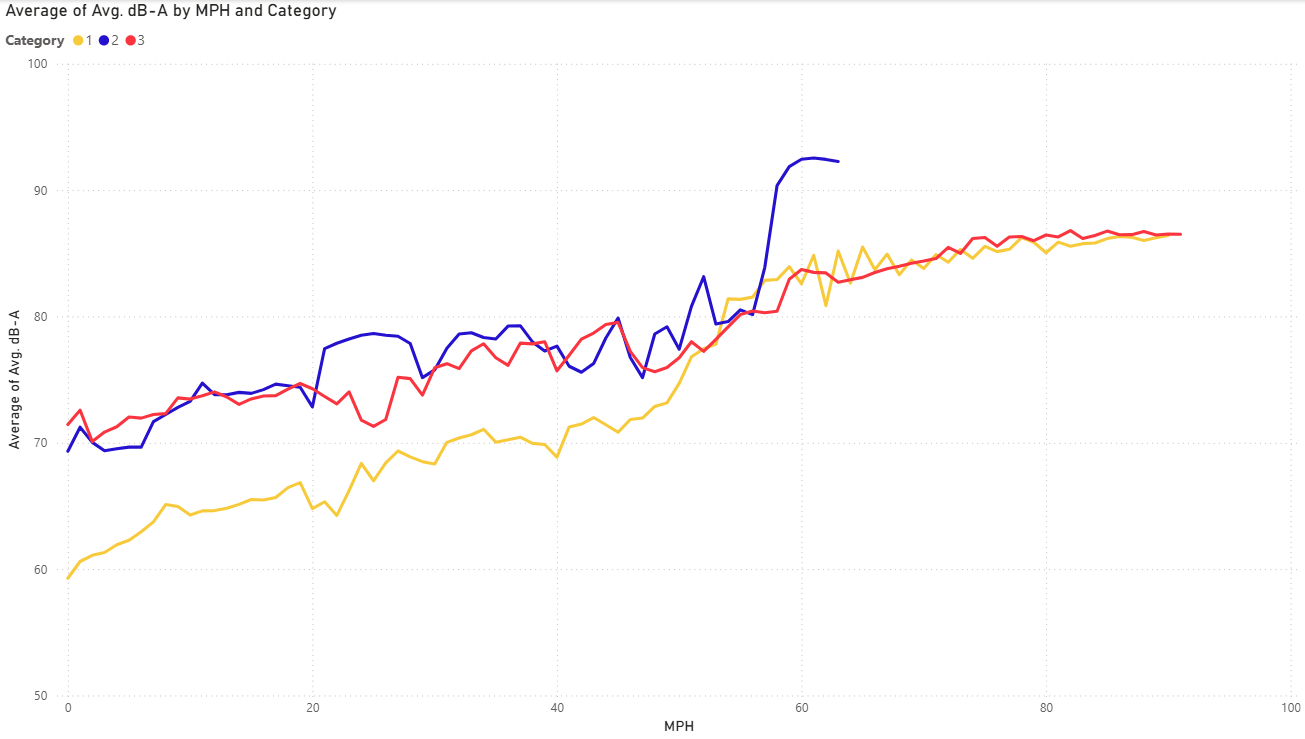
This chart shows the change in sound level with vehicle speed.
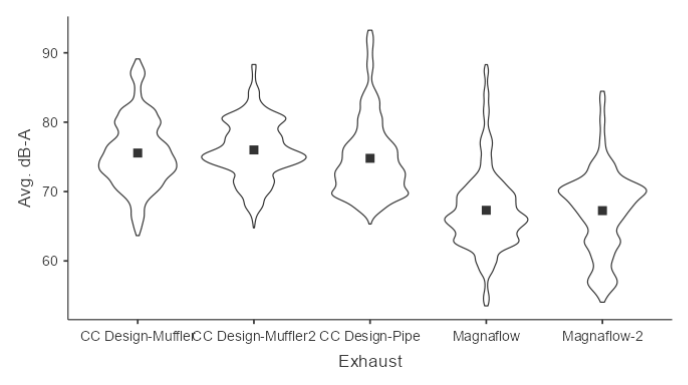
To calculate summary statistics, the next chart aggregates all sound level measures and computes a mean value, shown by the black square.
Note: Two drives were made with the AWE/Magnaflow and CC Design mufflers to check for consistency; these are shown in the following charts.
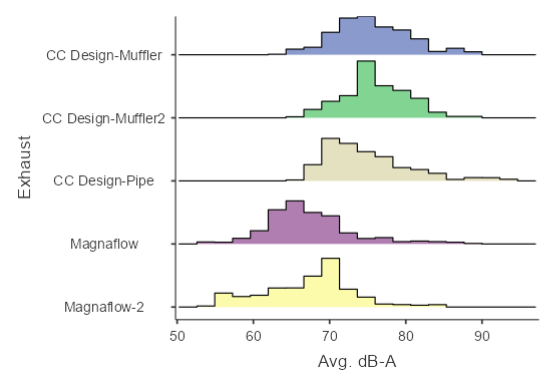
The histogram shows the same information as the violin chart (above), but in a different format and without the mean.
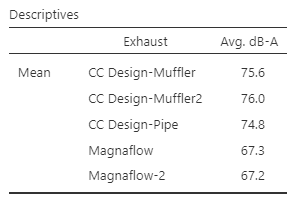
A table of the mean sound levels follows:
Conclusions:
Surprisingly, the muffler had little effect on cabin noise levels compared to the CC Design exhaust with the straight-through pipe.
The muffler helped reduce some of the loudest peaks observed with the straight pipe, but compared to the AWE/Magnaflow combination, the CC Design exhaust is, on average, 8-9 dB louder.
Because sound levels are logarithmic, this is nearly twice as loud (10 dB is 2x as loud), a very noticeable jump in loudness