
Background:
I’ve made a number of posts reviewing examples of Equilibrium Tuning’s misleading advertising.
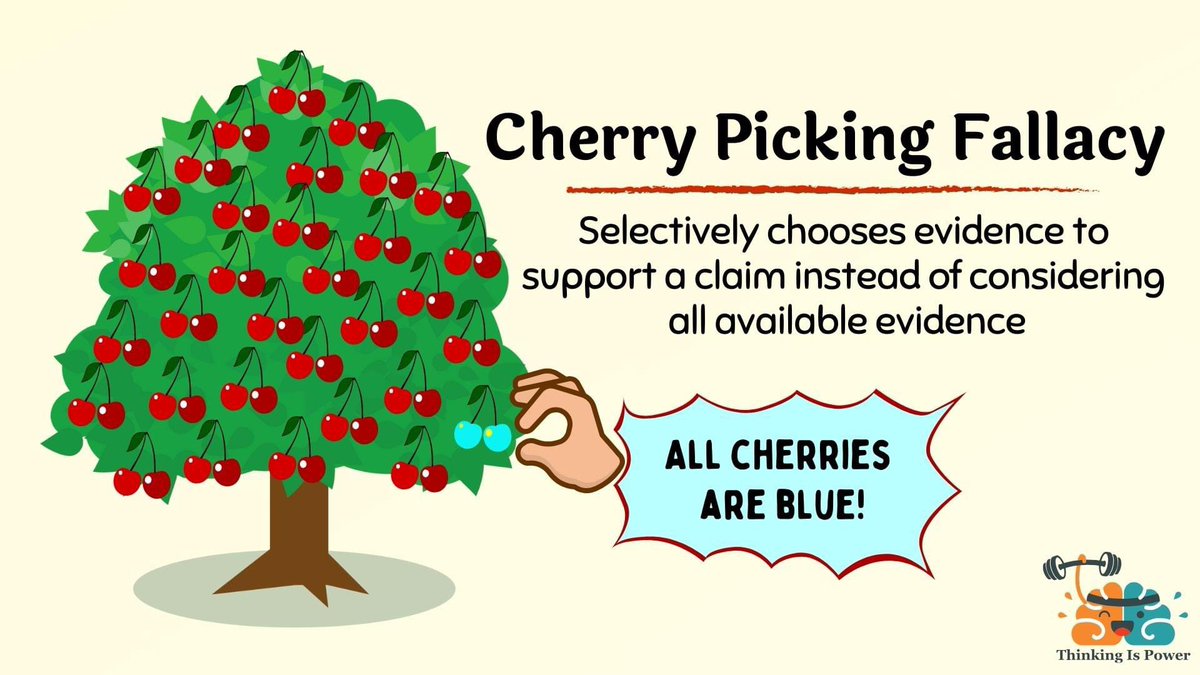
In this review of an advertisement post by Ed Susman, an example of selective promotion, also known as cherry-picking, is shown.
Posted comments:
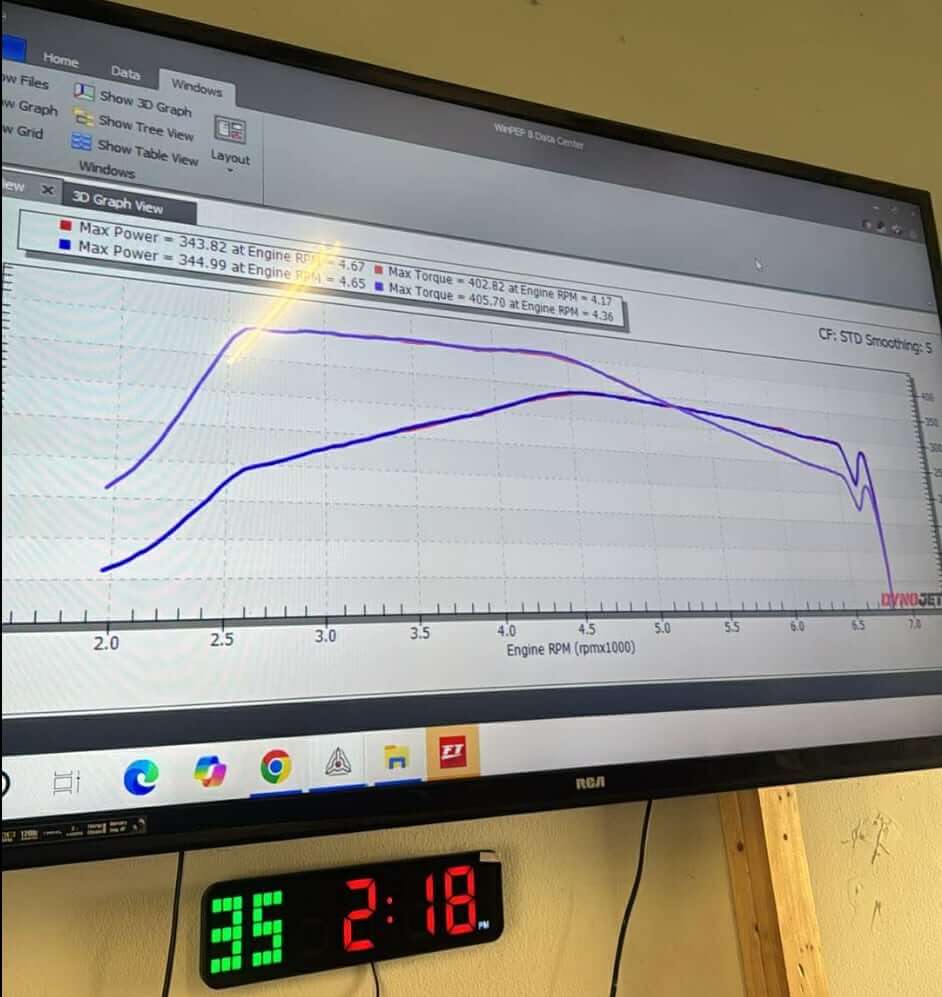
In the post, a single-pull dyno plot is shown. An image that, by itself, is not particularly informative, as the value of data from a dyno is when it is compared with a second measure from the same dyno.
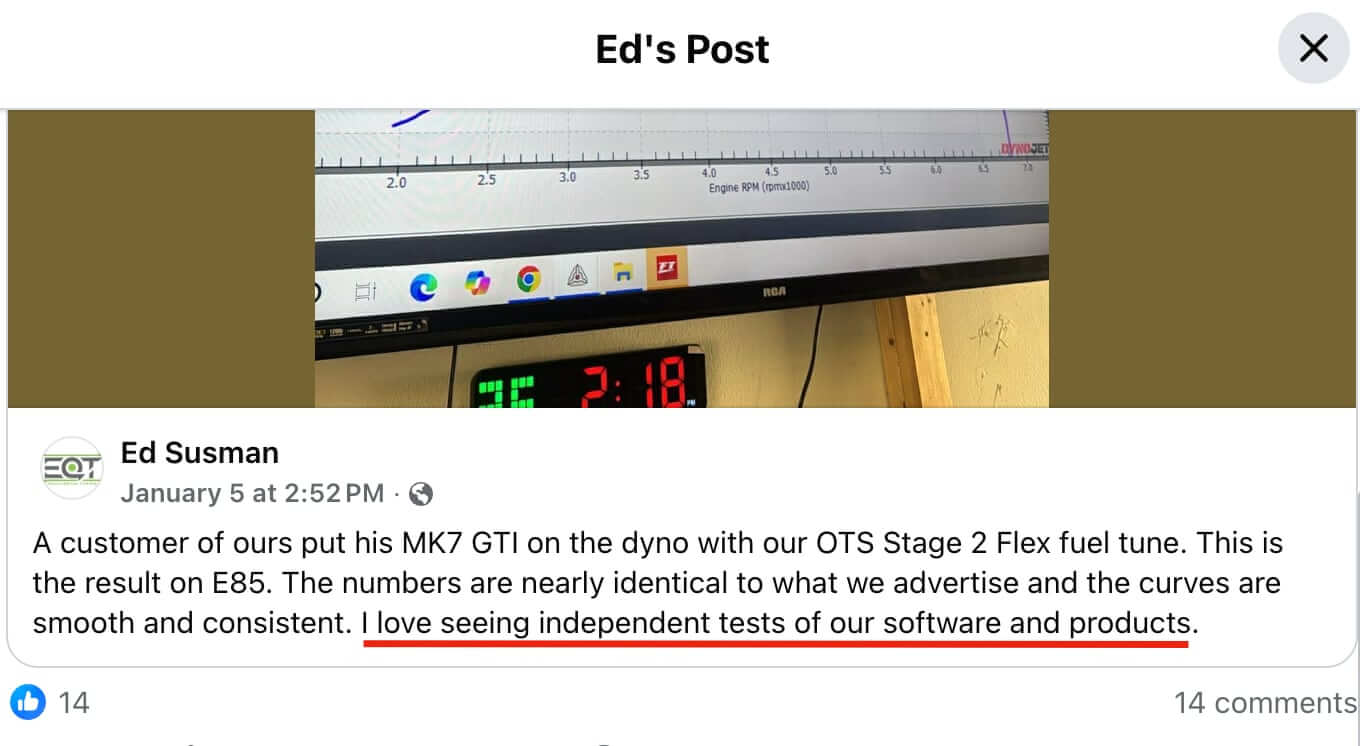
Ed provides a comment on the picture, notably concluding by stating:
I love seeing independent tests of our software and products.
Ed Susman – Salesman/Owner of Equilibrium Tuning Inc.
Fact Check:
To me, as someone who likes to perform independent tests of vendor products and software, the question is whether Ed really does love seeing independent tests of the products he sells.
To test that hypothesis, the following are instances where I set out to independently test some of the software and products that Equilibrium Tuning sells.
Case 1: EQT software test
The first candidate for testing is the Equilibrium Tuning software for the Mk7 GTI. As part of the Mk7 GTI Tune Comparison, I tested tunes from nine vendors, along with the stock tune.
I ordered the EQT Stage 2 tune for the Mk7 GTI to include in the testing, but EQT cancelled my order.
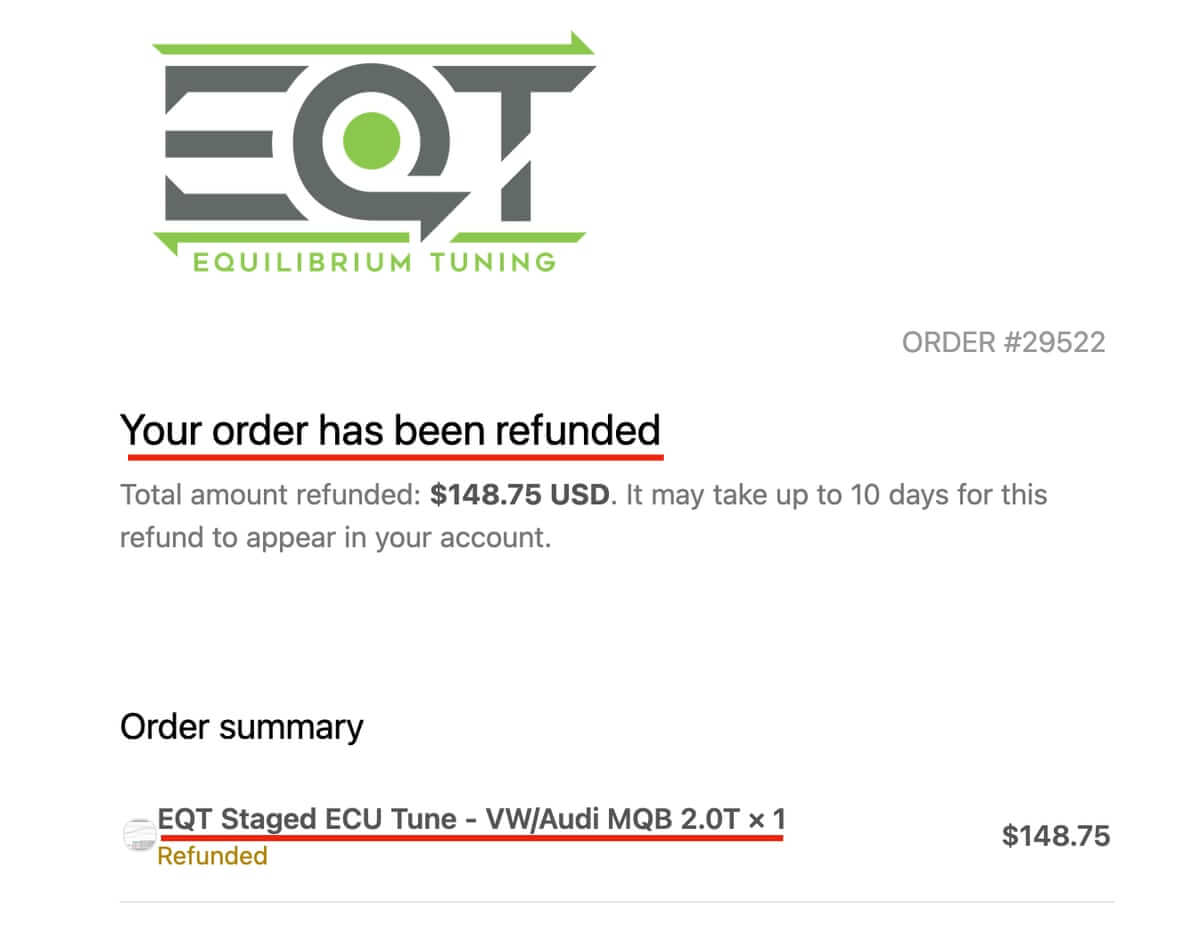
Case 1 outcome:
The evidence suggests that Ed Susman’s claim is false.
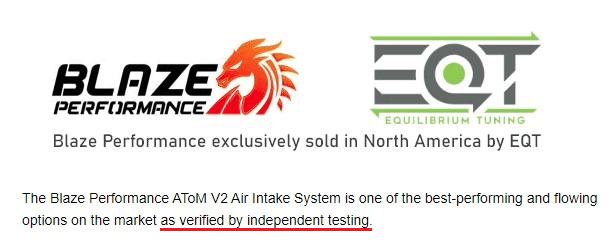
Case 2: EQT / Blaze ATOM Intake Test
The second candidate for testing is the Blaze ATOM intake sold by Equilibrium Tuning. Equilibrium Tuning advertised the product as “best-performing” on the market and “verified by independent testing.”
I placed an order with EQT for the Blaze ATOM to perform street testing with, but EQT cancelled my order.
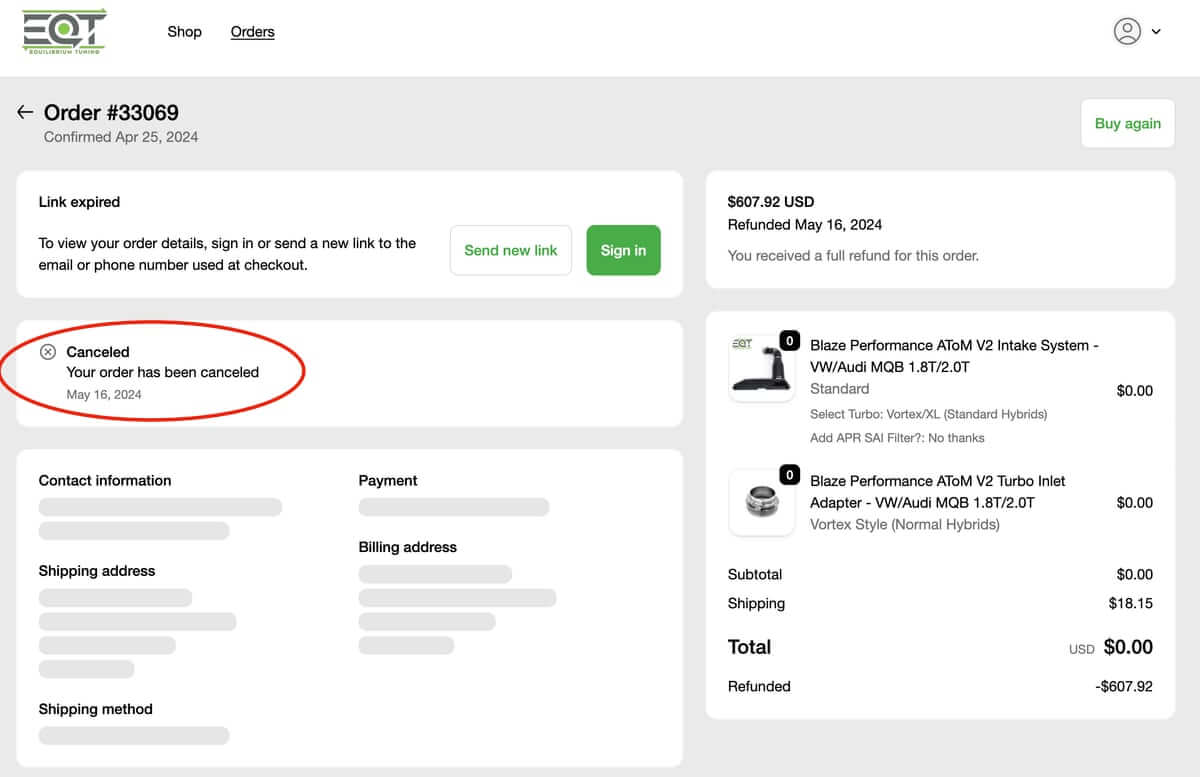
Case 2 outcome:
Additional evidence suggests that Ed Susman’s claim is false.
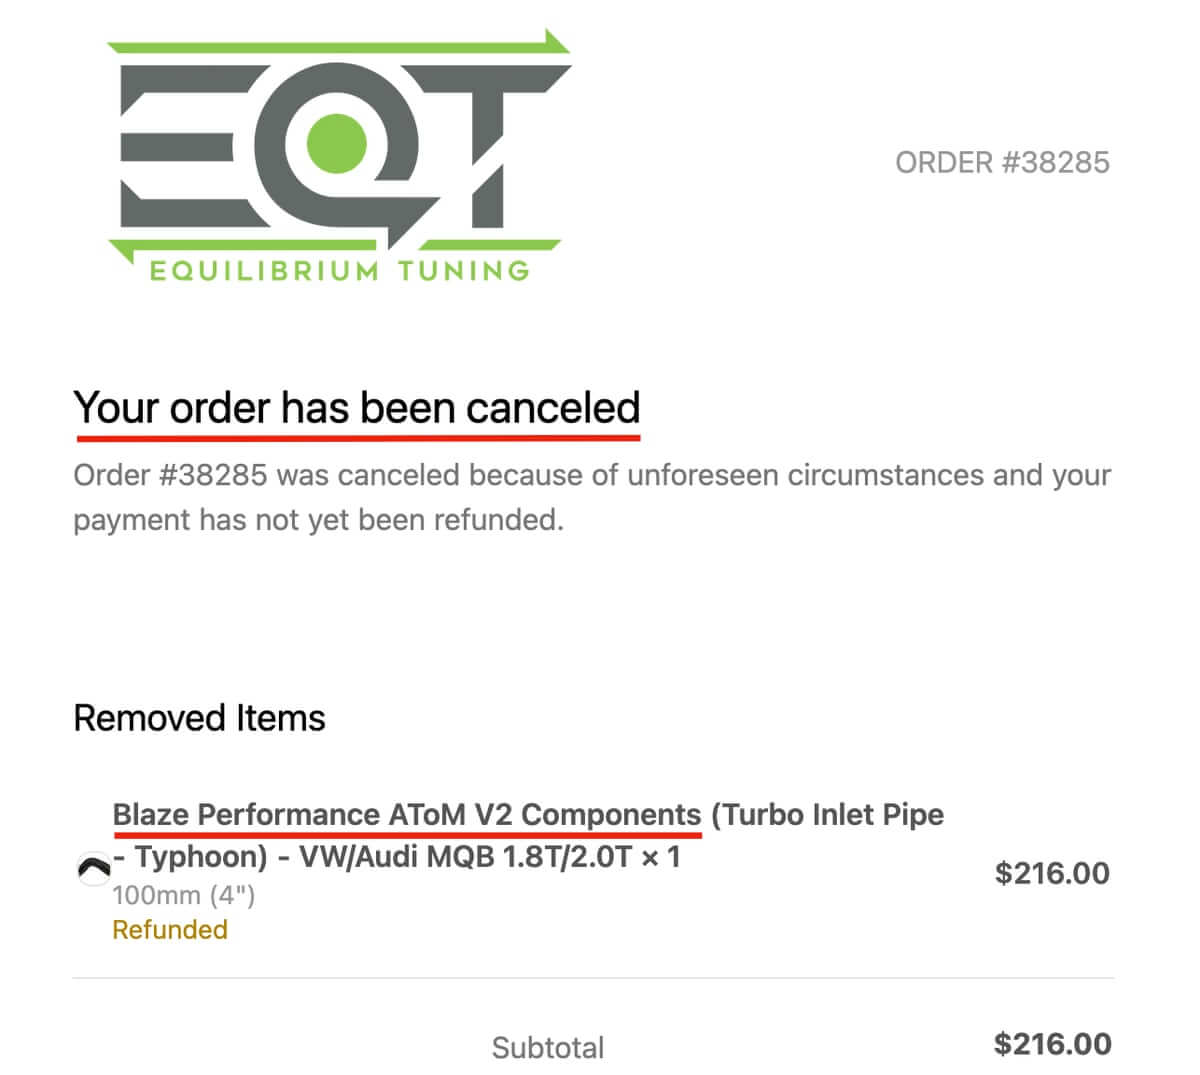
Case 3: EQT / Blaze Typhoon Inlet Hose Test
In a discussion I had with Ed Susman about intake testing, he asked whether I had tested the Blaze ATOM intake using an alternate inlet hose designed for the Typhoon turbocharger.
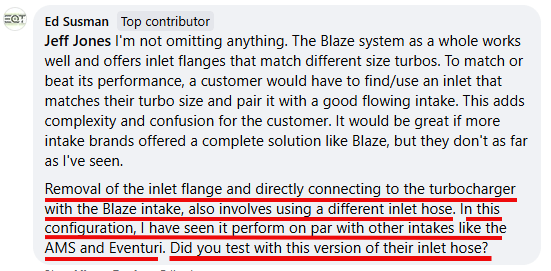
I had not. To address Ed’s concern about my lack of information on the intake’s performance with the alternate inlet hose, I placed an order with EQT for the Blaze Typhoon inlet hose to test.
But EQT cancelled my order.
Case 3 outcome:
More evidence suggests that Ed Susman’s claim to “love seeing independent tests of our software and products” is false.
Evidence Review:

Ed Susman’s claim that “I love seeing independent tests of our software and products” was made in a post in which Ed selectively promoted a favorable example.
Repeated cancellations of orders from a particular tester indicate an intent to control who can test their product or what data enters public discussion.
Likely, EQT may fear negative comparative results and therefore avoid situations where outcomes aren’t predictable.
Conclusions:
Using positive user experiences publicly to build social proof while curtailing formal comparisons appears calculated to benefit sales without subjecting claims to rigorous scrutiny.

Rewrite:
A suggested rewrite of Ed Susman’s advertisement could be:
I love Cherry-Picking consumer testimonials that make our software and products look good.
Ed Susman, owner of Equilibrium Tuning Inc.
References:
Addendum:
The advertising post has some other concerns that consumers should be aware of.
As was already stated, a single dyno pull lacks comparative information. Comparison data is far more useful since the primary value of a dynamometer is to provide insight into relative measurements, not absolute values.
Dyno Correction Factors:
There are two commonly encountered dyno correction factors: the Standard (STD) and Society of Automotive Engineers (SAE) J1349.
The SAE corrects to conditions of 77°F, 29.60″ barometric pressure, and 36% humidity. The STD correction uses a more favorable 60°F, 29.92″, and 0% humidity. SAE also accounts for mechanical losses.
The STD correction, developed in the 1950’s, was meant for small engines less than 20 horsepower. The STD standard was canceled in 1988 when the SAE standard was adopted.
The differences in how corrections are calculated result in STD corrections that are 2-4% higher than SAE.
If you want to instantly improve your results, use the STD correction factors.
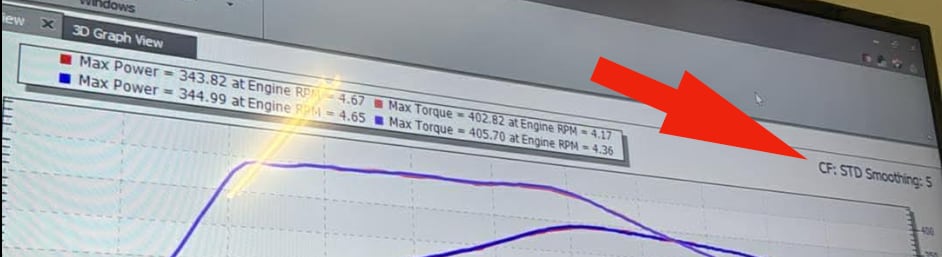
In this case, the more favorable STD correction was used.
When a salesman points to a DynoJet chart and emphasizes the numbers, check which correction factor is being applied.
Dyno smoothing:
Also mentioned in the advertising:
… the curves are smooth and consistent.
Ed Susman – Salesman/Owner Equilibrium Tuning Inc.
The DynoJet WinPep software, which displays the results of the dyno pull, includes a function that allows the user to adjust the amount of smoothing applied to the curves.
The range of values extends from 0 (no smoothing) to 5 (maximum smoothing).
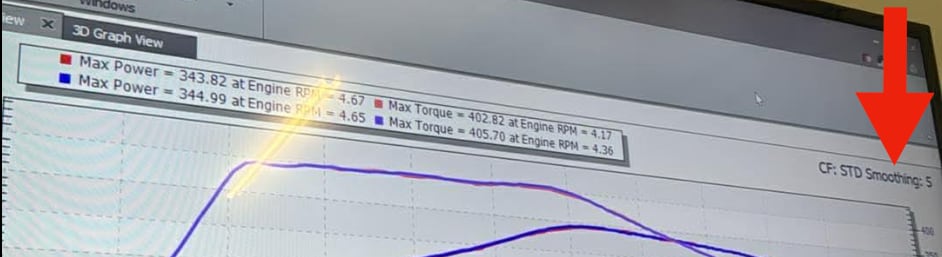
In this case, the maximum smoothing value of 5 was used.
When the salesman points out how “smooth and consistent” the curves are, look to see how much smoothing is being applied to the data.
Dyno conditions:
Conditions in the space where the dyno operates can significantly impact results, particularly air temperature.
In this example, the conditions are not specified, but the number 35 next to the time suggests the dyno may be operating in a room at 35 degrees Fahrenheit. (Presumably, it is not 35 celsius (95 F) since the results are being presented in January.)
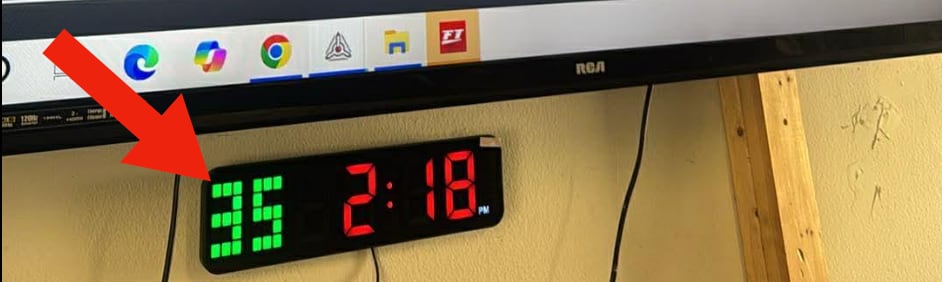
If this is the air temperature, it would help to increase power output.
Takeaway:
The dyno chart posted by Ed Susman shows a single run with max smoothing, the most favorable correction factor, and a cold ambient (~35°F) temperature; all of which can make results look better than they are. There’s no baseline.
Treat this as an anecdote, not proof of repeatable performance.