

Background:
Prompted by a question if I have any results of measuring intercooler external airflow, meaning the ambient air that passes through the core and then onto the radiator, some ideas for measuring this property were considered.
The question arose based on the thought that airflow through the exterior fins may affect the radiator performance and cars that operate at high loads for extended periods of time, such as people who track their cars, might see differences in radiator cooling performance caused by different intercoolers.
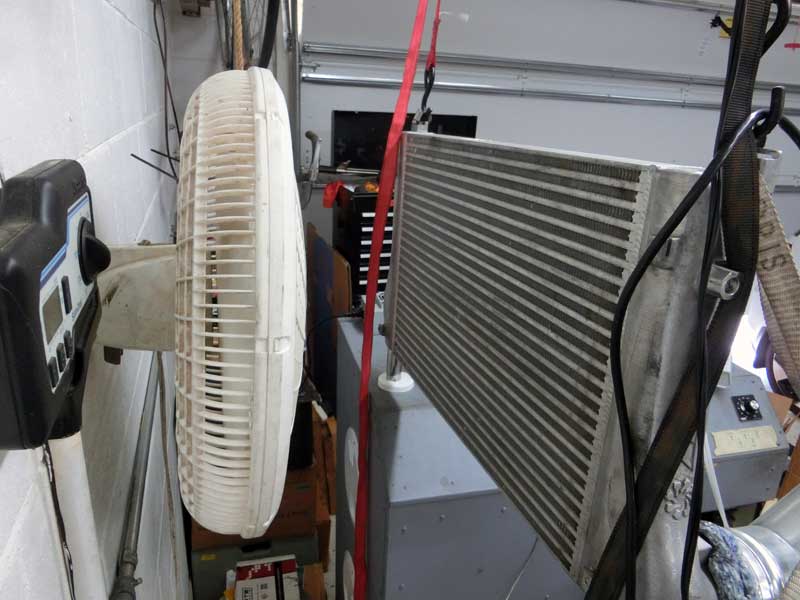
The only experiment I’ve conducted remotely close to this idea was a bench cooling test where a fan is placed in front of the core and operated to cool the core off. When this experiment was conducted I stood behind the intercooler to manage the flow bench. I could feel differences in the quantity of air that passed through different intercoolers, but that was not helpful for answering this question.
Test Approach:
To compare how different intercoolers perform at passing air through their exterior fins I needed a way to restrict airflow to only passing through the core external fins. I also needed a way to measure that airflow. Using the flow bench presented an opportunity to accurately measure airflow, an adapter might allow restricting airflow to just passing through the external fins.
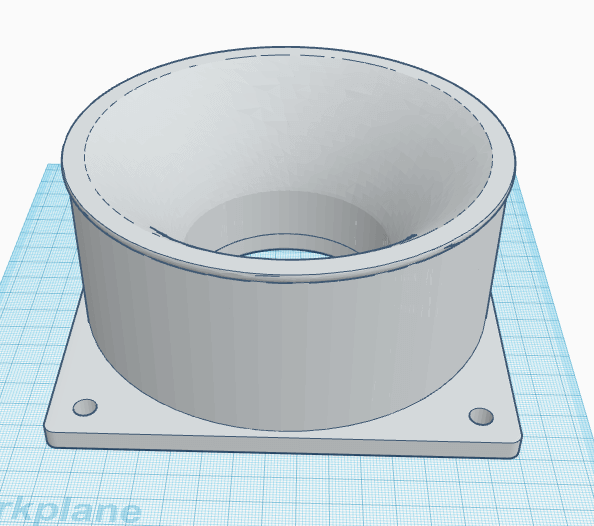
The adapter design has a few requirements:
- Sufficient size to sample airflow across a good “chunk” of the intercooler core. This is a very vague requirement. I decided to use the smallest core dimension of a known intercooler to set the size. Some FMICs have a core height of ~6.5″ and therefore I chose 6″ as the diameter of the adapter’s large opening. This way I would be able to test most of the ICs available for the Mk7, although I only have a couple in my garage.
- Circular in shape where the intercooler meets the adapter. This is an easier shape to build as I can reuse a bellmouth part previously developed.
- High airflow through the adapter with minimal pressure drop. The bellmouth shape should promote high airflow.
- A flat surface where the adapter meets the intercooler so a pliable foam material can sit on the adapter to form an airtight seal between the adapter and intercooler core.
- Material beneath the bellmouth outer edge to support intercoolers weighing close to 30 lbs.
The resulting design is shown below.
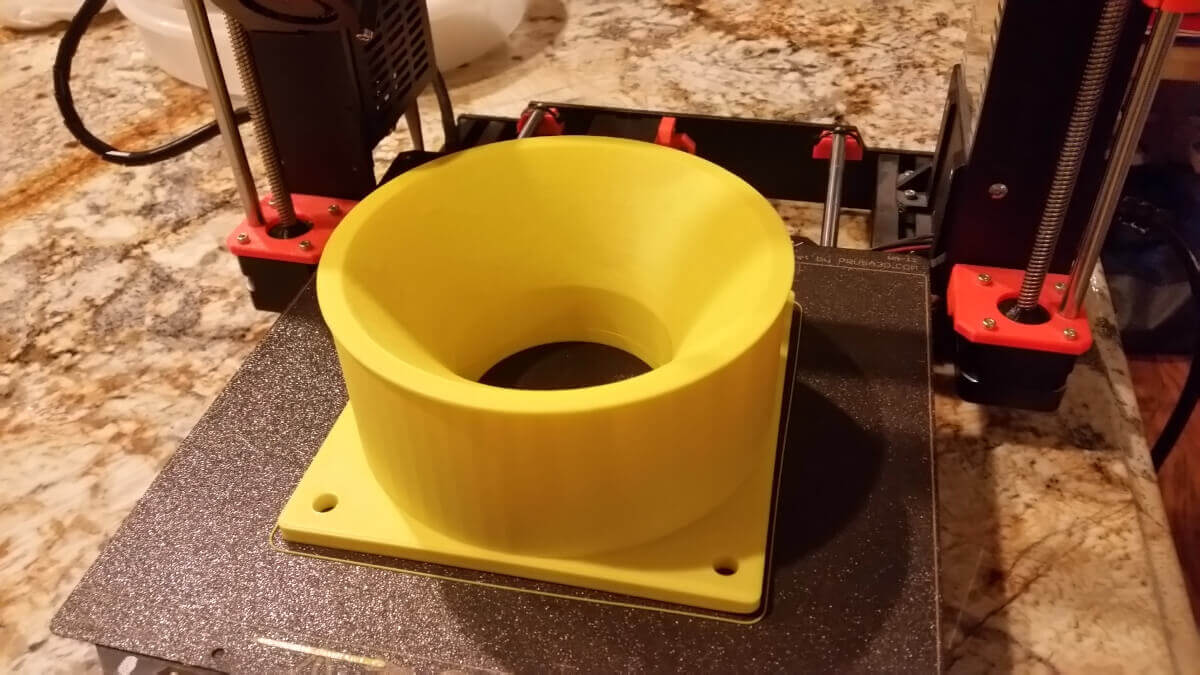
Next, the design was printed and a ring of foam sealant was epoxied to the upper edge of the adapter.

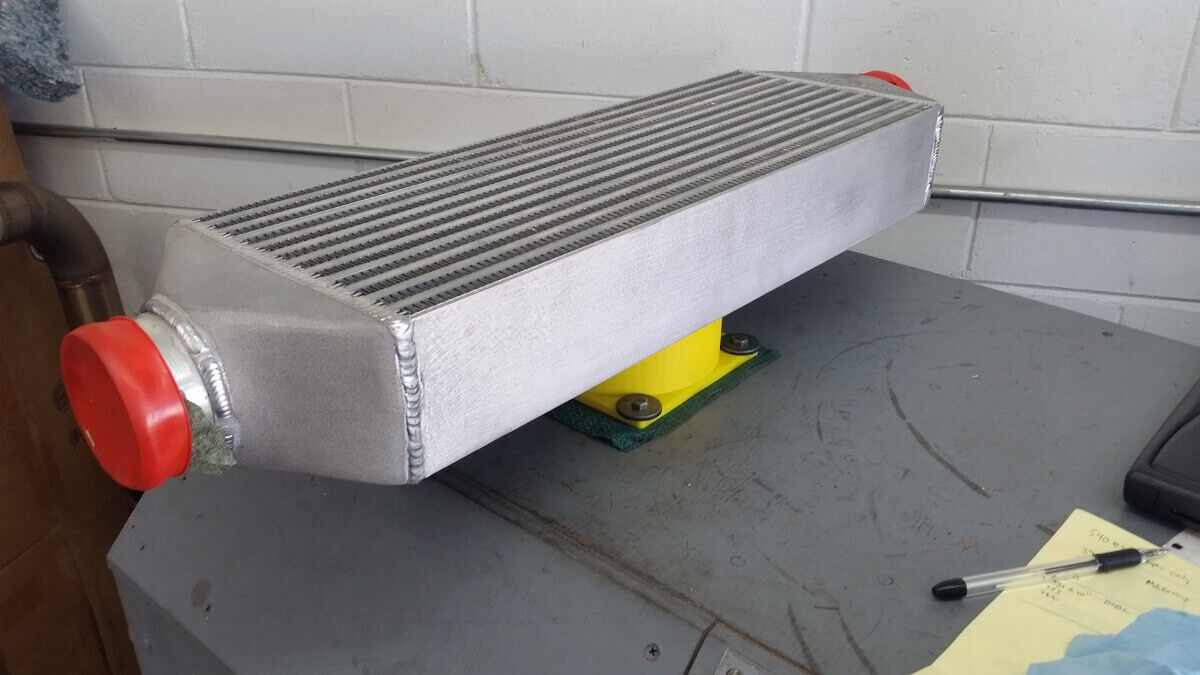
After running a calibration plate on the flow bench the IC adapter is attached and the adapter alone is flow tested.

The adapter flowed 540 CFM @ 9″ of H2O.
The bench can support test depressions up to 28″ of H2O, which would equate to airflow of approximately 950 CFM through the adapter, which far exceeds what the bench motors are able to supply. There was no indication that the adapter would be a significant airflow restriction during this experiment.
Test Process:
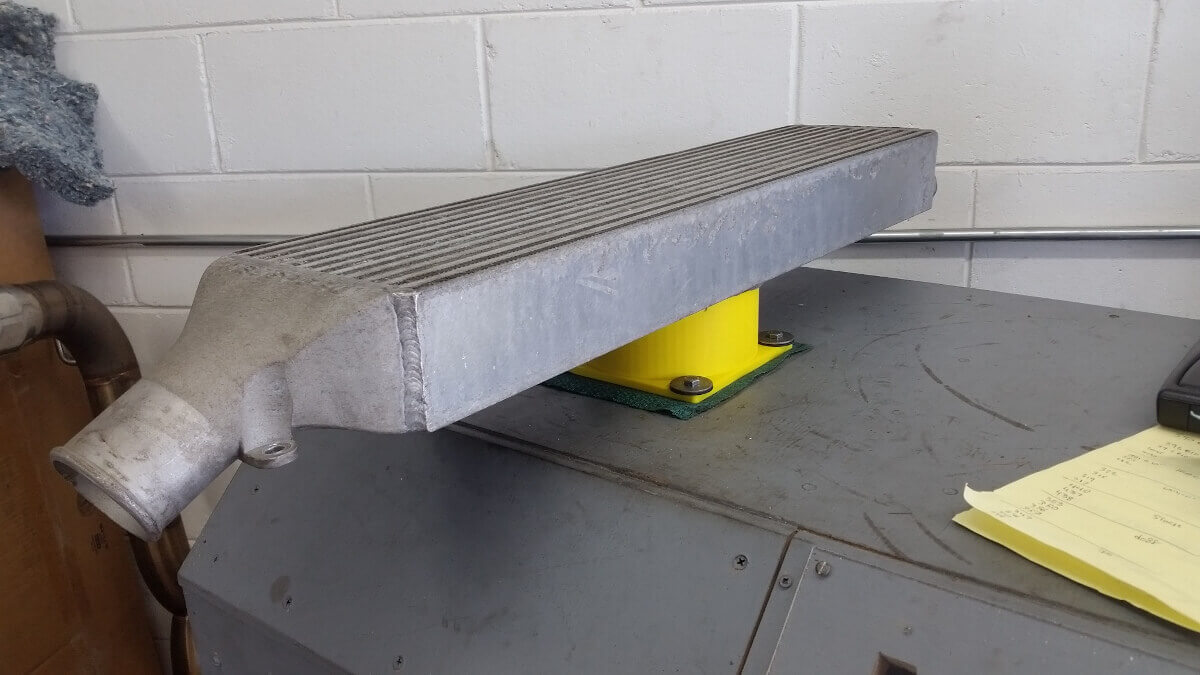
Testing of the available intercoolers consists of setting the intercooler on top of the adapter with the external fins oriented so that air can flow from the surroundings, through the intercooler external fins, and through the adapter into the flow bench. This will produce a measure of the intercooler external airflow.

The weight of the intercooler, along with the vacuum generated by the flow bench, maintains the seal at the foamed edge of the adapter.
To mitigate the placement of the intercooler affecting the airflow reading, after the measurement is taken the core is rotated several degrees and the test is repeated. This rotation is repeated a second time to generate three readings. If any of the successive readings exceed the margin of error, +/- 2 CFM, then the intercooler is rotated a third time to obtain a fourth reading.


The rotation is being done to mitigate the influence that the charge air row might have on the airflow reading. If a solid charge air row covers the adapter opening slightly more during one test run versus another, the multiple rotations and runs should result in a reliable average.
Based on the airflow and depression observed during the first intercooler test a depression of 10″ of H2O was selected to use for all test runs.
Both an average and median were calculated for each intercooler data set. None of the test articles had a difference in median versus average values that were greater than 0.5 CFM – no outliers were influencing the average. Because the difference is negligible only the median reading will be referenced for the remainder of this post.
Test Results:
Tested first was the Majesty FMIC (thicker version aka V2) which is used as a bicooler.
The Majesty median flow is: 398 CFM @ 10″ of H2O.
Tested second is the Treadstone TR8C FMIC 22″ length version.
TR8C median airflow is: 382 CFM @ 10″ of H2O.
Next is the Neuspeed FMIC:
Neuspeed median airflow is: 251 CFM @ 10″ of H2O.
Next is the stock Mk7 GTI intercooler.
Stock GTI median airflow is: 438 CFM @ 10″ of H2O.

Next is the Unitronic intercooler.
The Unitronic median airflow is: 318 CFM @ 10″ of H2O.

Next is the do88 intercooler.
The do88 median airflow is: 355 CFM @ 10″ of H2O.

Last is the Integrated Engineering v1 intercooler.
The IE v1 median airflow is: 347 CFM @ 10″ of H2O.

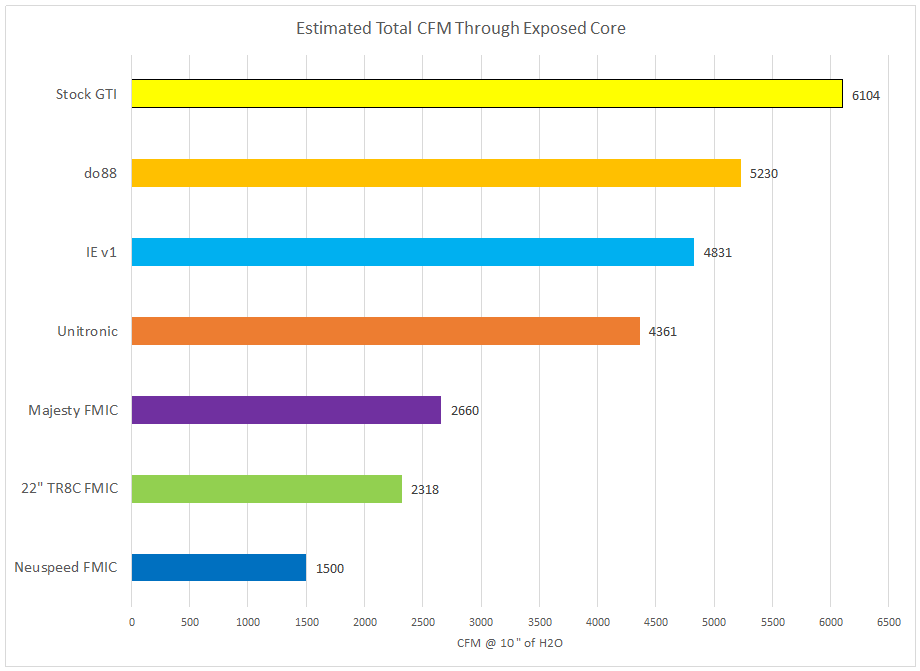
The median airflow recorded for each of the intercoolers is shown in the bar chart:

The next chart accounts for the frontal area of each core. The core height multiplied by core width determines the core area. This is multiplied by the core flow rate per square inch. The core flow rate per square inch is the flow rate from the first chart, divided by the adapter area, approximately 28 square inches. This produces an estimate of the total airflow through the core.
Conclusions:
Several intercoolers available for the Mk7 GTI were subject to a test to measure airflow through the external fins. An area of approximately 28 square inches was evaluated to determine how much airflow would pass through the intercooler fins at a test depression of 10″ of H2O.
Airflow measurements ranged from a low of 251 CFM to a high of 438 CFM.
The motivation for the test was to obtain information that may help with understanding the effect that intercooler external fins have on the Mk7 GTI radiator performance under sustained loading conditions.
If the goal is to support the maximum amount of airflow reaching the radiator, the measurements from this test point to the stock GTI intercooler as the preferred product.
This test does not account for a number of contributing factors, one being that some of these intercoolers are front-mounted.
Note: Thanks to Tony M. for posing the question.
I thought the main question being ask was whether a front mount or stock location had more impact on the overall flow through to the radiator.
The discussion I had was concerned more with stock location ICs. I tested the FMICs because I have access to a couple and I wanted to know how they measure. I don’t think this is going to add much insight to the debate on FMIC vs SMIC effect on radiator performance.
Thanks Jeff! (I’m the one who posed the question). For FMIC vs OE location flow differences, that would really require manometers installed in the grille and under hood to see which generates the lower pressure difference. I am primarily only interested in stock location for track duty personally. I’ll take 20-40F over ambient IATs in exchange for not risking overheating the coolant or oil. Most who track run stock location because of externally mounted DSG and engine oil coolers as well, which is an option I’d like to remain open.