
Background:
Presently I have an IS20 turbocharger installed on the GTI and I’ve swapped a few parts to see what change, if any, there is in the vehicle’s performance at the boost level that the IS20 supports.
The most recent swap is between the aFe Power Blade Runner charge pipes and the stock GTI charge pipes.

Test Procedure:
The effect of the charge pipes on vehicle performance is most likely to arise under conditions where the airflow rate into the engine is increased. For this reason, the focus of this test involves operating the GTI at full throttle.
Full-throttle acceleration is made in third gear starting at an engine speed of around 2,000 RPM and concluding at an engine speed of around 6,500 RPM.
This full-throttle acceleration is repeated several times to support the averaging of the data samples.
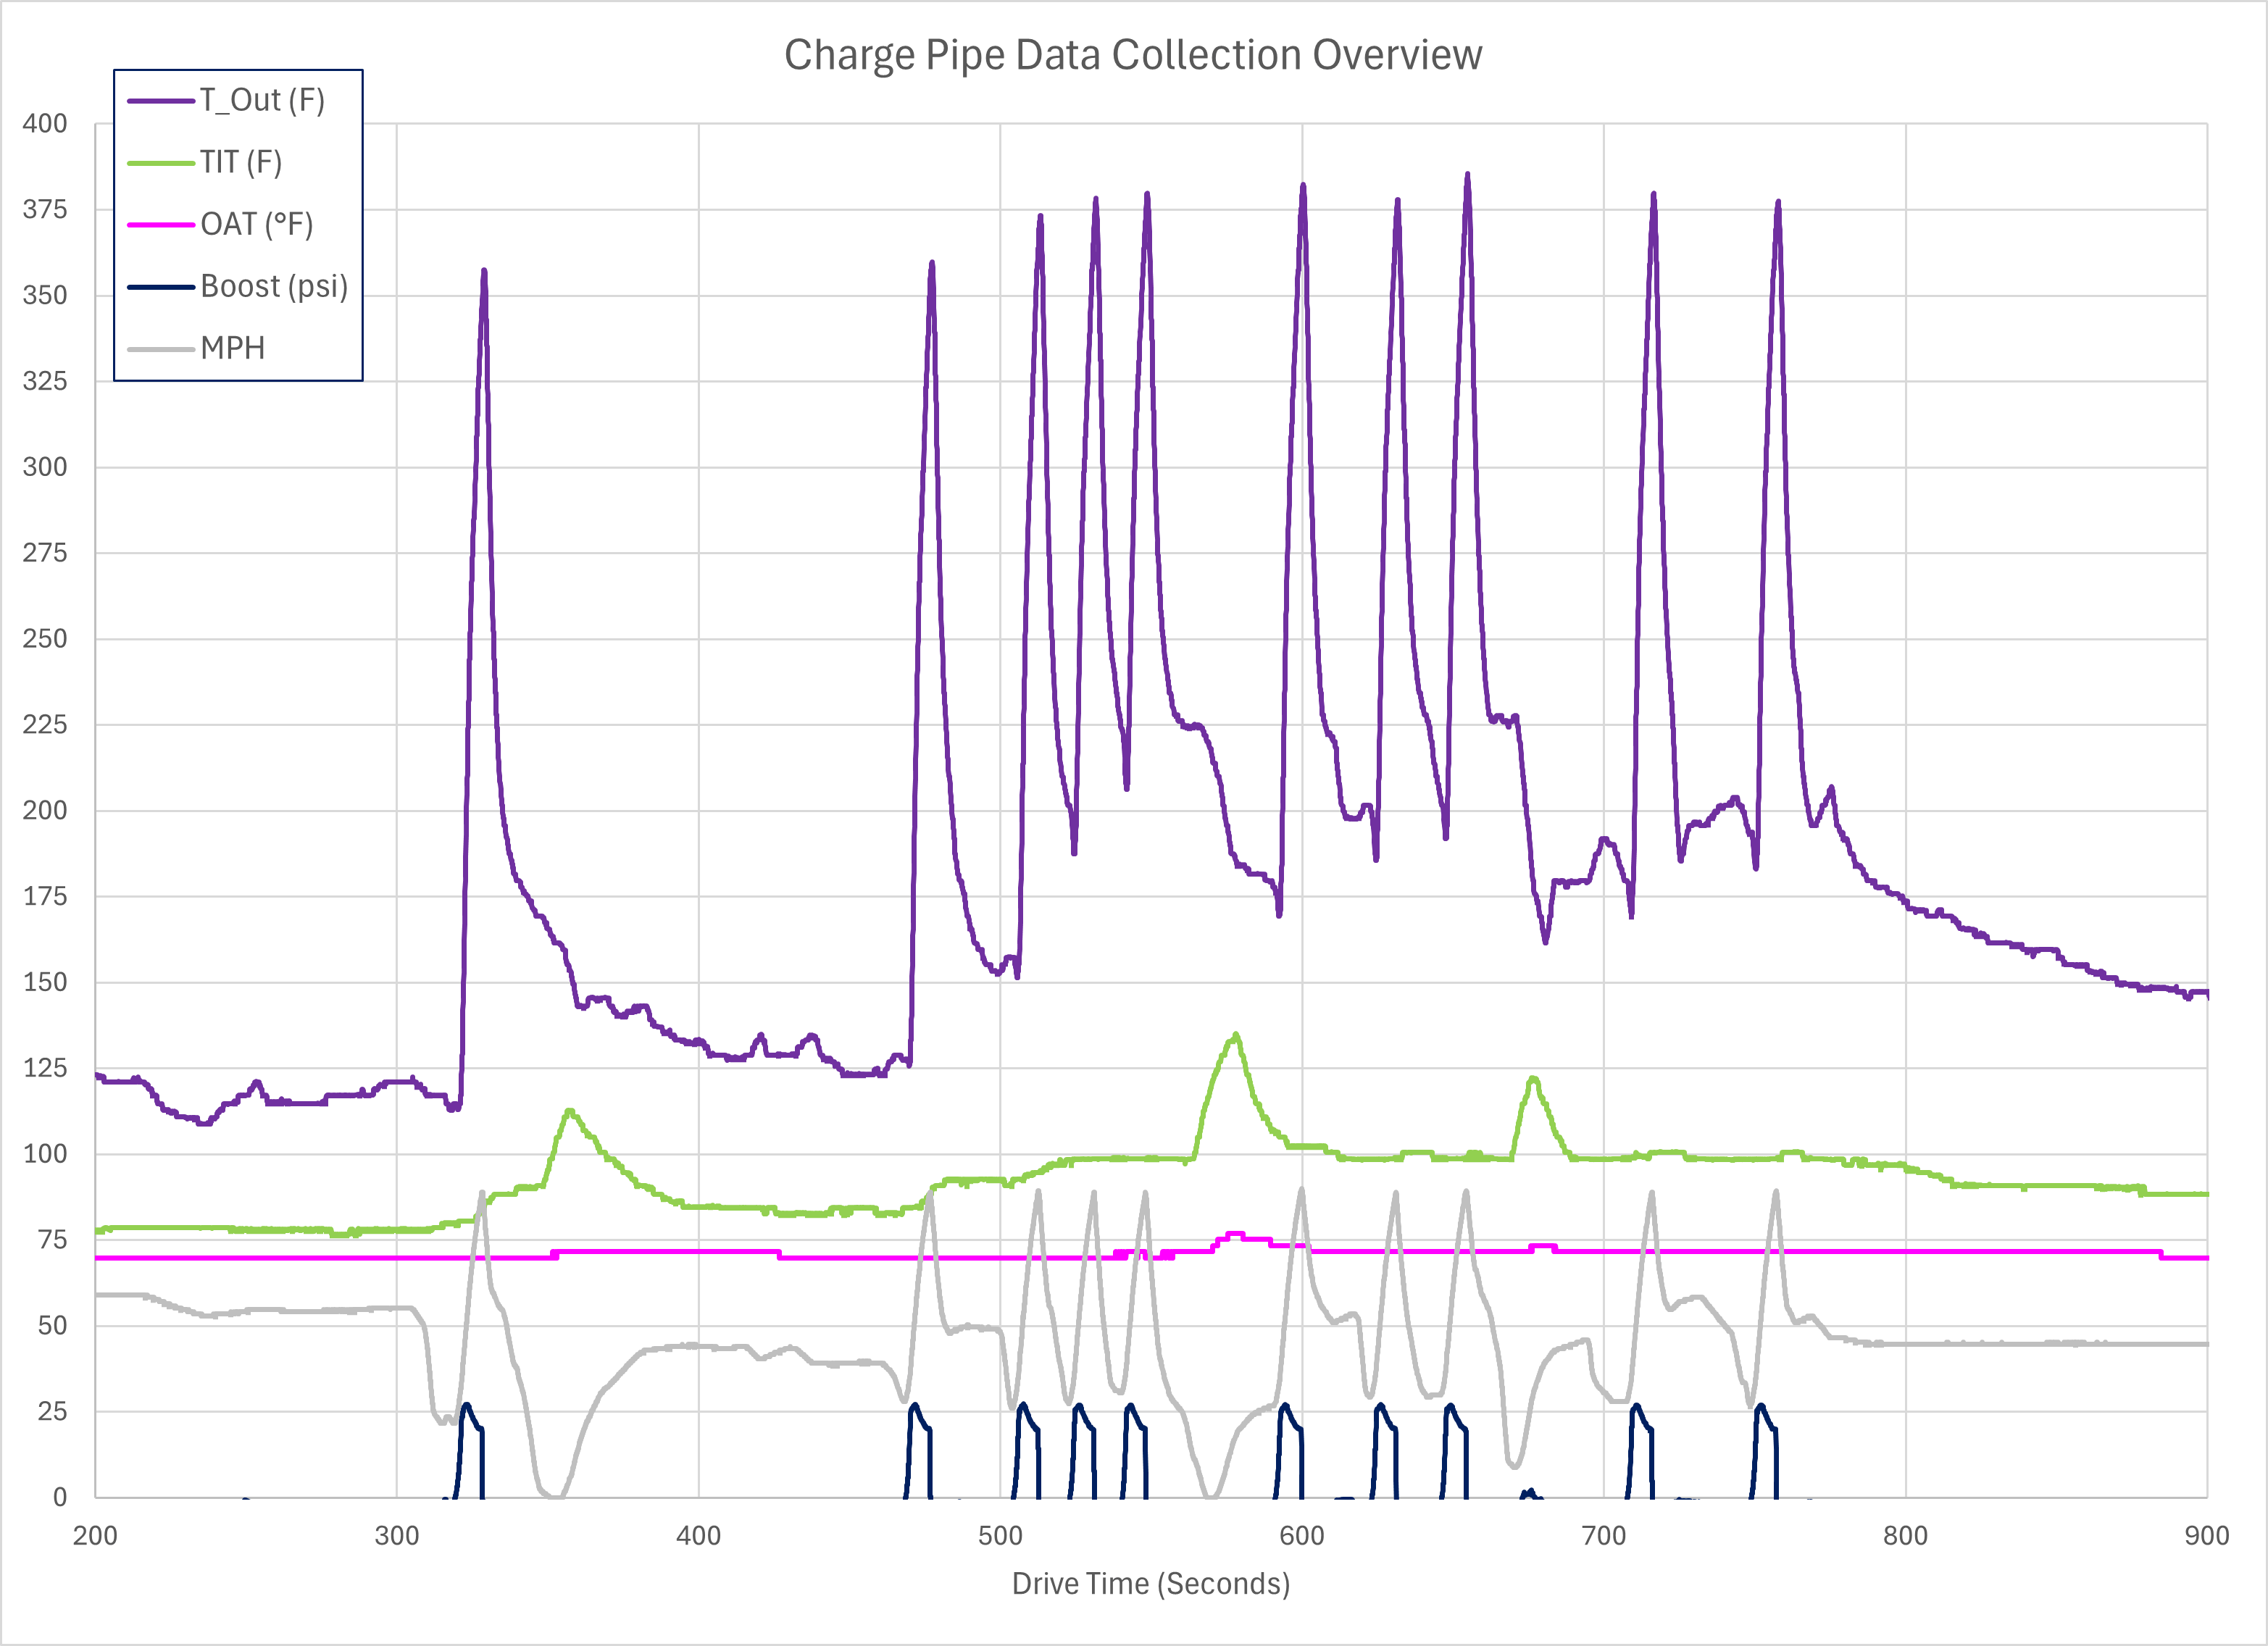
Vehicle engine operating data is logged using a Cobb Accessport and a DATAQ DI-149 data logger that is connected to external sensors.
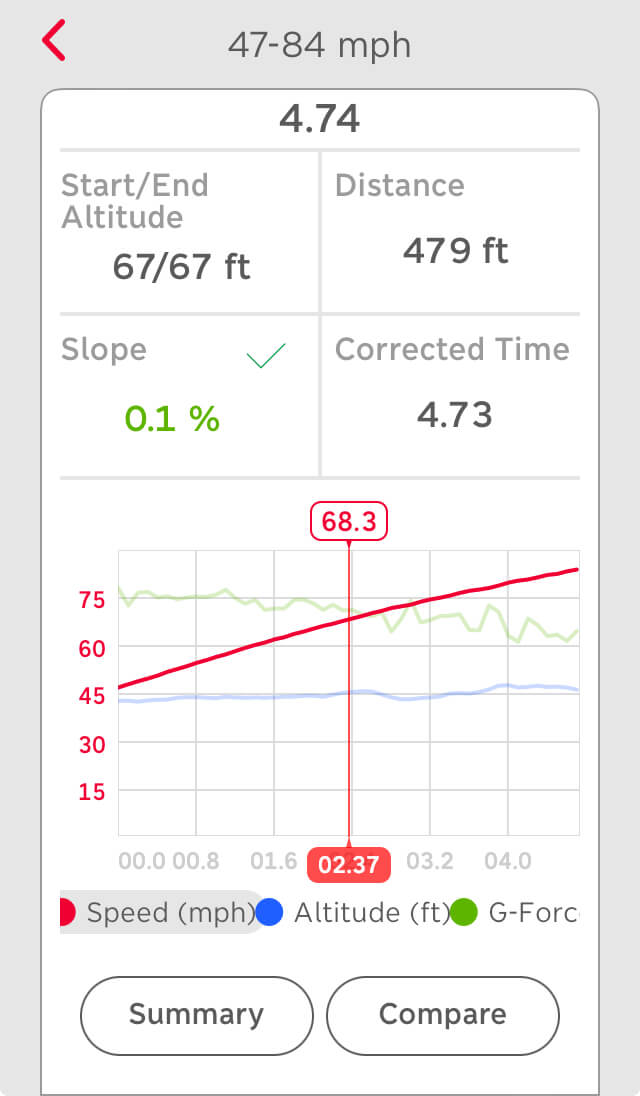
The vehicle acceleration from 47-84 MPH is recorded using a Racebox logger.

The Racebox has become my preferred device for recording acceleration data on account of the software incorporating a slope correction that is absent from the Dragy data logger.
Both Dragy and Racebox will report if there has been a slope change over the extent of the recording, but Dragy will not correct the acceleration time for the slope change whereas Racebox will do this.
Note: The location where I record street data has little slope change, well under the Dragy “Invalid” cutoff of 1%.
Test Results:
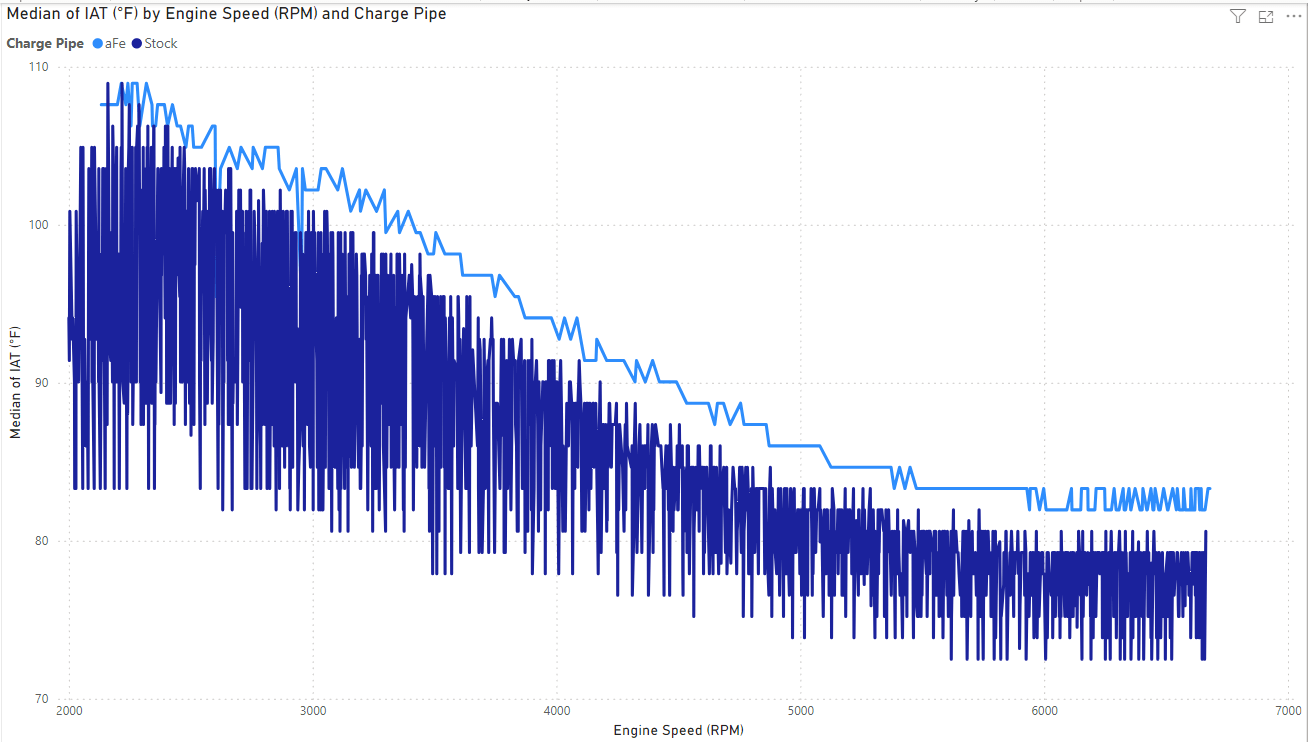
The first chart below shows an example of a data collection session.
The first comparison is of the 47-84 MPH acceleration times.
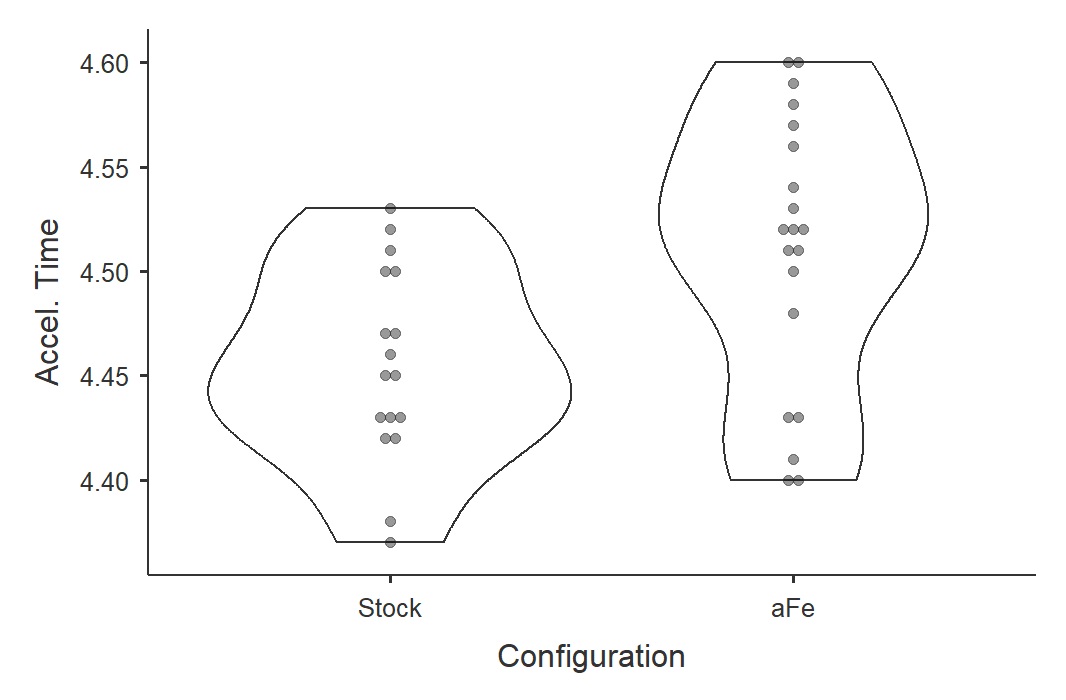
Surprisingly, the samples using the stock charge pipes are slightly faster than with the aFe Power charge pipes.
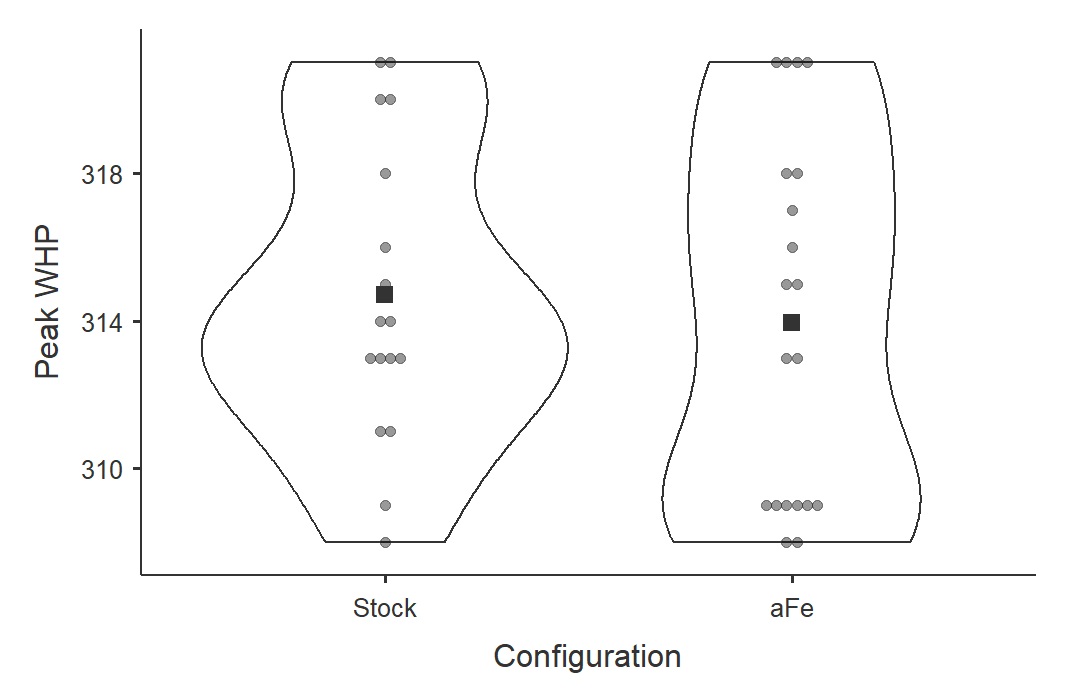
The next comparison is of the Virtual Dyno estimated Peak WHP. Here the values are very nearly the same.
Note: Both acceleration time and Peak WHP are evaluated because the acceleration time is a broader measure spanning lower RPM (lower airflow) to higher RPM (higher airflow). Pressure loss effects are more likely to occur at higher airflow rates, thus the Peak WHP measurement may show a statistically significant affect that the Racebox acceleration time does not.
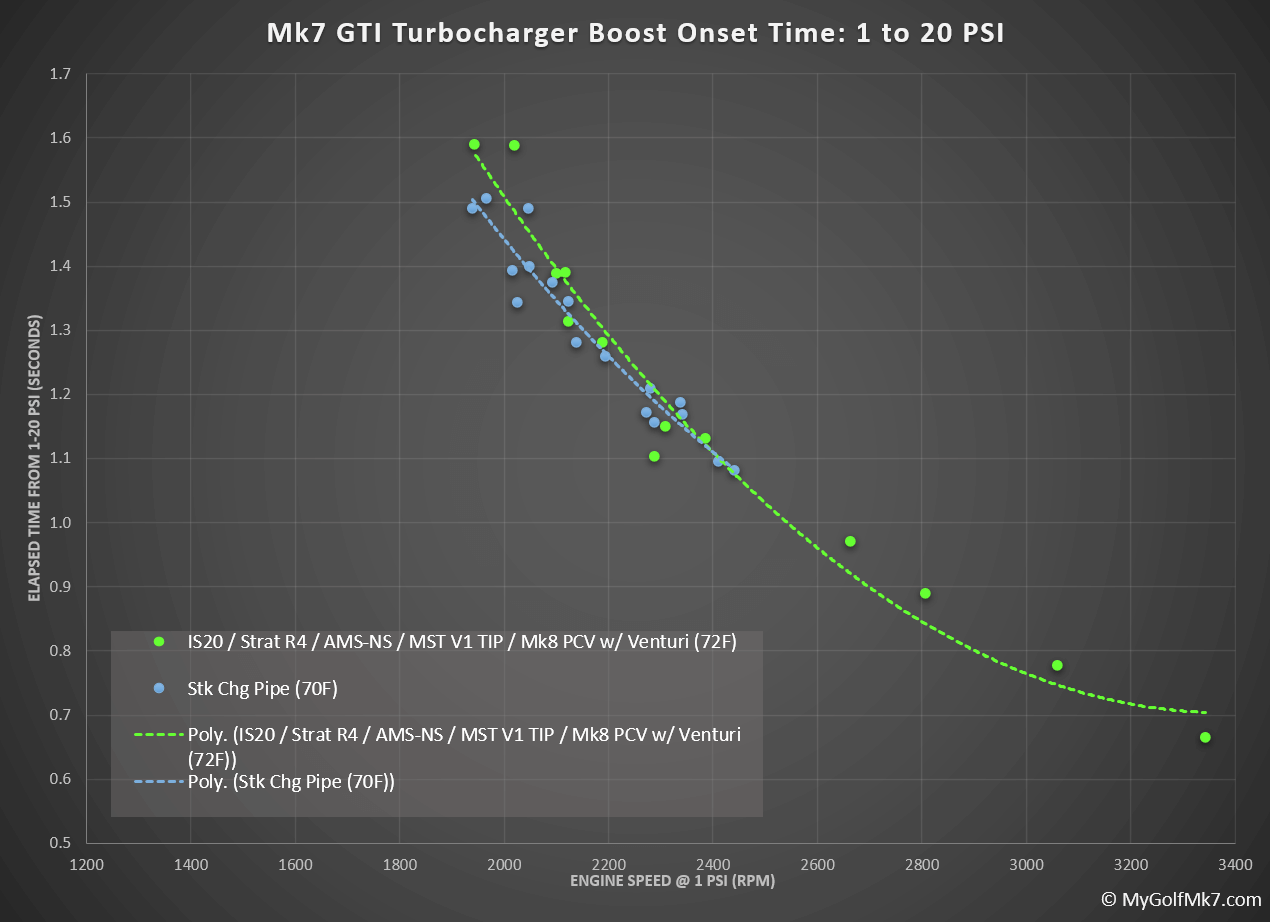
Next is a comparison of the time for boost pressure to build using each charge pipe. No significant difference is found.
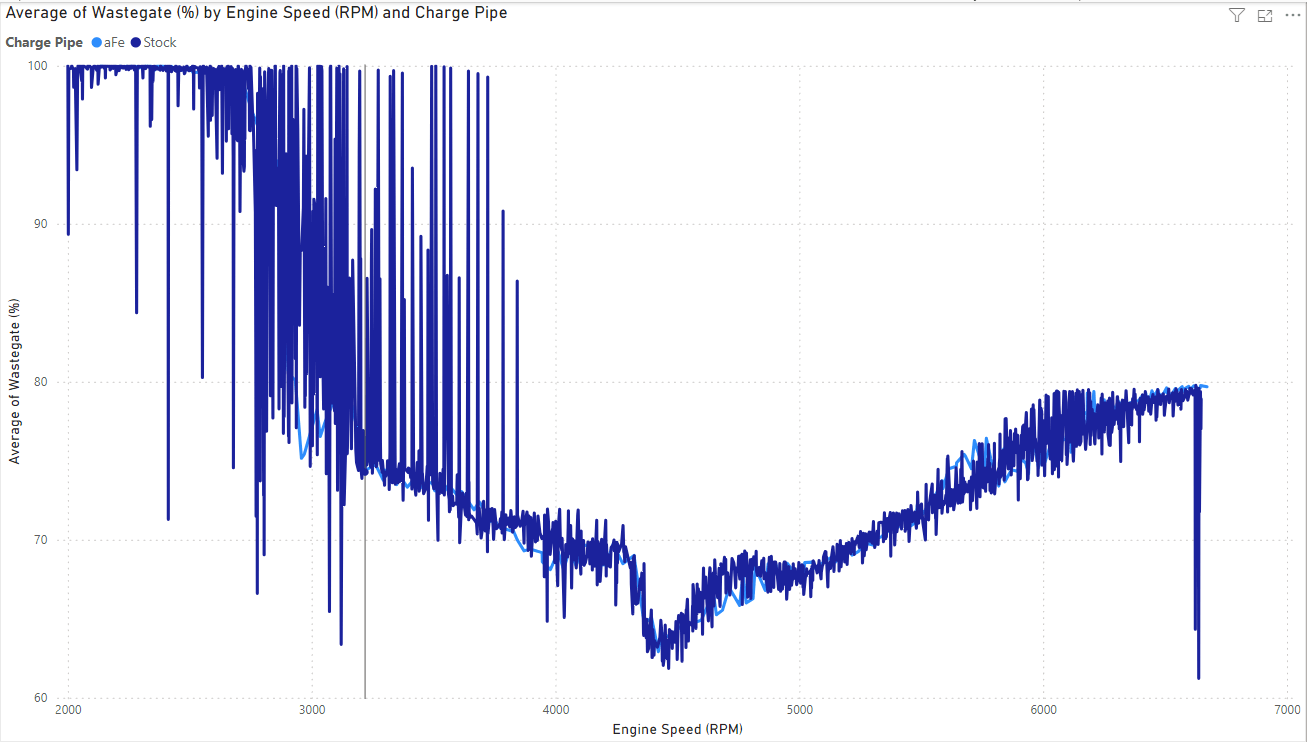
The next chart compares the average turbocharger wastegate duty cycle for each case. Here no significant difference is found.
Data Check:
Confidence in the sample measurements is checked for the acceleration times.
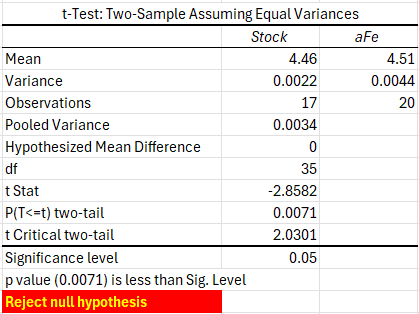
The mean difference in acceleration times is 0.05 seconds, and surprisingly this is a statistically significant difference. The hypothesis that the mean acceleration times are the same using the different charge pipes is rejected.
Note: Even though the difference in acceleration time is statistically significant, the contribution of confounding factors, such as Intake Air Temperature (IAT), cannot be discounted.
The next check is to estimate if enough samples were recorded to support the desired power level of the acceleration comparison. Not quite.

A minimum of 19 sample pulls for each setup (stock and aFe) should have been recorded.
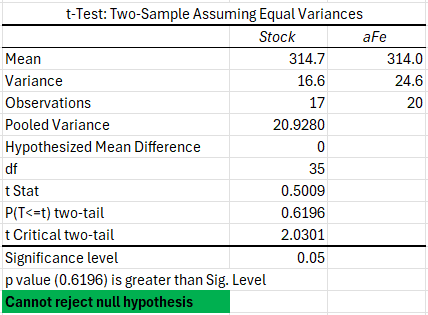
A comparison of the peak WHP values shows there is no statistically significant difference between the two setups.
As mentioned above, other factors like IAT cannot be ruled out from contributing to the outcomes.
A comparison of the IAT above ambient temperature at 6,000 RPM shows that the two test cases had similar mean temperature values with more variability during the aFe session.
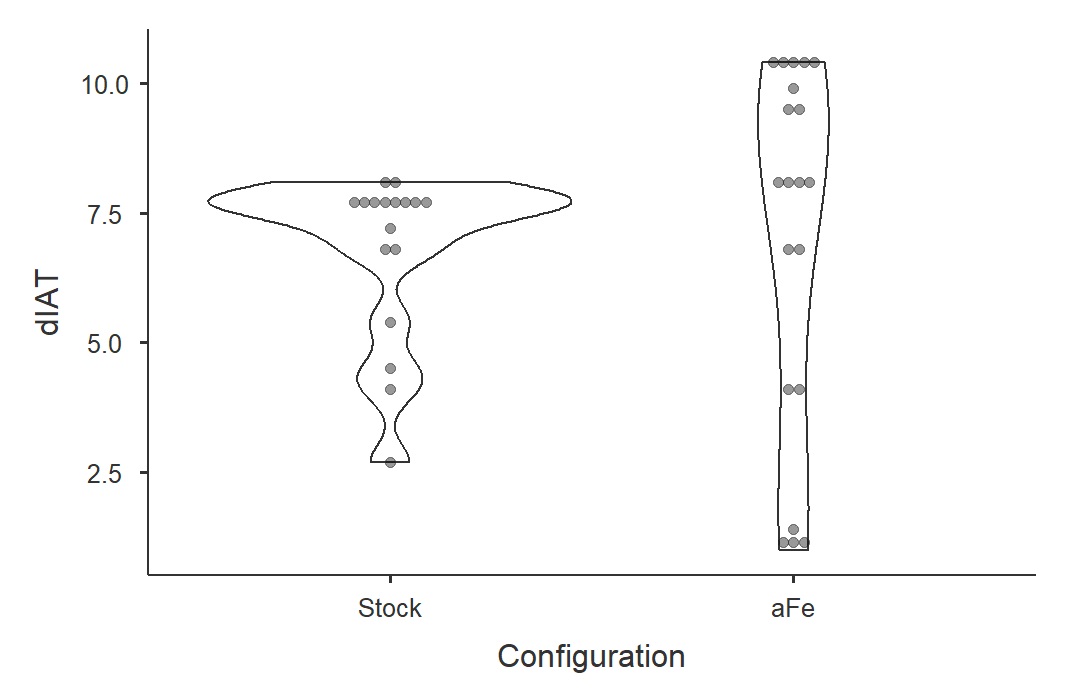
A look at the average IAT for the pulls, 17 stock and 20 aFe, shows that the aFe pulls had a slightly higher average IAT.
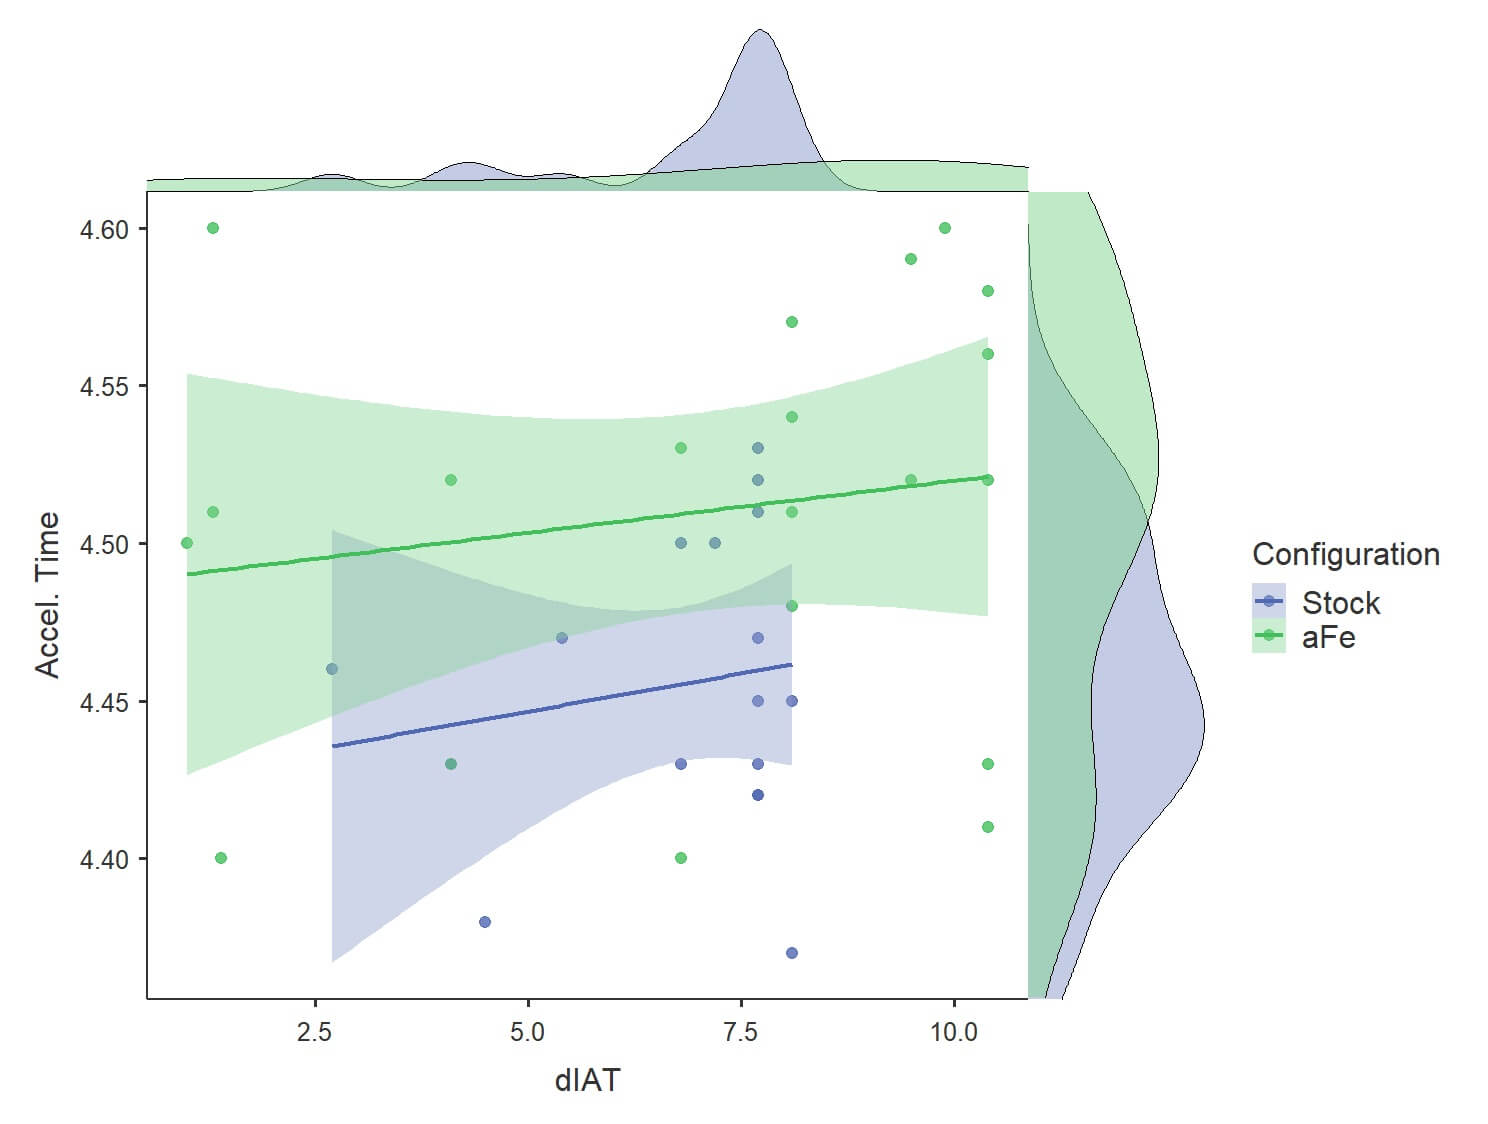
Below a scatter plot of the acceleration time versus IAT delta above ambient shows a similar trend for the two cases, with higher dIAT correlating with longer acceleration times.
Notably the stock charge pipe case has a greater proportion of pulls with a dIAT around 7.5 degrees Fahrenheit. This is shown in the dIAT chart as well (two charts up).
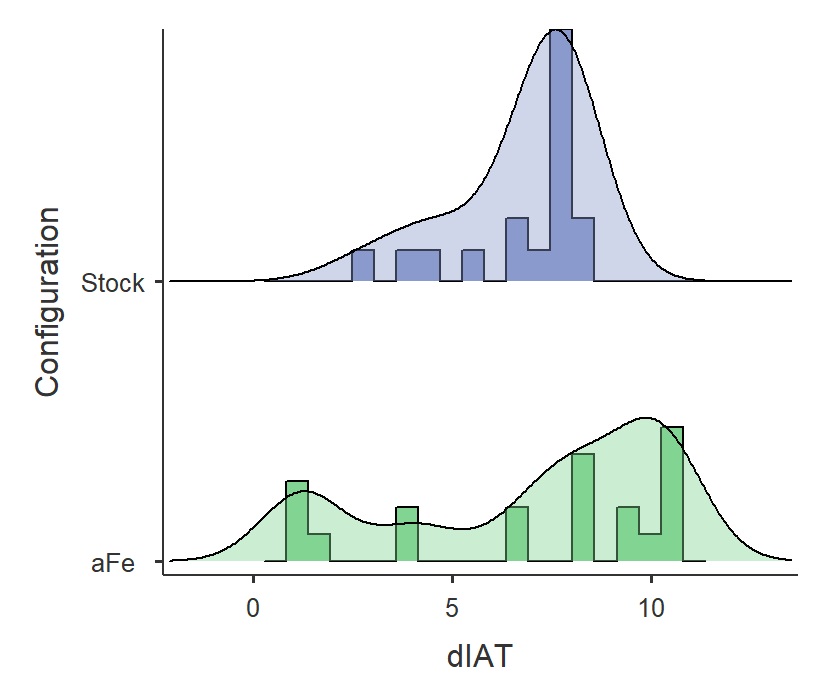
Looking at a histogram of the data points it’s clear that the stock charge pipe dIAT is concentrated around 7.5F with almost no data points any higher.
In contrast, the aFe case has several samples grouped around 10F.
Given the very small difference between the acceleration times, and the higher proportion of aFe pulls with a dIAT above 7.5F, it seems likely that the IAT factored in the statistically significant difference in acceleration times.
Conclusions:
The Mk7 GTI stock charge pipes were compared with aFe Power Bladerunner charge pipes on a Mk7 GTI equipped with an IS20 turbocharger.
Measurements were made of vehicle acceleration, boost pressure onset, and turbocharger wastegate duty cycle along with peak WHP estimates from vehicle acceleration data.
When accounting for likely contributions from differences in the intake air temperature (IAT) there were no significant differences in the vehicle performance using either of the charge pipes.
Thanks for this
You’re welcome!