Pressure drop across the core of an Intercooler can be a significant aspect of intercooler performance due to the impact it can have on turbocharger and engine operation. It also provides a useful metric for comparing performance among multiple intercoolers when trying to select one.
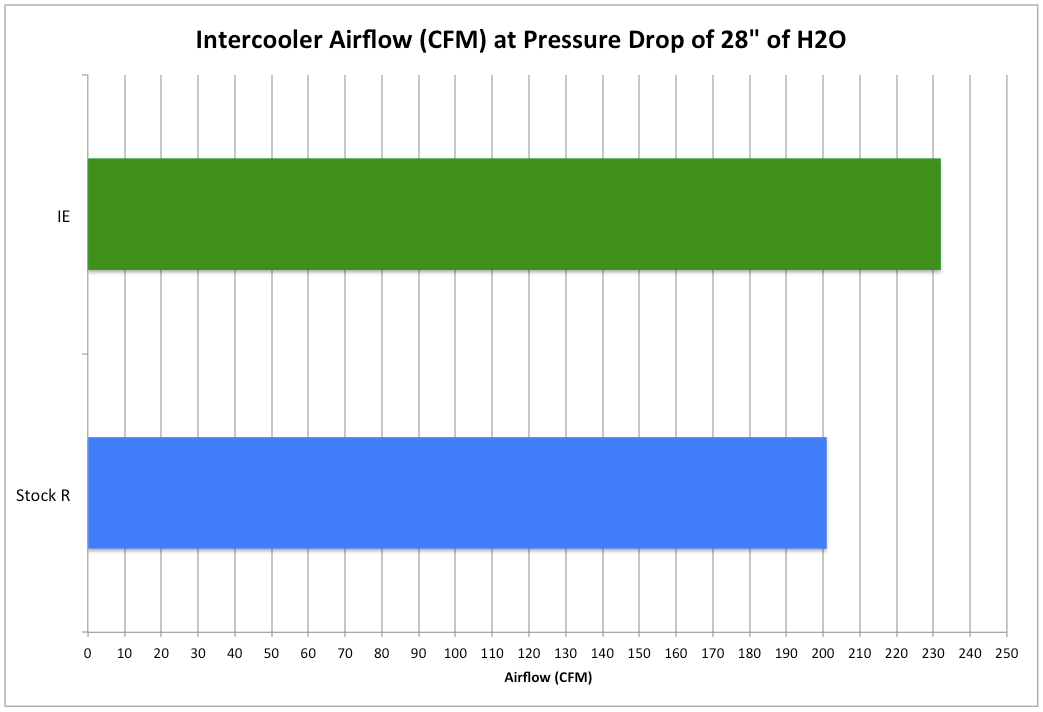
Previously the pressure drop across a stock Golf R IC and Integrated engineering IC were estimated based on information published by Integrated engineering.
The results from that numerical analysis are shown below:

Setup:
For this test the pressure drop across an eBay front mounted intercooler for the GTI/R is to be measured directly by means of a flow bench.
The flow bench gives an advantage of well controlled, repeatable test conditions that give good indication of relative performance between test objects.
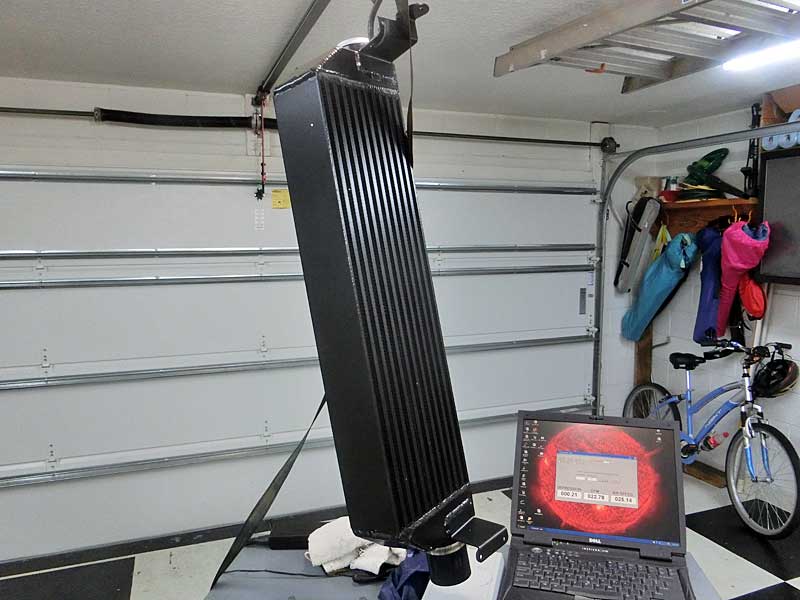
To try and minimize the influence of inlet and outlet couplers on the IC test performance a pair of short, straight, silicone couplers were attached to both sides of the intercooler. One was used to attach the FMIC to the flow bench on one end and the other had a velocity stack attached to minimize the influence of edge induced turbulence of the air going into the core.

The intercooler had to be strung up vertically in order to test with the straight coupler hose. The core is shown above prior to aligning it to the flow bench intake.
Results:
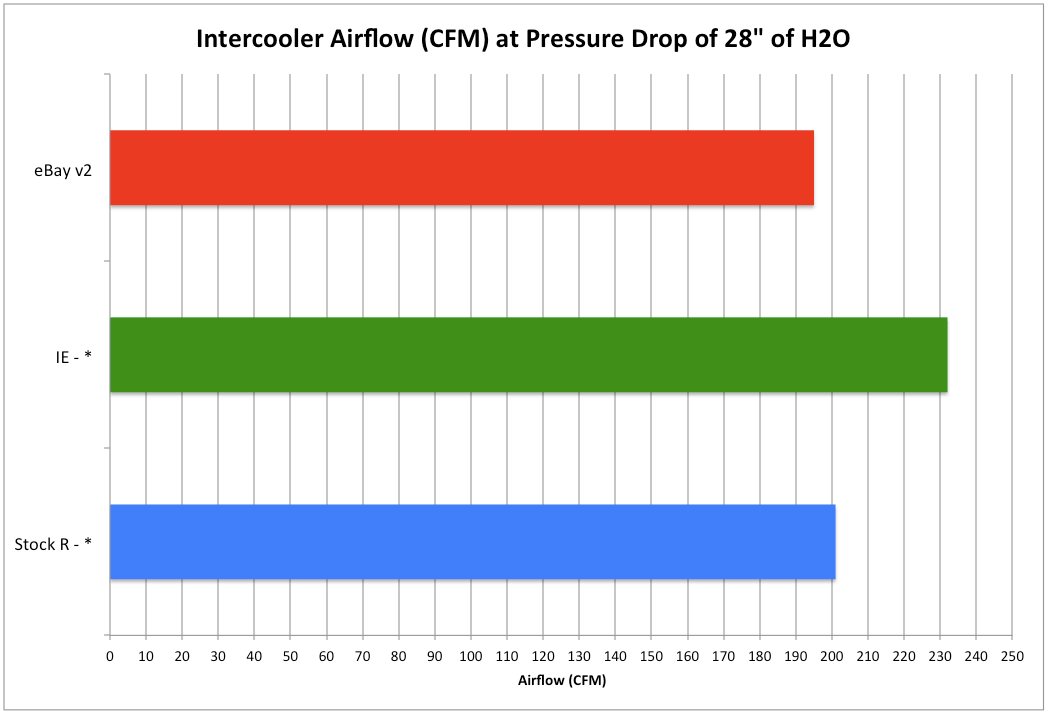
Running the flow bench up to 28″ of H2O and taking a few readings at different depressions produced the following airflow versus pressure drop curve.

This result can be combined with the estimated results from the Integrated Engineering analysis to produce the following comparison:

It is worth repeating that the values shown above for the Golf R and Integrated Engineering intercoolers are estimates and it is likely that if they are eventually measured that the measured airflow will be different than as shown above.
Conclusion:
The results of the comparison show that the Integrated Engineering direct fit intercooler should flow more air at an equivalent pressure drop.
A simple cross check of these results can be done by comparing some of the physical properties of the three intercoolers. The airflow through each core is significantly effected by the charge air passages, the space through which the air flows. An estimate of this area based upon the number of charge rows, depth of each core, and estimated charge row height yields flow areas as follows:
- IE: 8.9 sq. in.
- R: 7.9 sq. in.
- eBay: 7.8 sq. in.
This is a VERY rough estimate, but with the cross sectional values corresponding to the airflow results this gives more confidence that the relative performance shown in the chart is correct.

If you want, I can throw an IE intercooler on our flow bench and provide you data in this format. We chose the engine RPM correlations because we felt it was more tangible and easier to relate to for most customers.
FDS temperature distribution graphs were done on our engine dyno so that we could instrument the intercooler in that fashion. Pressure drop and IAT graphs were done on the chassis dyno. 🙂
– Pete @ IE.
I would be interested in seeing the results you obtain from measuring with a flow bench. I have a couple other intercoolers I plan to flow test and having additional information collected in a similar fashion would be useful.
-Jeff