Background:
This is third and last planned test of a turbocharger blanket using my Mk7 GTI. Prior testing looked at the affect of the blanket on boost onset and temperatures in the engine compartment during the boost onset testing.
This test is an additional investigation of the blanket affects on temperatures, but the time duration of the testing period extends longer than during prior testing.
Test Procedure:
Sensor locations are unchanged from the previous test and are as described in the test plan.
The GTI is operated on a loop drive that consists of approximately 11 miles of in town driving that includes a number of stop light intersections where the car is stationary longer than momentarily. This is the red line portion of the drive on the picture.
A mid-point is reached and the car is shut off for approximately one and a half minutes. The car is started again and a return route of approximately 13 miles is followed which begins with in city driving and transitions to more open suburban roads that allow more steady state driving. This segment is the green line on the picture.
In total the route takes approximately 54 minutes to complete.
Note: The estimated times on the picture were based on the drive being made at 11 pm. The testing was conducted around 4 pm to increase the likelihood of stop and go driving which added to the overall time to complete the test.

Test Data Quality Check:
Due to the duration of the test it is important to check for consistency in the vehicle speed between test cases. A goal is to maintain similar speeds for similar periods of time throughout the test sessions. A longer period of time with the vehicle stationary or at cruising speed would possibly affect the temperature readings due to a lack, or availability, of cooling air. Strictly adhering to posted speed limits was one mitigation step to address this concern.
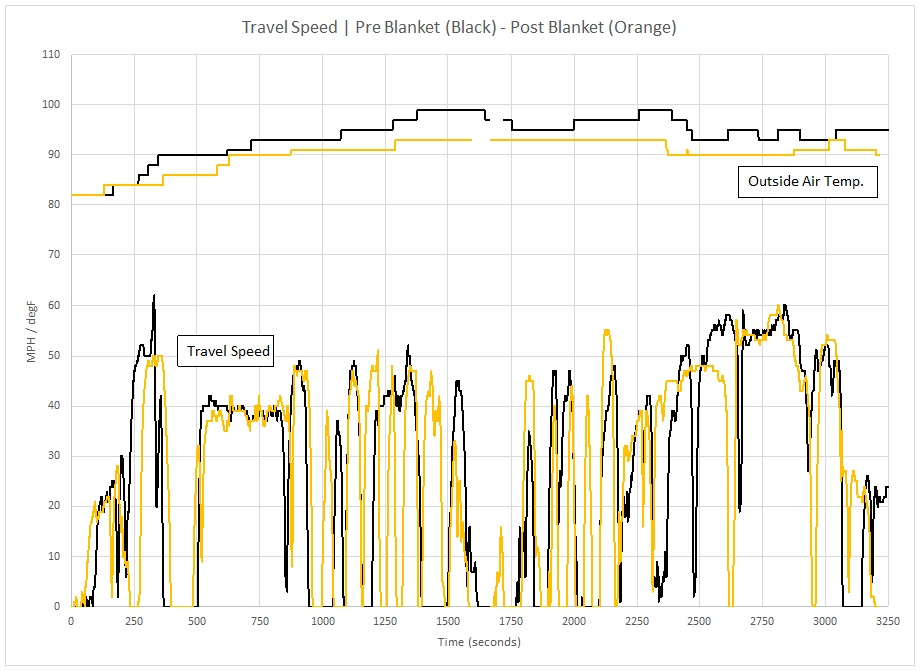
Vehicle speed data was recorded during each test session, shown on the chart below, and reduced from 20 samples per second to one sample per second. The period of evaluation for the pre blanket drive resulted in 3,951 data points and the post blanket drive resulted in 3,852 data points.
The occurrence of stop and go traffic makes a direct comparison of the raw speed data difficult. In general the pre and post blanket test session data plots of vehicle speed look similar, but there are clearly variances between the two.
To gauge how equal the two drives were with respect to time spent at the various speeds all of the speed data points from each test session were used to generate a histogram. Each bin covers a 5 mph increment from 0 up to 60 mph. The frequency of occurrence of data points in each bin was compared to the overall number of data points for the test session and a percentage was calculated. This conversion to a percentage was done to mitigate the 99 data point difference between test sessions.
The plot of the data frequency percentages is shown on the next chart:
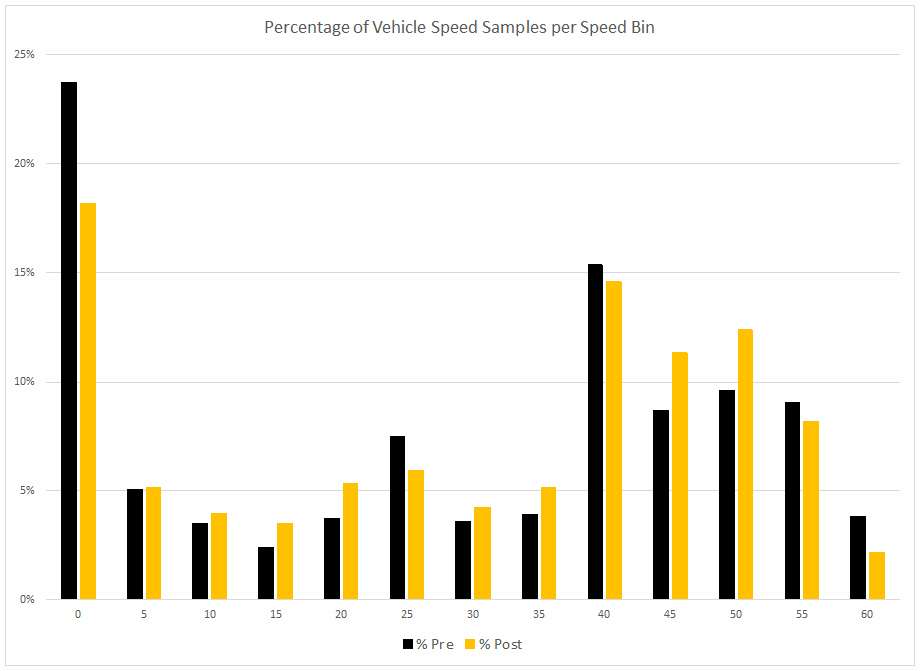
Overall there is good consistency between the test sessions. The pre blanket session had approximately 5% more time spent in a near stationary condition. The post blanket session had approximately 5% more time spent at 45-50 mph.
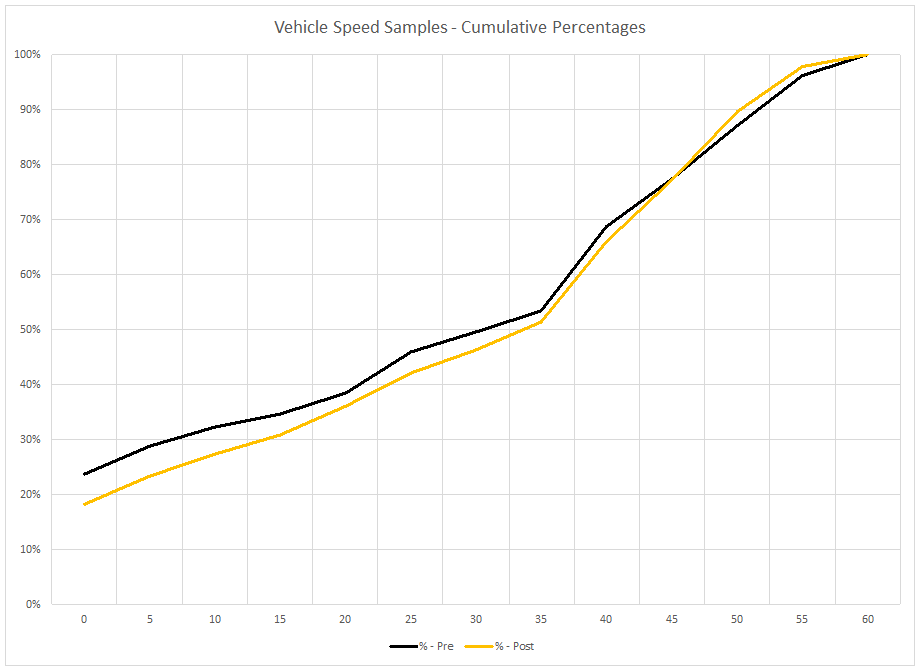
Looking at the cumulative percentages of the speed bins below also shows good similarity, increasing confidence that the two test sessions exposed the vehicle to equal, like, conditions.
Last, the speed data is summarized in boxplots:
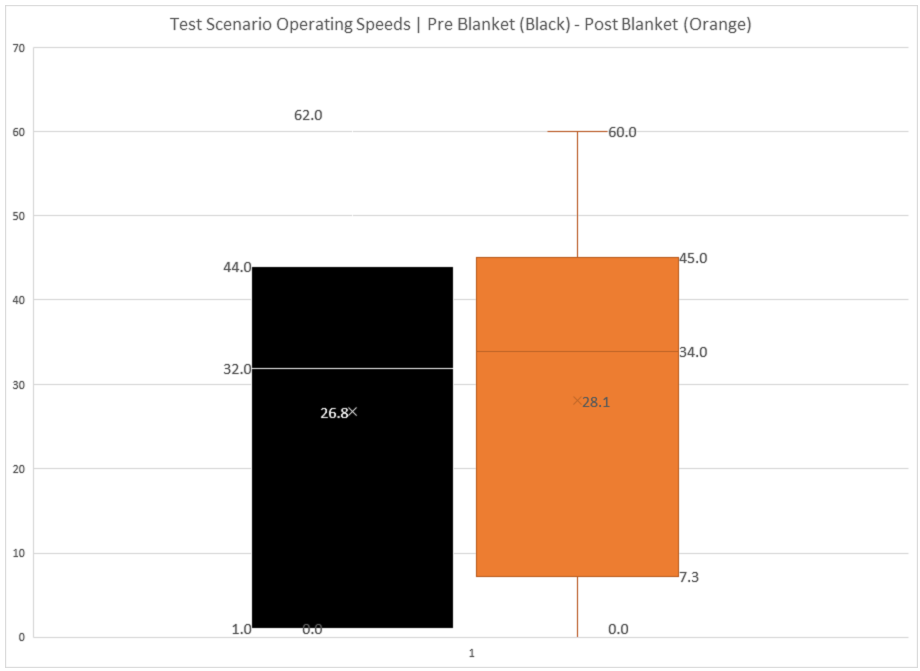
The two test cases were very similar with the pre-blanket test session having a very slightly lower average speed.
Performing a t-test on the speed data does not indicate the differences in means is large enough to believe the means are significantly different.
My conclusion is the two test cases generated good data to perform a comparison analysis with.
Test Results:
Over Turbo Temperature
Evaluating the data from the temperature sensor readings begins with the raw data values for the Over Turbo temperature sensor.
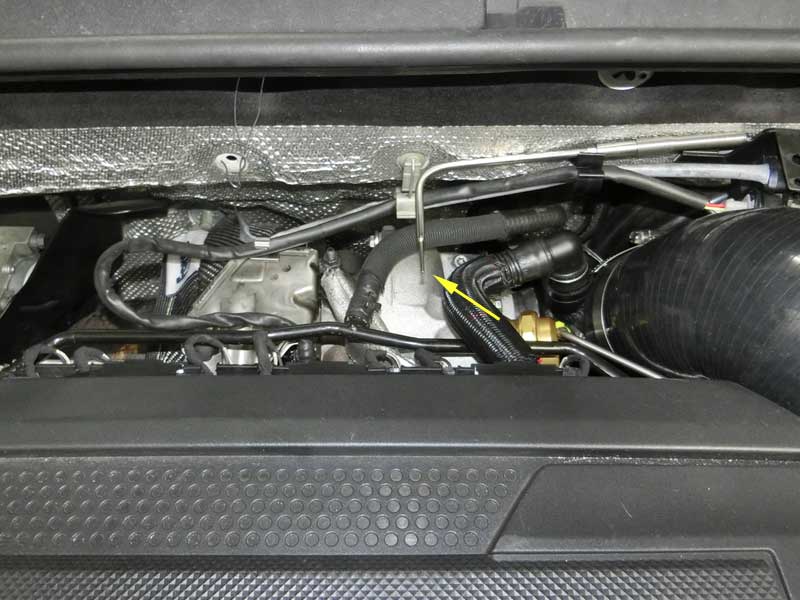
Temperature at this sensor is shown on the next chart:
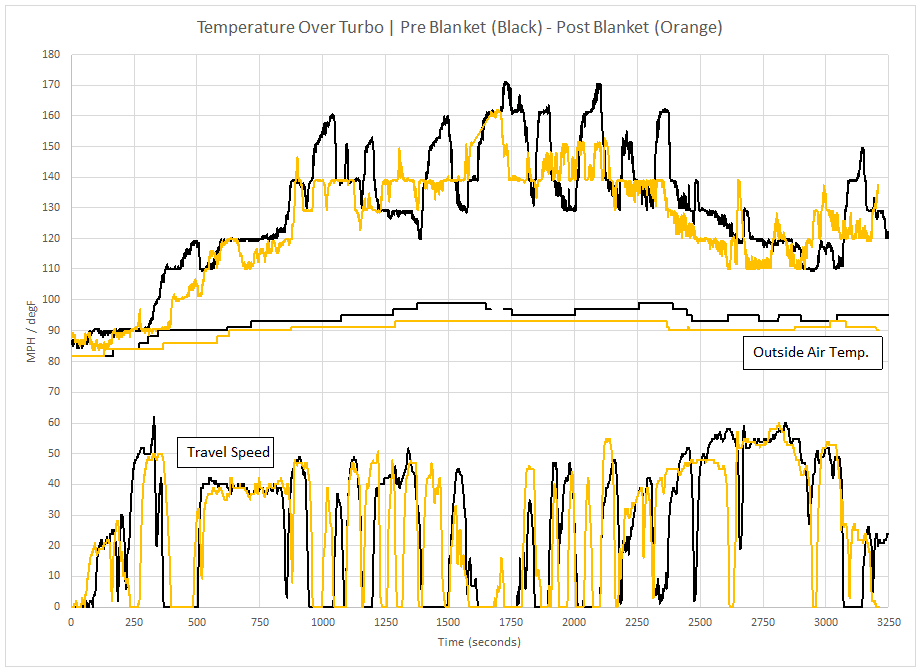
Temperatures with the turbo blanket installed appears to have less variation, although this could be a result of the driving conditions, possibly stop and go situations arising more in one case versus the other.
Looking at a scatter-plot of the operating speed and temperature reinforces the opinion that with the blanket installed the temperature has less variation, shown by the cluster of orange data points near the 45 degree temperature delta mark. The trend is not strong though and the orange data is spread across the temperature (vertical) axis.

Looking individually at temperature bins of 5 degrees each, shown below, there is decent similarity in the results between test sessions.

Notably at the 50 degF bin the post blanket test session has a significantly larger percentage of data points, this corresponds with the observation from the raw data that this test case has slightly less variation.
Boiling all of the data down to a mean and median and representing the results with a boxplot is shown below:

Indicative of how close the results are, the temperature delta mean of the pre-blanket test is 1.5 degF higher than with the blanket installed, suggesting the blanket provides a small benefit to reducing temperature in this area. Looking at the median instead, the pre-turbo temperature delta is 2.9 degF lower than after installing the blanket, indicating the blanket doesn’t reduce temperature at this sensor.
The Interquartile Range (Q3-Q1), which contains 50% of the data points, and is represented by the top and bottom of the colored boxes, is very similar between the test cases.
Not surprisingly, when performing a t-test on the sample data (5% significance level) there is no reason to believe there is a difference in mean temperature at this sensor between the two test cases.
Turbo Inlet Temperature
The next location to compare air intake temperature is the turbocharger inlet elbow.

Readings taken inside the elbow are shown on the next chart.

The temperature data appears to be similar between each test case. Allocating each data point to a 5 degreeF bin of inlet temperature over ambient temperature and comparing is shown on the next chart:

An outcome similar to the over turbo temperature is produced. With the blanket installed there is a relatively significant difference at the 20 degF bin with the post blanket case showing a higher percentage at this bin, while the pre blanket case has more percentages spread around this bin.
Summarizing the data into boxplots produces the next comparison:

Once again, depending on whether the mean or median is chosen to use for comparison, changes the outcome. In one case the pre-turbo blanket case has a lower delta temperature measure, and in the other the post-turbo blanket case does.
Interquartile range is very similar for both test cases, differing by 1-3 degrees.
The conclusion is there is very little difference, this is supported by conducting a t-test which gives no indication that the means for each test case are different.
Before Intake Manifold
The next area of the engine compartment for temperature evaluation is in front of the intake manifold.
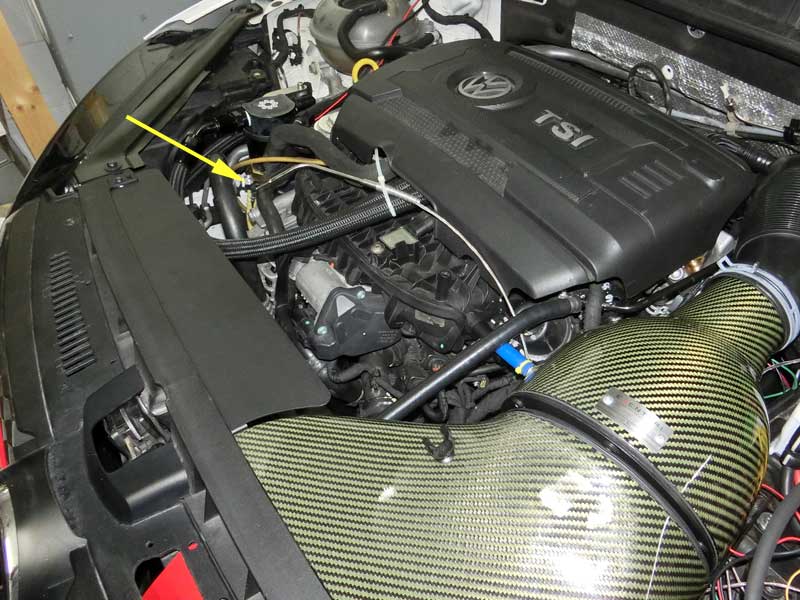
The temperature reading at this location is shown on the next chart:

Trends are similar with the post-blanket case not showing as much variation as the pre-blanket case.
Putting the data points into 5 degreeF bins and comparing them:
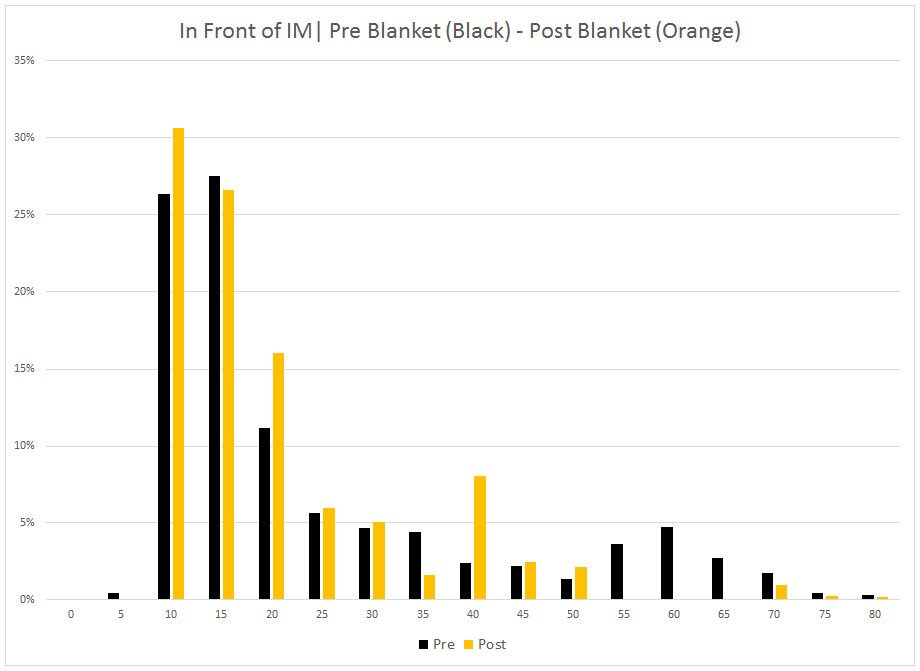
Some differences are shown towards the higher temperature bins, though they each account for less than 5% of the total data points.
Summarizing the data in boxplots:
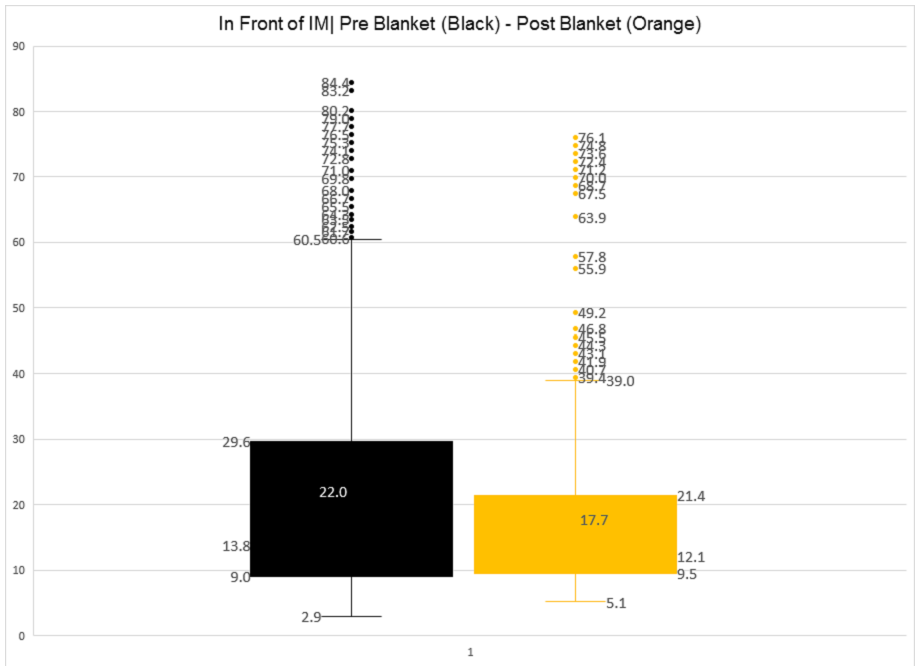
The post-blanket test appears to have a slight advantage.
Performing a hypothesis test using a t-test indicates that the differences observed in the means is not convincing enough to say the average temperature delta between pre and post blanket test cases differ significantly.
Conclusions:
Whew!
Analysis of data recorded during the turbocharger blanket test described above showed no significant differences between the baseline case, when no blanket was installed, and the test case that included a turbocharger blanket on the IS38+ turbocharger.
Claimed benefits from the use of a turbocharger blanket include:
- Lower underhood temperatures
- Limits heat soak of nearby components
- Lower intake air temperatures
None of these benefits were detected when analyzing the results from this test that used my Mk7 GTI.
Note: IAT inside the intake manifold was not used for comparison during this test due to the highly unreliable readings that the vehicle IAT sensor gives when operating out of boost, which was the condition for 99% of this test.
Note: Although there is no evidence to show the turbocharger blanket provides any benefit to the Mk7 GTI under the conditions tested, possibly with other applications or conditions a different outcome might occur.

Another great deal of work.
If you are looking for ideas, you might consider the stock downpipe vs aftermarket vs catless test pipe with regards to turbo performance. I didn’t see anything related to that but from stock to test pipe it cut my lag by maybe half. Definitely not an easy idea to test
Thanks for the suggestion Zac. If things slow down and I get the itch to try something different I might look into downpipes.
Hi what if you add the exhaust heat wrap in the downpipe will it make a difference?
I will be trying that next.
Hi,
This is an extremely good test setup and analysis!
Thank you!
However, I do feel you’d probably see the biggest difference when driving the car hard for extended periods of time, like on the racetrack. This mode of operation will result in an extremely hot turbine housing, and that’s probably where the blanket should actually make a significant difference…. That’s also the situation where you’d want it to work, to delay the car from overheating, etc… Nobody needs a blanket driving around town 😉
Thanks!
Perhaps at a track maybe there’d be a different outcome. The segment of this test where I was able to continue moving shows a steady decrease in the air temperature at each location measured. While the turbine housing may become hotter under extended load, the cooling air supply will be greater, the effects might cancel each other out.
Why not hit the interstate and drive 89mph or as close as possible for an hr with and without to see difference? Maybe put in 2 pulls to 100 halfway thru….
I didn’t believe the conditions at 80-90 mph would produce a clear difference in results. I thought the airflow through the engine compartment at that speed would keep the underhood temperature down. Looking at the short portion of the drive I made where I sustained 50-55 mph the temperature is dropping near the turbo in both cases.
Your tests are my go to! I wasn’t thinking about picking up a turbo blanket, but these tests help justify my decisions. Glad the community has someone like you!
Thanks Brian, I’m glad to hear that you are finding the site helpful. Thanks for providing that feedback!