
Background:
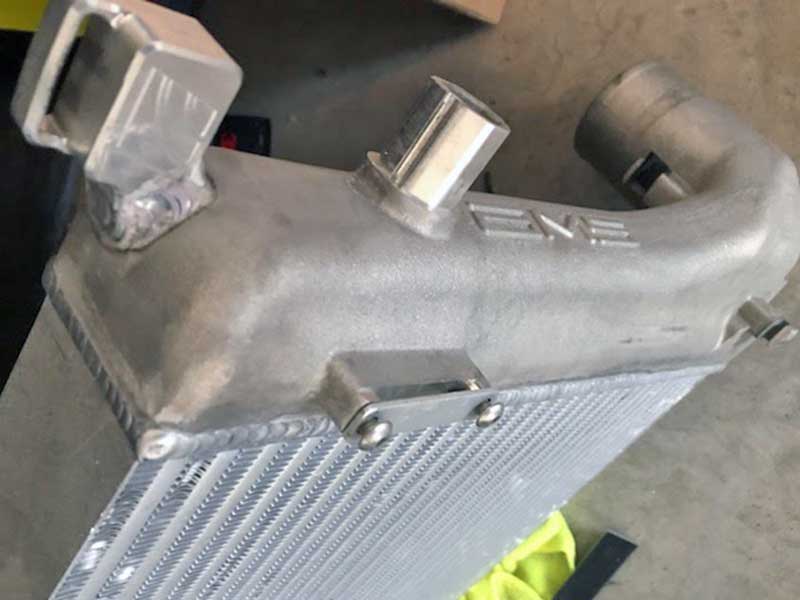
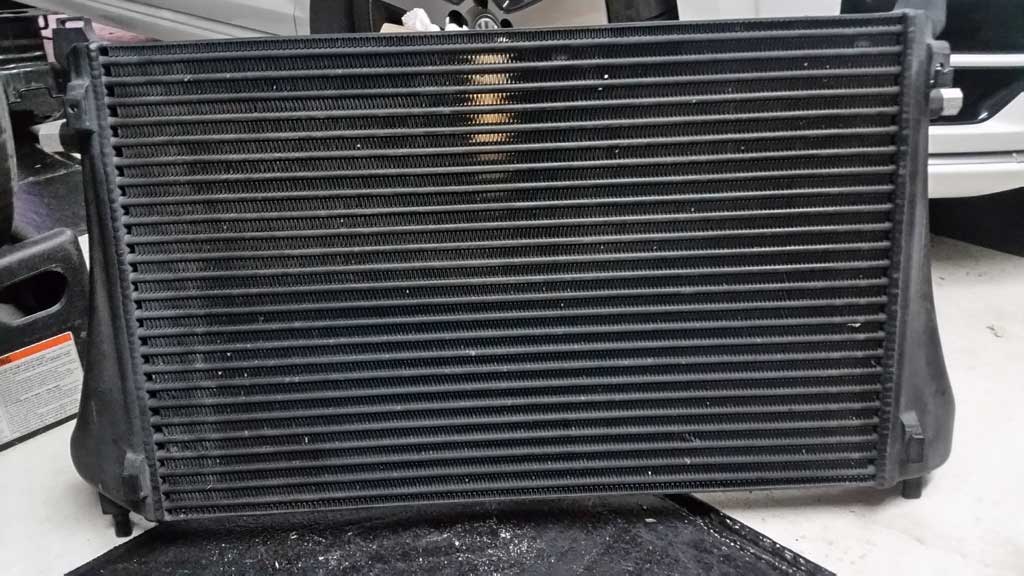
I have tested several user-recommended tube and fin style intercoolers available for the Mk7. Products from AMS Performance, do88, HPA, and Wagner have been subjected to bench testing and street driving.
This post will summarize how the products compared with one another on the tests I have conducted. The Mk7 GTI and Golf R both are equipped with Tube and Fin (T&F) style intercoolers from the factory but these “stock” intercoolers will not be included in this comparison of T&F intercoolers.

Note: These aren’t the only tube and fin style intercoolers I have considered using on my GTI. Products from PWR, Pro Alloy, and Leyo Motorsport are also tube and fin designs that look promising.
Generalizations about the Tube and Fin characteristics and the performance produced by these characteristics are something I come across fairly often in enthusiast discussions. “Tube and fin flow better…”, “Tube and Fin is better for radiator cooling…”, and “Tube and Fin recover more quickly…” are a few performance claims that are based solely on the Tube and Fin characteristic of the intercooler.
Test Procedure:
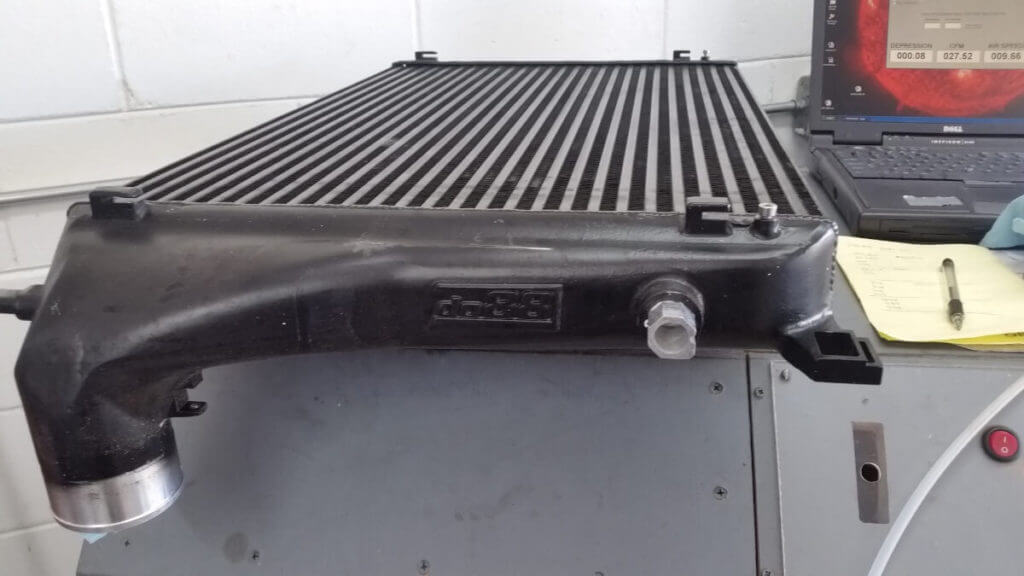
Airflow through the intercoolers is measured using a flow bench. The inlet and outlet hoses are attached to the end tanks and the outlet side silicone hose is connected to an adapter on the flow bench. Airflow is measured at a test depression of 28″ of H2O.

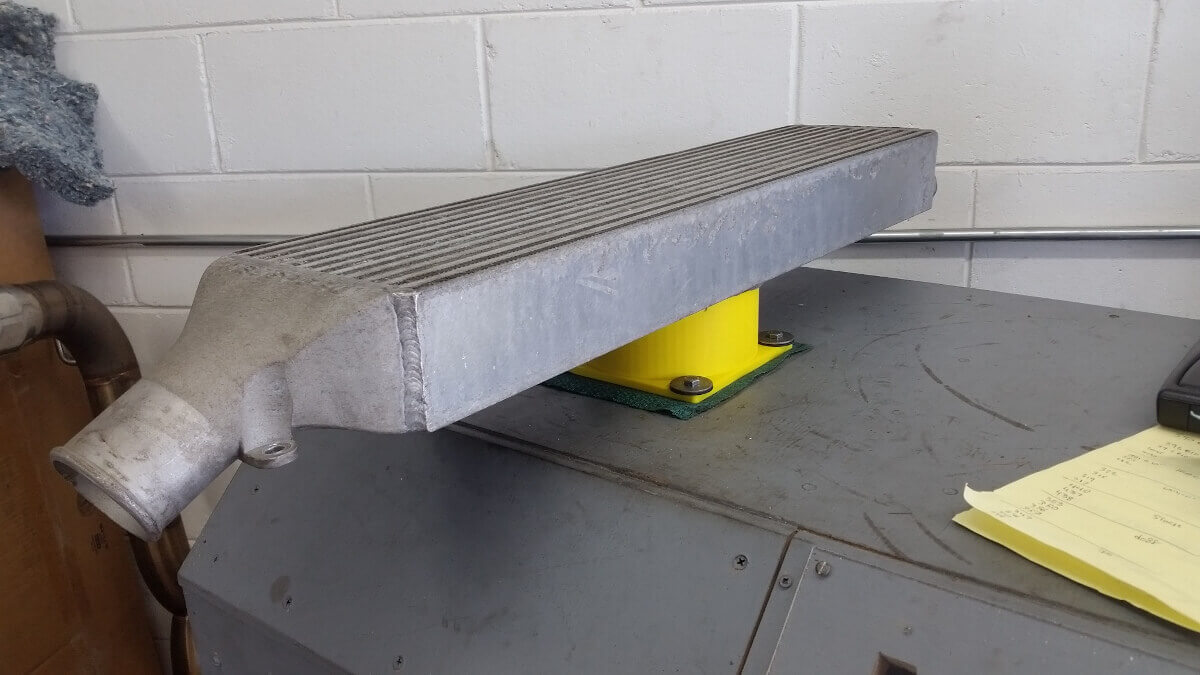
Airflow through the exterior cooling fins is measured by placing the intercooler on an adapter that sits on the flow bench and draws air through a circular subsection of the intercooler. The exterior fin airflow is measured at 10″ of H2O.
Pressure drop is measured on the vehicle between the turbo compressor outlet and the intake manifold. The pressure differential between these two locations at approximately 6,000 RPM (full-throttle third gear pull) is calculated from the difference in pressure recorded at each location.

Temperature rise above ambient is calculated by taking the Intake Air Temperature at the intake manifold and subtracting the ambient air temperature. This measure is also calculated at 6,000 RPM of a full-throttle third gear pull.
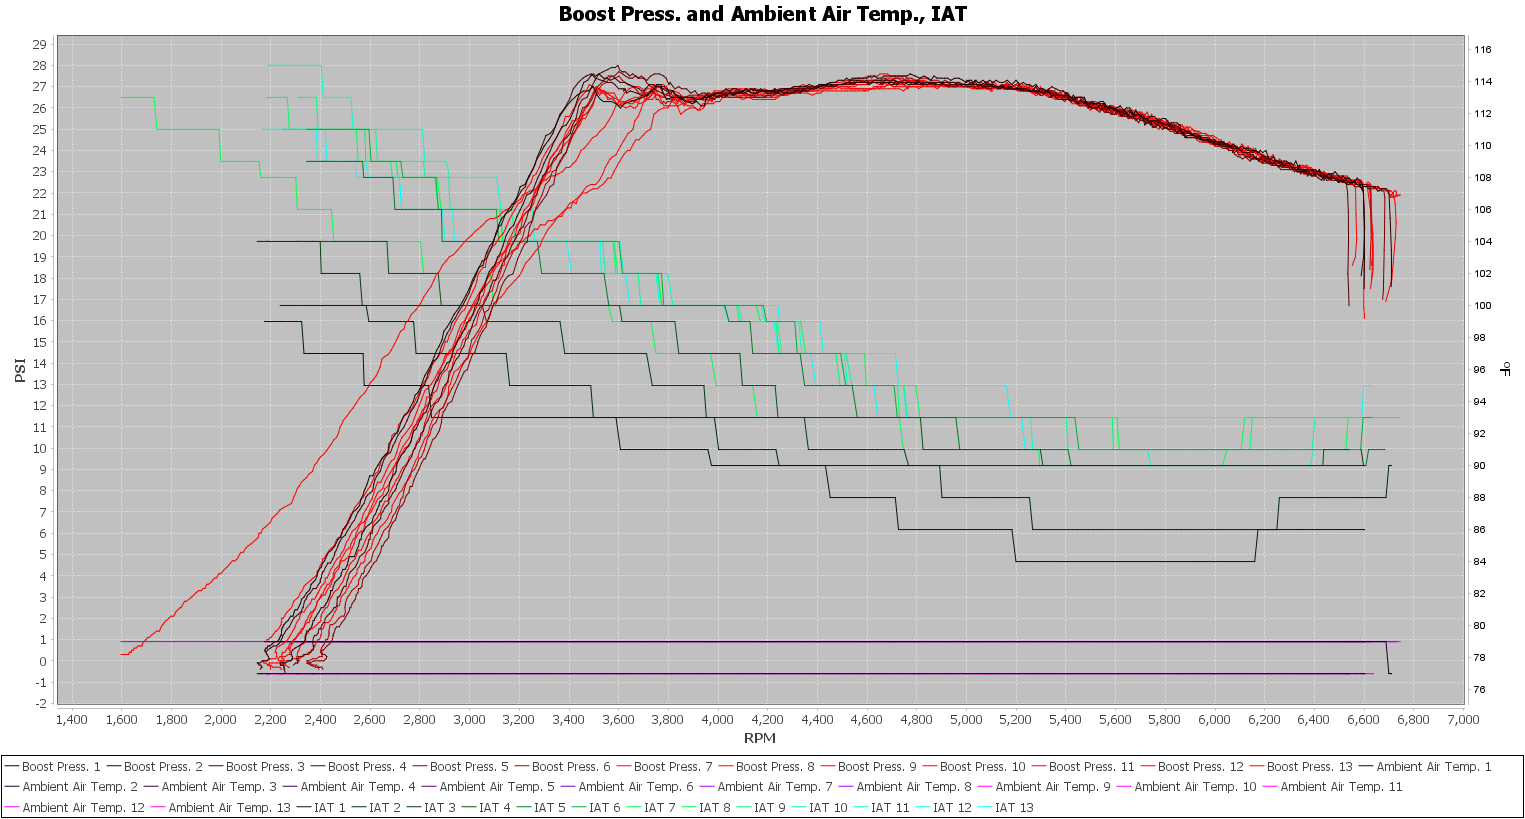
The 10-second post-boost IAT delta is a measure calculated by subtracting the ambient air temperature from the intercooler outlet temperature measured inside the throttle side charge pipe. This difference is calculated for the data measurement made ten seconds after a full-throttle pull concludes.

Test Results:
Flow bench flow testing of the interior of the ICs is shown in the chart below:

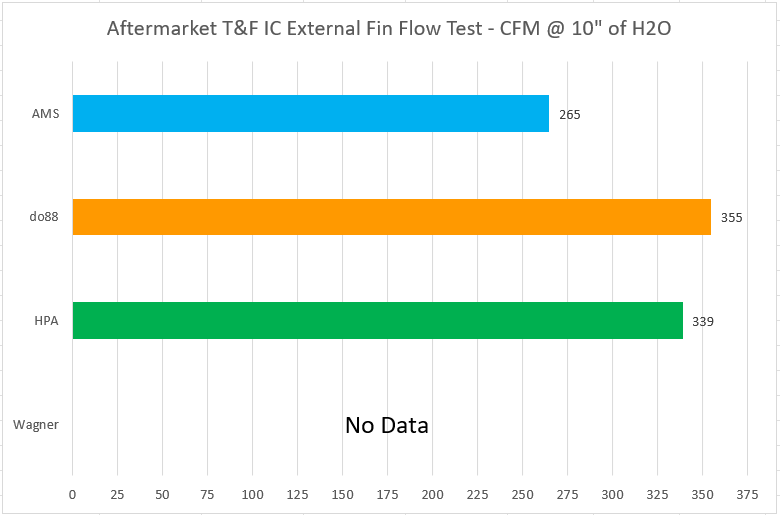
Flow testing of the external fins is shown next:
Pressure drop samples measured on the GTI are shown in the boxplots:

Temperature rise at the end of a pull is shown next:

The overlap of the boxplots indicates there are no large differences in these measures.
The next chart shows a 95% confidence interval for the average temperature rise:

Evaluating each combination of pairs of intercoolers using a t-Test (α=0.05).
NSD indicates the result was “no significant difference” followed by the average temperature difference in parenthesis. Keep in mind the t-Test accounts for sample variability. There may be some comparisons that are NSD while a smaller difference could be “statistically significant” (SS) because the sample variance for the NSD comparison was large.

The results show that the AMS IC was the only product that had a statistically significant difference, cooling slightly better than the other intercoolers.
10-second post-pull intake air temperature is shown next:

Once again there is significant overlap in the data samples indicating the differences are small.
Comparing these results with a t-Test (α=0.05):
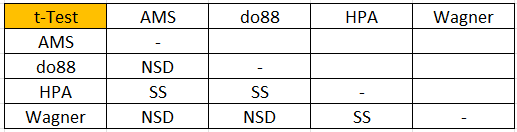
In this comparison, the HPA stands out with a statistically significant (SS) difference from all three other intercoolers. The HPA unit has a slightly higher 10-second temperature delta than the other intercoolers.
Conclusions:
Flow testing of these four intercoolers shows a large range of airflow values. In both the internal and external flow testing the highest flowing intercooler flowed approximately 34% more air than the lowest flowing core.
Considering the generalizations that were pointed out earlier; “Tube and fin flow better…”, and “Tube and Fin is better for radiator cooling…”, it’s apparent that there is more to these performance measures than simply being a Tube and Fin design.
Unsurprisingly the lowest flowing intercooler, AMS, also performed the best on the full-throttle pull cooling test.
The AMS IC has an external fin density that is approximately twice that of the other intercoolers. This explains the difference in external airflow. Assuming the internal fins have a similar disparity in density, this would explain the lower internal airflow and improved cooling performance.
Note: Both cooling and pressure drop are important. These tests do not give any insight into the effect of cooling or pressure drop on engine power output. A sensitivity analysis of the cooling and pressure drop factors would be needed to understand if the differences measured in this testing are significant for power production or not.