
Background:
Due to the costs that could result from a turbocharger failure, having a reliable turbocharger is a desirable quality for the product. A replacement turbocharger can cost several hundred to several thousand dollars. Labor to install the product could also be several hundred dollars. Software tuning, if the replacement differs from what was previously installed, can also amount to hundreds of dollars.
Product reliability is an important aspect of turbocharger performance (and other parts as well) but is a quality that lacks much (perhaps any) credible information.

Often times vendors and other enthusiasts will talk about products being reliable, or unreliable. In this post, I look into the topic of reliability, what it is, and how it is measured. Then I will consider some examples of vendor and enthusiast claims about reliability and assess if they are credible.
What is reliability?
The reliability of a manufactured product is defined as the probability that it will perform satisfactorily for a specified period of time under stated use conditions. “Probability” means, in the mathematical sense, a number between 0 and 1 (with 1 representing 100%) indicating the likelihood of occurrence.
U.S. Gov’t Inspection Technical Guide
Competing demands for low-cost turbos and operating them under loads that support high engine horsepower output may create reliability challenges for these products.
Reliability during product lifetime
Looking at the probability of failure throughout a product’s life is helpful to understand different types of failures.
The failure rate varies in a predictable manner over the life of the product and can be considered as occurring in three different periods of the life of the product. This variation forms what has been called a “bath-tub” curve because of its shape.
U.S. Gov’t Inspection Technical Guide
The observed failure rate is generated from three types of failures: Infant Mortality, Constant Random, and Wear Out.
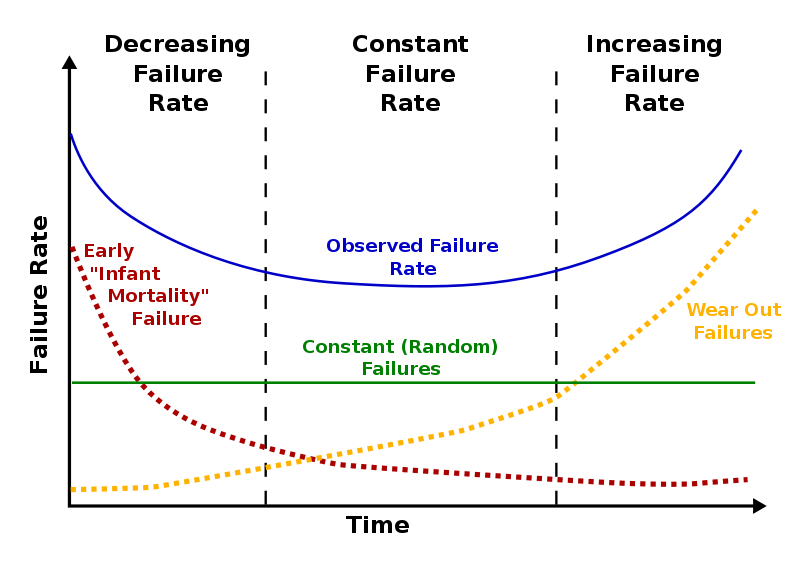
“Infant mortality” is a result of latent defects that escape manufacturing quality assurance tests and appear early during operation. These failures decrease over time as defective products are removed from use and corrections are made to the product manufacturing.
Think of the advice not to buy the first year of a new model car. With turbochargers, hopefully, the product has been subjected to beta testing before being sold to consumers.
The second period is the “Useful Life” of the product. During this period the failure rate is relatively constant and failures are caused mainly by stress. Depending on the make-up of the product in question, stress can be temperature, voltage, torque, humidity, etc.
The third period in the life of the product is the “Wear Out” stage. The failure rate again climbs rapidly and is caused by the general physical and/or chemical deterioration with time or use of one or more of the principal components, or the general degradation of them all, such that the functioning of the product is unacceptable.
Root Cause Analysis:
Understanding what caused a product failure is essential to properly characterize the product’s reliability.
Root cause analysis (RCA) is the process of finding the underlying cause for an effect we observe or experience. In the context of failure analysis, RCA is used to find the root cause of the turbo malfunction or failure.

What happened? Why did it happen?
All failures in the factory or the field should be analyzed to determine if the product failed because of problems with design, components, manufacturing, testing, shipping, installation, maintenance, or use.
U.S. Gov’t Inspection Technical Guide
Conducting root cause analysis can be very complicated. It involves a vast amount of data collection and review. The result of a root cause analysis isn’t always black and white. It can’t always tell you if the problem you identified is the root cause.
You will often get only a strong correlation between cause and effect and not the exact cause. From there, you may have to rely on experience and professional knowledge to judge whether to investigate further or not.
Reliability metrics:
Reliability metrics are summary statistics that are used to represent the degree to which a system’s reliability is consistent with successful application across the likely scenarios of use.
High-level failure statistics require a significant amount of meaningful data. If data is missing or inaccurate, the failure metrics will be useless in informing decisions. Even worse, if you are unaware that the data is unreliable, you could end up making a decision that could be counterproductive.
Reliability can be characterized using several different measures. One useful measure is called Failure Rate.
Failure Rate – The failure rate of a device is defined as the number of failures per unit time or the proportion of the sampled units that fail before some specified time.
Trying to determine the failure rate raises several questions:
- What is the number of units that have been sampled?
- Is the sample size sufficiently large to produce a high confidence estimate of the failure rate?
- What length of time is specified as the useful life of the product?
Assessing if the sample size is large enough raises more questions:
- What is the size of the population?
- What margin of error is acceptable?
- What confidence level is acceptable?
If someone says a turbocharger has a high failure rate they should be able to answer all of these questions, otherwise, the failure rate quoted will be unreliable.
Another useful measure for consumers to understand is the Mean Time To Failure:
Mean Time To Failure (MTTF) – represents the length of time that an item is expected to last in operation until it fails. Its value is calculated by looking at a large number of the same kind of items over an extended period and seeing what is their mean time to failure.
MTTF is calculated as the total hours of operation, divided by the total number of items being tracked.
I cannot recall a time that a vendor or enthusiast quoted a MTTF for a product.
What these two metrics can inform us of is, how likely is it that a product will fail, and if it does fail, on average how long will it have been operating when it does fail.
Reliability claims:
Knowing a little about product reliability, we’re at the point of asking how credible the claims made by vendors and fellow enthusiasts are when it comes to turbochargers (or other products).
How likely is it that the vendor or enthusiast has performed a root cause analysis to gather the data needed to calculate reliability metrics for an informed decision about product reliability?

Here is a vendor claim as an example:
“The factory turbochargers on the Audi S3 and Volkswagen Golf R are prone to failure.“
USP Motorsports IHI IS38 product description
“prone” – having a natural inclination or tendency to something; disposed; liable: – Dictionary.com
As was described above, the first step in estimating the reliability of a product is to conduct a root cause analysis (RCA). The USP statement shown above is on their IHI IS38 product page and no supporting information was provided. Based on the understanding that an RCA takes a vast amount of data it’s unlikely that they performed one.
For the sake of continuing this example, I will assume they did.
The next question is what is a sufficient sample size of products for USP to conduct a credible RCA with?
The table below shows that through 2018 there were 14,823 Golf Rs in the United States – this number represents the “population” of IS38s. Excluding other vehicles also using the IS38 turbo.
| Model | 2014 | 2015 | 2016 | 2017 | 2018 | Total |
|---|---|---|---|---|---|---|
| Golf R | 15 | 4,141 | 4,493 | 2,706 | 3,468 | 14,823 |
| GTI | 17,362 | 23,669 | 23,934 | 22,486 | 16,684 | 104,135 |
- The number of IS20 Turbochargers in the United States market only. Does not include Audi A3 production numbers.
- The number of IS38 Turbochargers in the United States market only. Does not include Audi S3 production numbers.
With a confidence level of 95%, a margin of error of 5%, and a population proportion of 50% (a conservative assumption), the sample size can be calculated. The number of IS38 turbocharger samples that USP should have investigated is 375.
The RCA would need to pinpoint if the turbocharger design, components, or manufacturing were the cause of the failure and ruled out shipping, installation, maintenance, or use.
It is hard to imagine an aftermarket parts and service business going to the lengths necessary to credibly state that a product is prone to failure and not present any evidence in support of that claim. In conclusion, the claim is not credible.
Here’s an enthusiast claim:

The person states that two brands of turbochargers are not able to handle a lot of power without failing. For the third brand of turbocharger referenced, they have never heard a report of one failing, and it has not failed on them.
The person stated that they weren’t interested in having a debate on the subject – so what is shown above is all the information available.
This is very similar to the USP example. A claim is made about product reliability, in this case for multiple products, some favorably and some unfavorably with no supporting evidence provided.
In this example, there is no data available that I am aware of to estimate the population sizes of any of the turbochargers. Making an assumption that the vendors identified have sold one (1) turbocharger per week, and they’ve been available for about three (3) years, a guess at the population of each product is 150 turbochargers.
Using a 95% confidence level, 5% margin of error, and 50% population proportion, the sample size of turbochargers from each manufacturer is 108 turbochargers. For all three brands, that is an evaluation of 324 turbochargers.
For the statements being made by the enthusiast to be credible, they depend on the enthusiast conducting a root cause analysis on 324 turbochargers. That level of effort, contrasted with the minimum amount of information provided by the person, gives low confidence to the claims. In conclusion, the claim is not credible.
Summary:
This post provided information on the topic of product reliability. It addressed what reliability is and how reliability can be measured.
Two examples of reliability claims were presented to compare against what is required to develop credible reliability information for claims that consumers might encounter.