
Background:
The CTS FMIC (front mount intercooler) for the Mk7 is subjected to a flow test to compare airflow measurements with other Mk7 intercooler options.
Test Procedure:
After calibrating the flow bench the CTS FMIC is placed on top of an adapter that allows for measuring the airflow through the external fins of the intercooler.
This is shown in the picture below.
Note: The IC in the picture is not the CTS FMIC, the picture is an example of how the part is tested.

After measuring the external fin airflow the CTS intercooler hoses are attached to the intercooler and the outlet side of the intercooler is attached to the flow bench.
The inlet side hose has a bell mouth placed in the inlet to help smooth airflow into the inlet hose.
The flow bench is operated at 28″ of H2O and airflow through the CTS FMIC is measured at this depression.

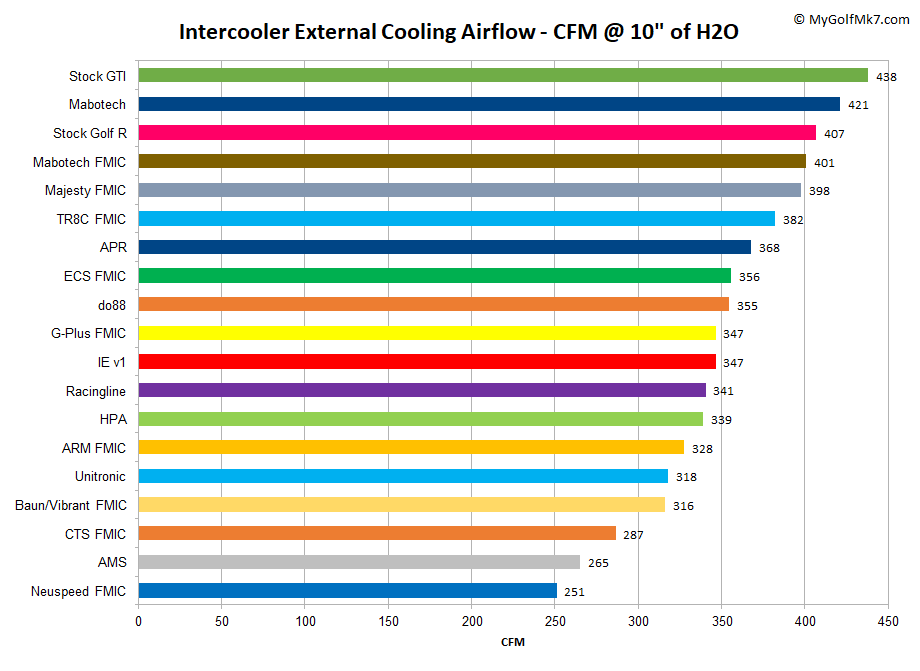
Test Results:
The external fins of the CTS FMIC flow 287 CFM @ 10″ of H2O.
This is shown on the chart along with all other intercoolers that have been tested.
The internal passageways of the CTS FMIC flow 146 CFM @ 28″ of H2O.
This is shown in the next chart along with other FMIC and stock IC+Bicooler intercoolers that have been tested.

Conclusions:
The CTS FMIC was the subject of a flow test and was found to flow 287 CFM @ 10″ of H2O through the external fins.
Airflow through the intercooler’s internal passages measured 146 CFM @ 28″ of H2O.
Both of these flow rates are on the lower end of the range of products that have been measured.
So glad you finally got this one to test! Looking forward to more data.
I’ve got plans to compare a few FMICs, including this one.
Any hypothesis for this one? The lower external and internal flow suggests higher density of fins, so perhaps that means better cooling performance?
That’s a possibility. The AMS IC is also on the low end of the flow tests as a result of high fin density on the external side, and presumably on the interior as well. AMS cools well from what I’ve measured, and the pressure drop hasn’t made a difference to the power output that I could measure. Neuspeed also has low flow rates, but it cooled well during the short time that I used it.
If you look at the trend on the combination chart where I plot temperature and airflow you see a trend toward better cooling as airflow drops. It’s more pronounced with the FMICs but also shows up with the stock location ICs.
In your opinion, which do you believe is the best intercooler setup for the MK7?
I’m currently using a G-Plus FMIC paired with an AMS stock location IC. I’ve been pretty happy with this combination, but there are other options that I haven’t tried.