
Background:
Final configuration.
Coinciding with the Duct testing I was undertaking with the CTS Turbo intake I came across this piece of advice from another owner who is using the CTS Turbo intake without the heat shield.

Since I was already using the same intake as Mike and had temperature sensors in place to record the intake air temperature, I decided to measure another variation of the intake setup following Mike’s advice to do away with the heat shield altogether.
Test Process:
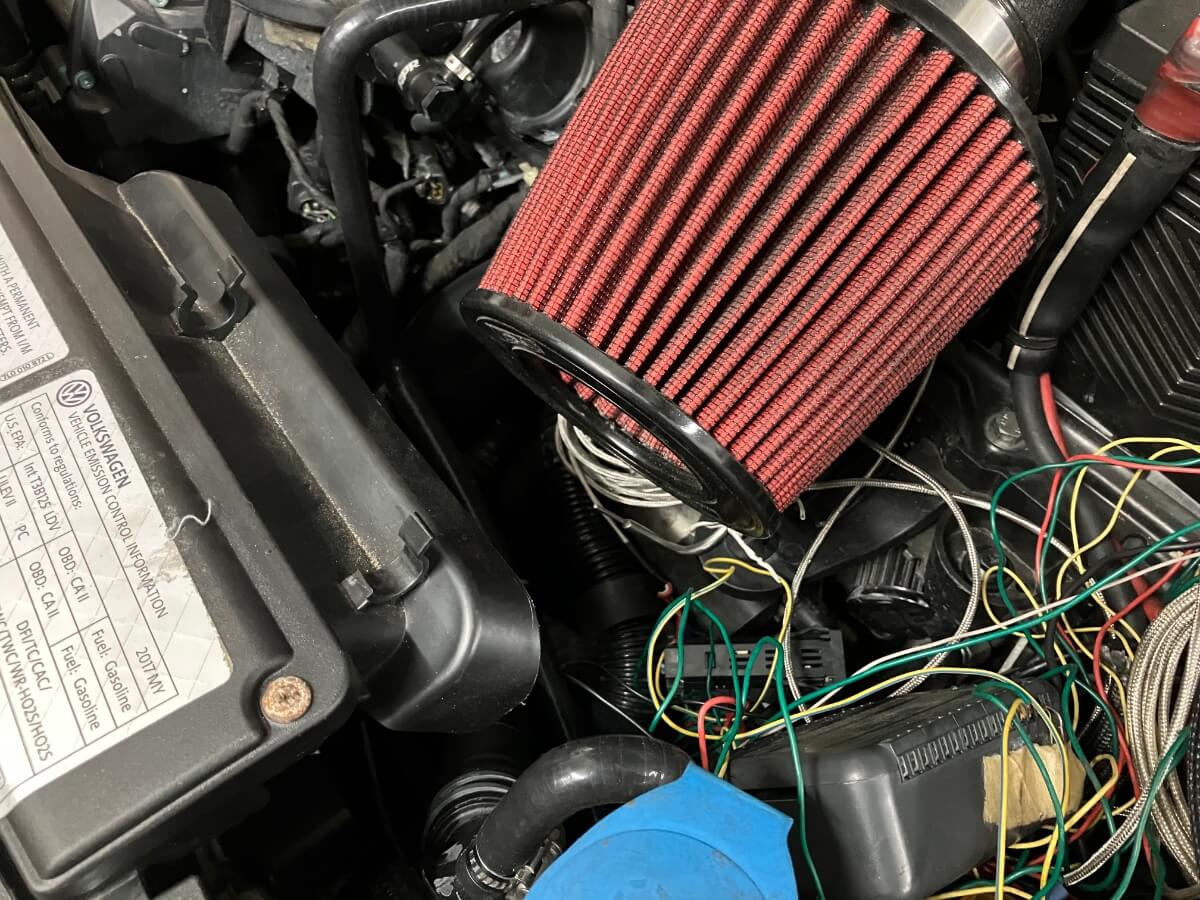
The CTS Turbo intake is installed without the CTS heat shielding and the stock Mk7 air duct is left in place.
This is referred to as Duct-5.
The air duct is modified to be opened at the front of the driver’s side and closed at the back of the passenger side. This configuration was previously tested and found to be good at reducing the air temperature entering the intake.
The GTI is driven to a location where full-throttle acceleration is possible.
The car is operated in third gear during the full-throttle acceleration from approximately 2000 RPM to 6300 RPM which is repeated several times in short succession.
Test Results:
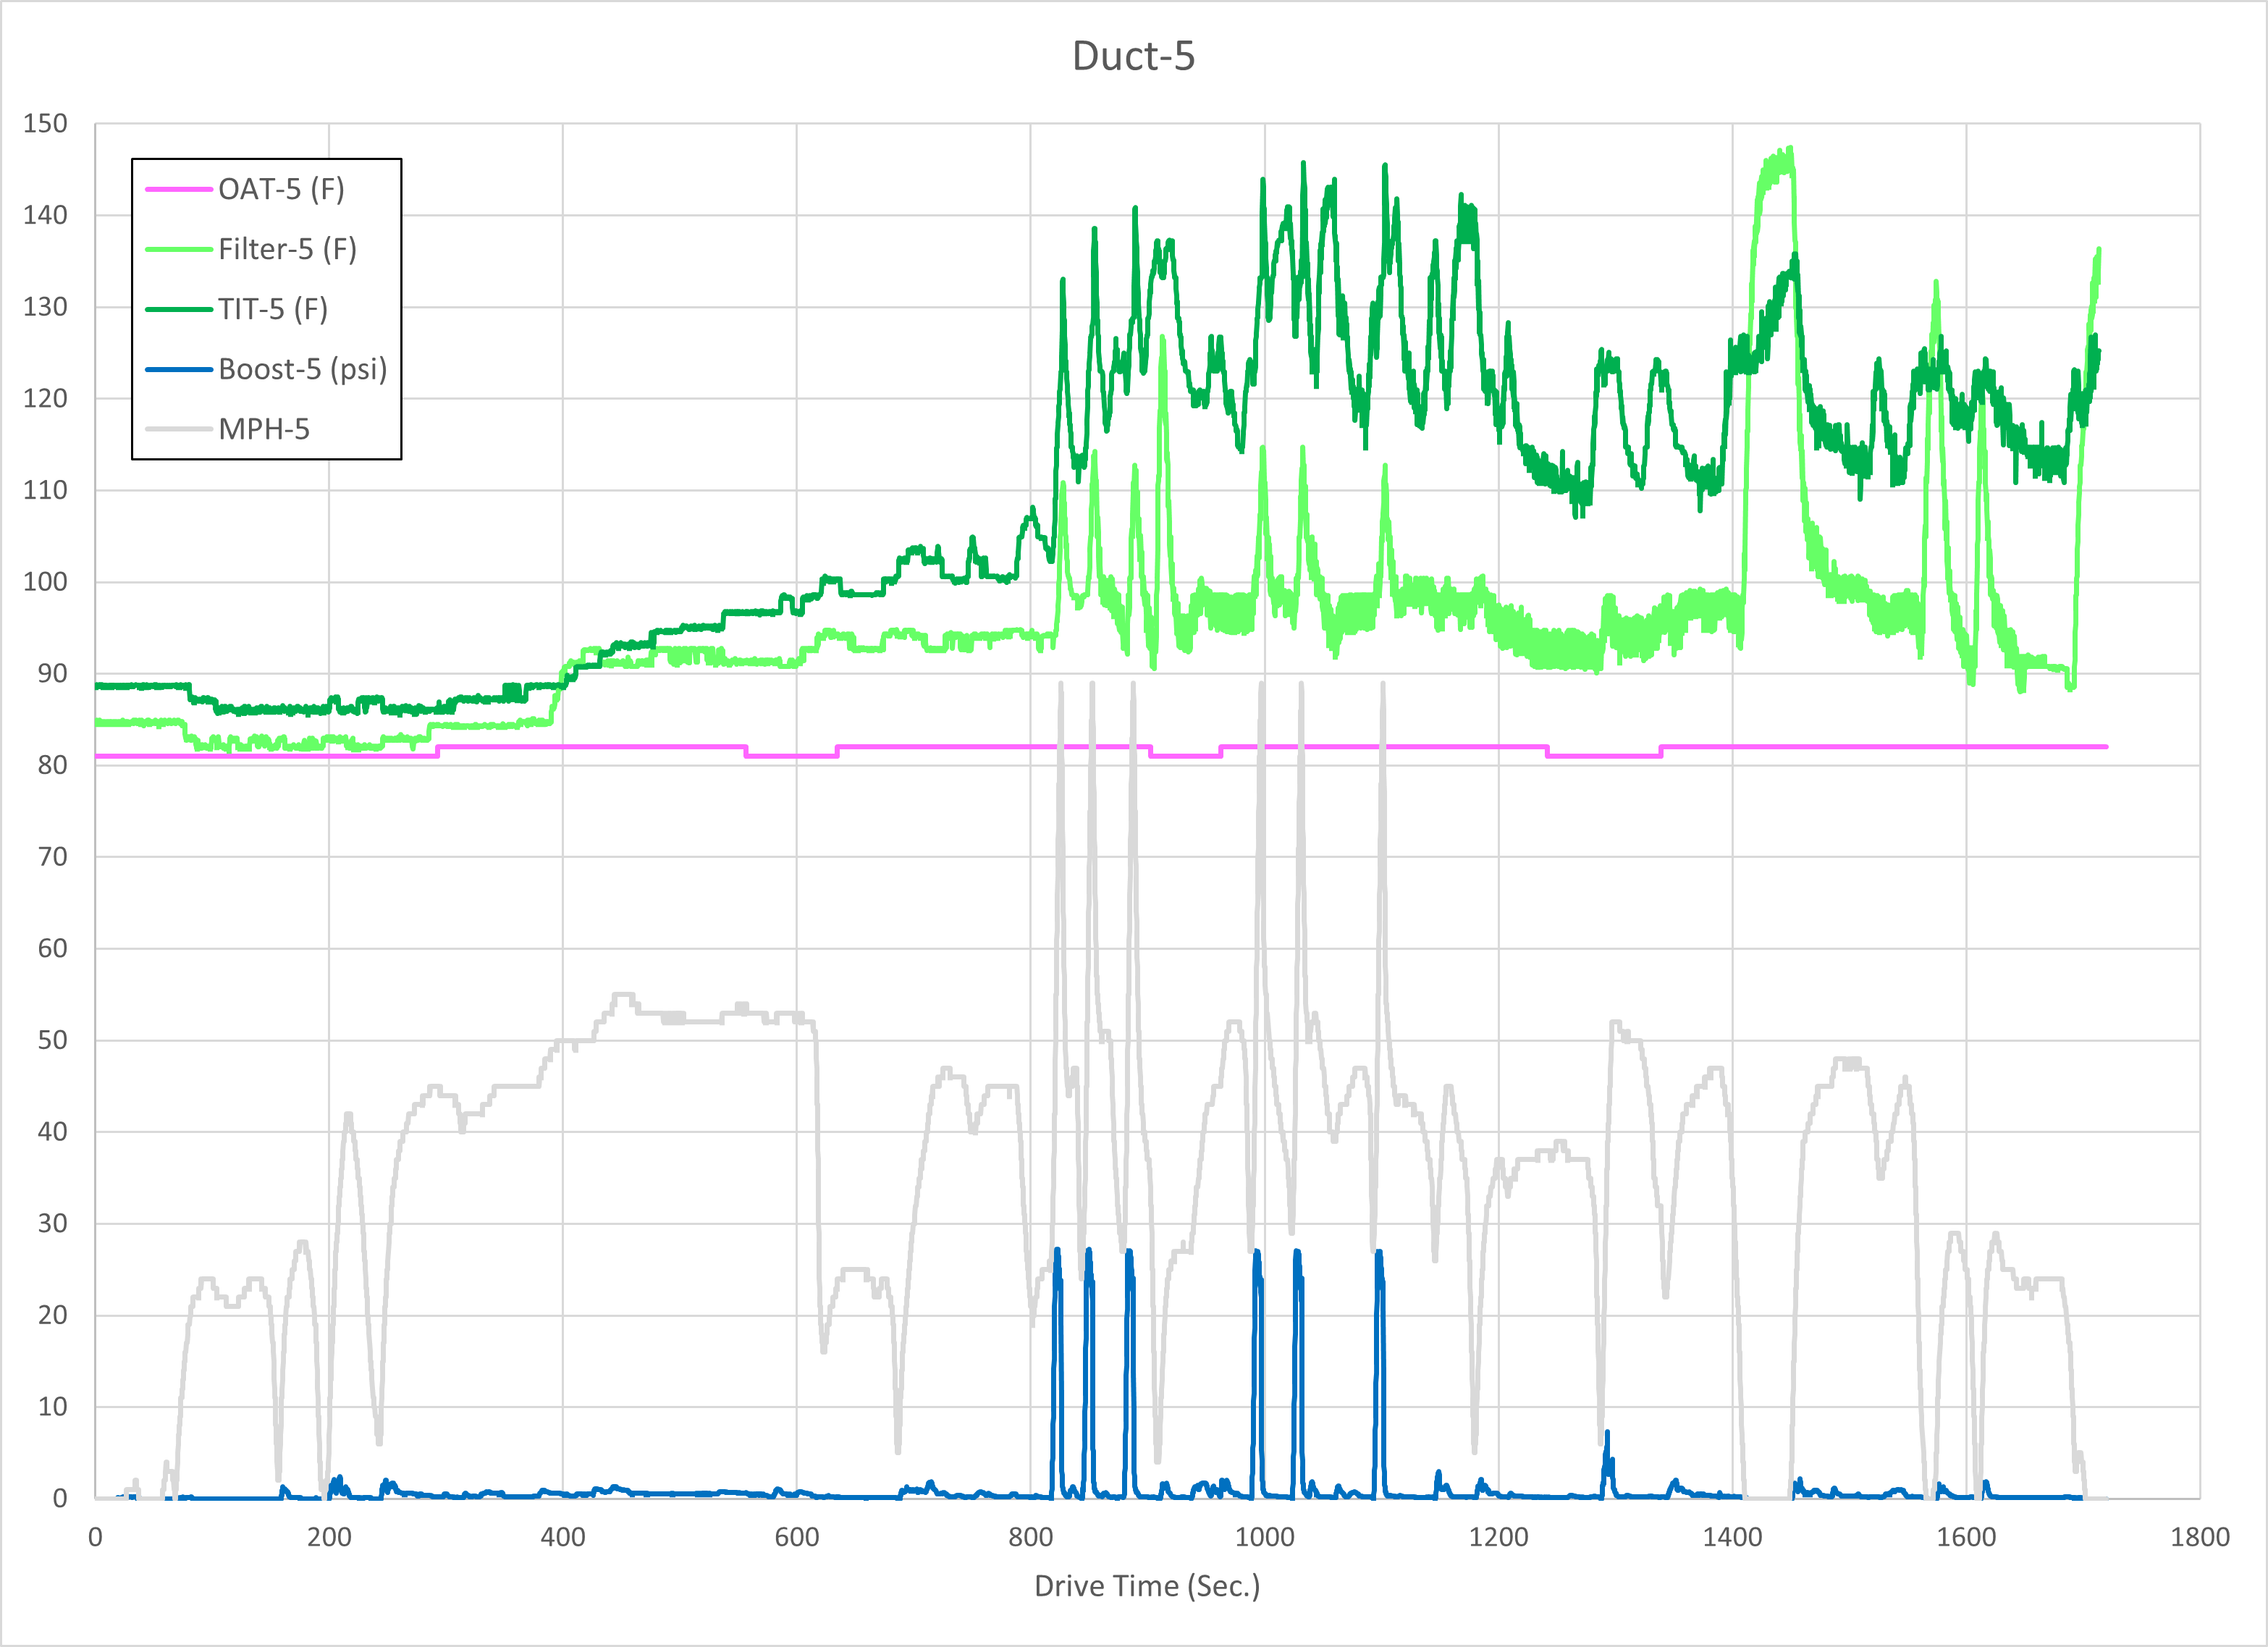
The first chart shows the outside air temperature and intake air temperature in the area of the air filter along with the air temperature at the turbocharger inlet for the duration of the drive.
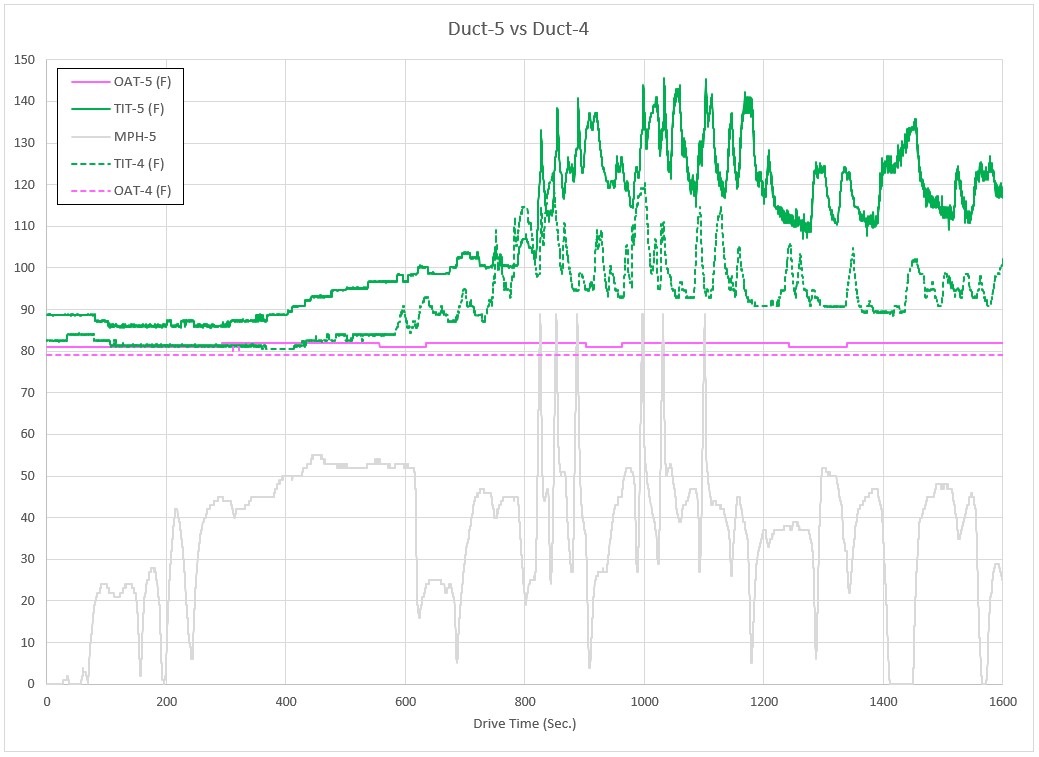
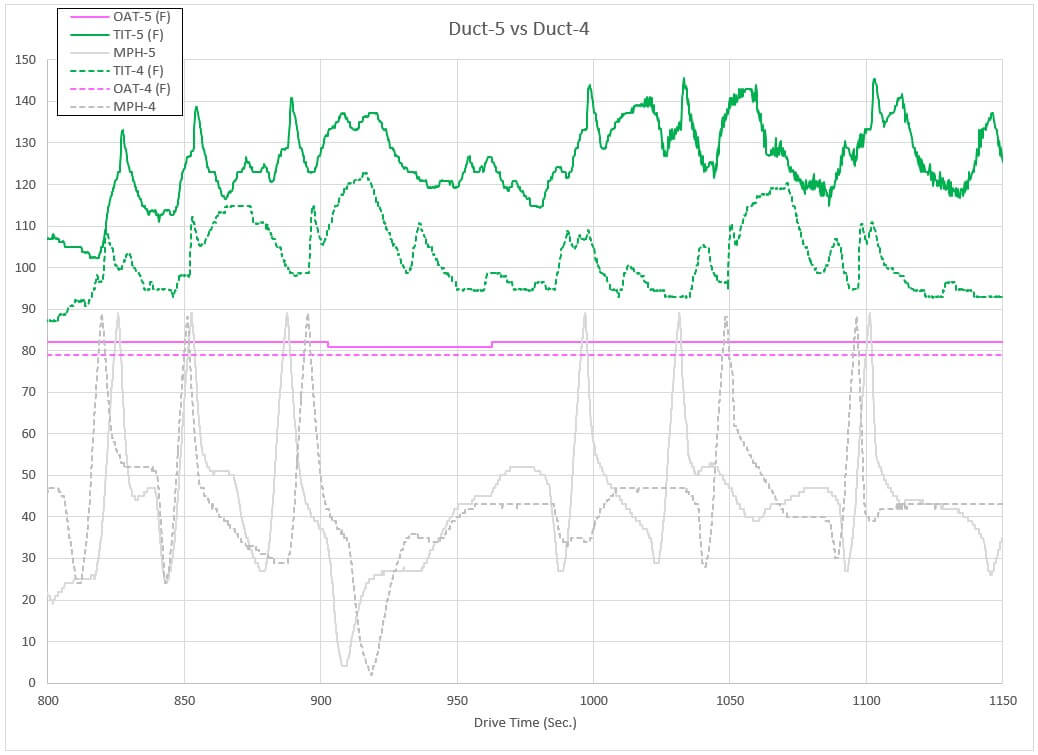
The next chart is a comparison of the turbocharger inlet air temperature for Duct-5 (without the heat shield-solid lines) to the Duct-4 configuration (with the heat shield-dashed lines), for most of the data collection sessions.
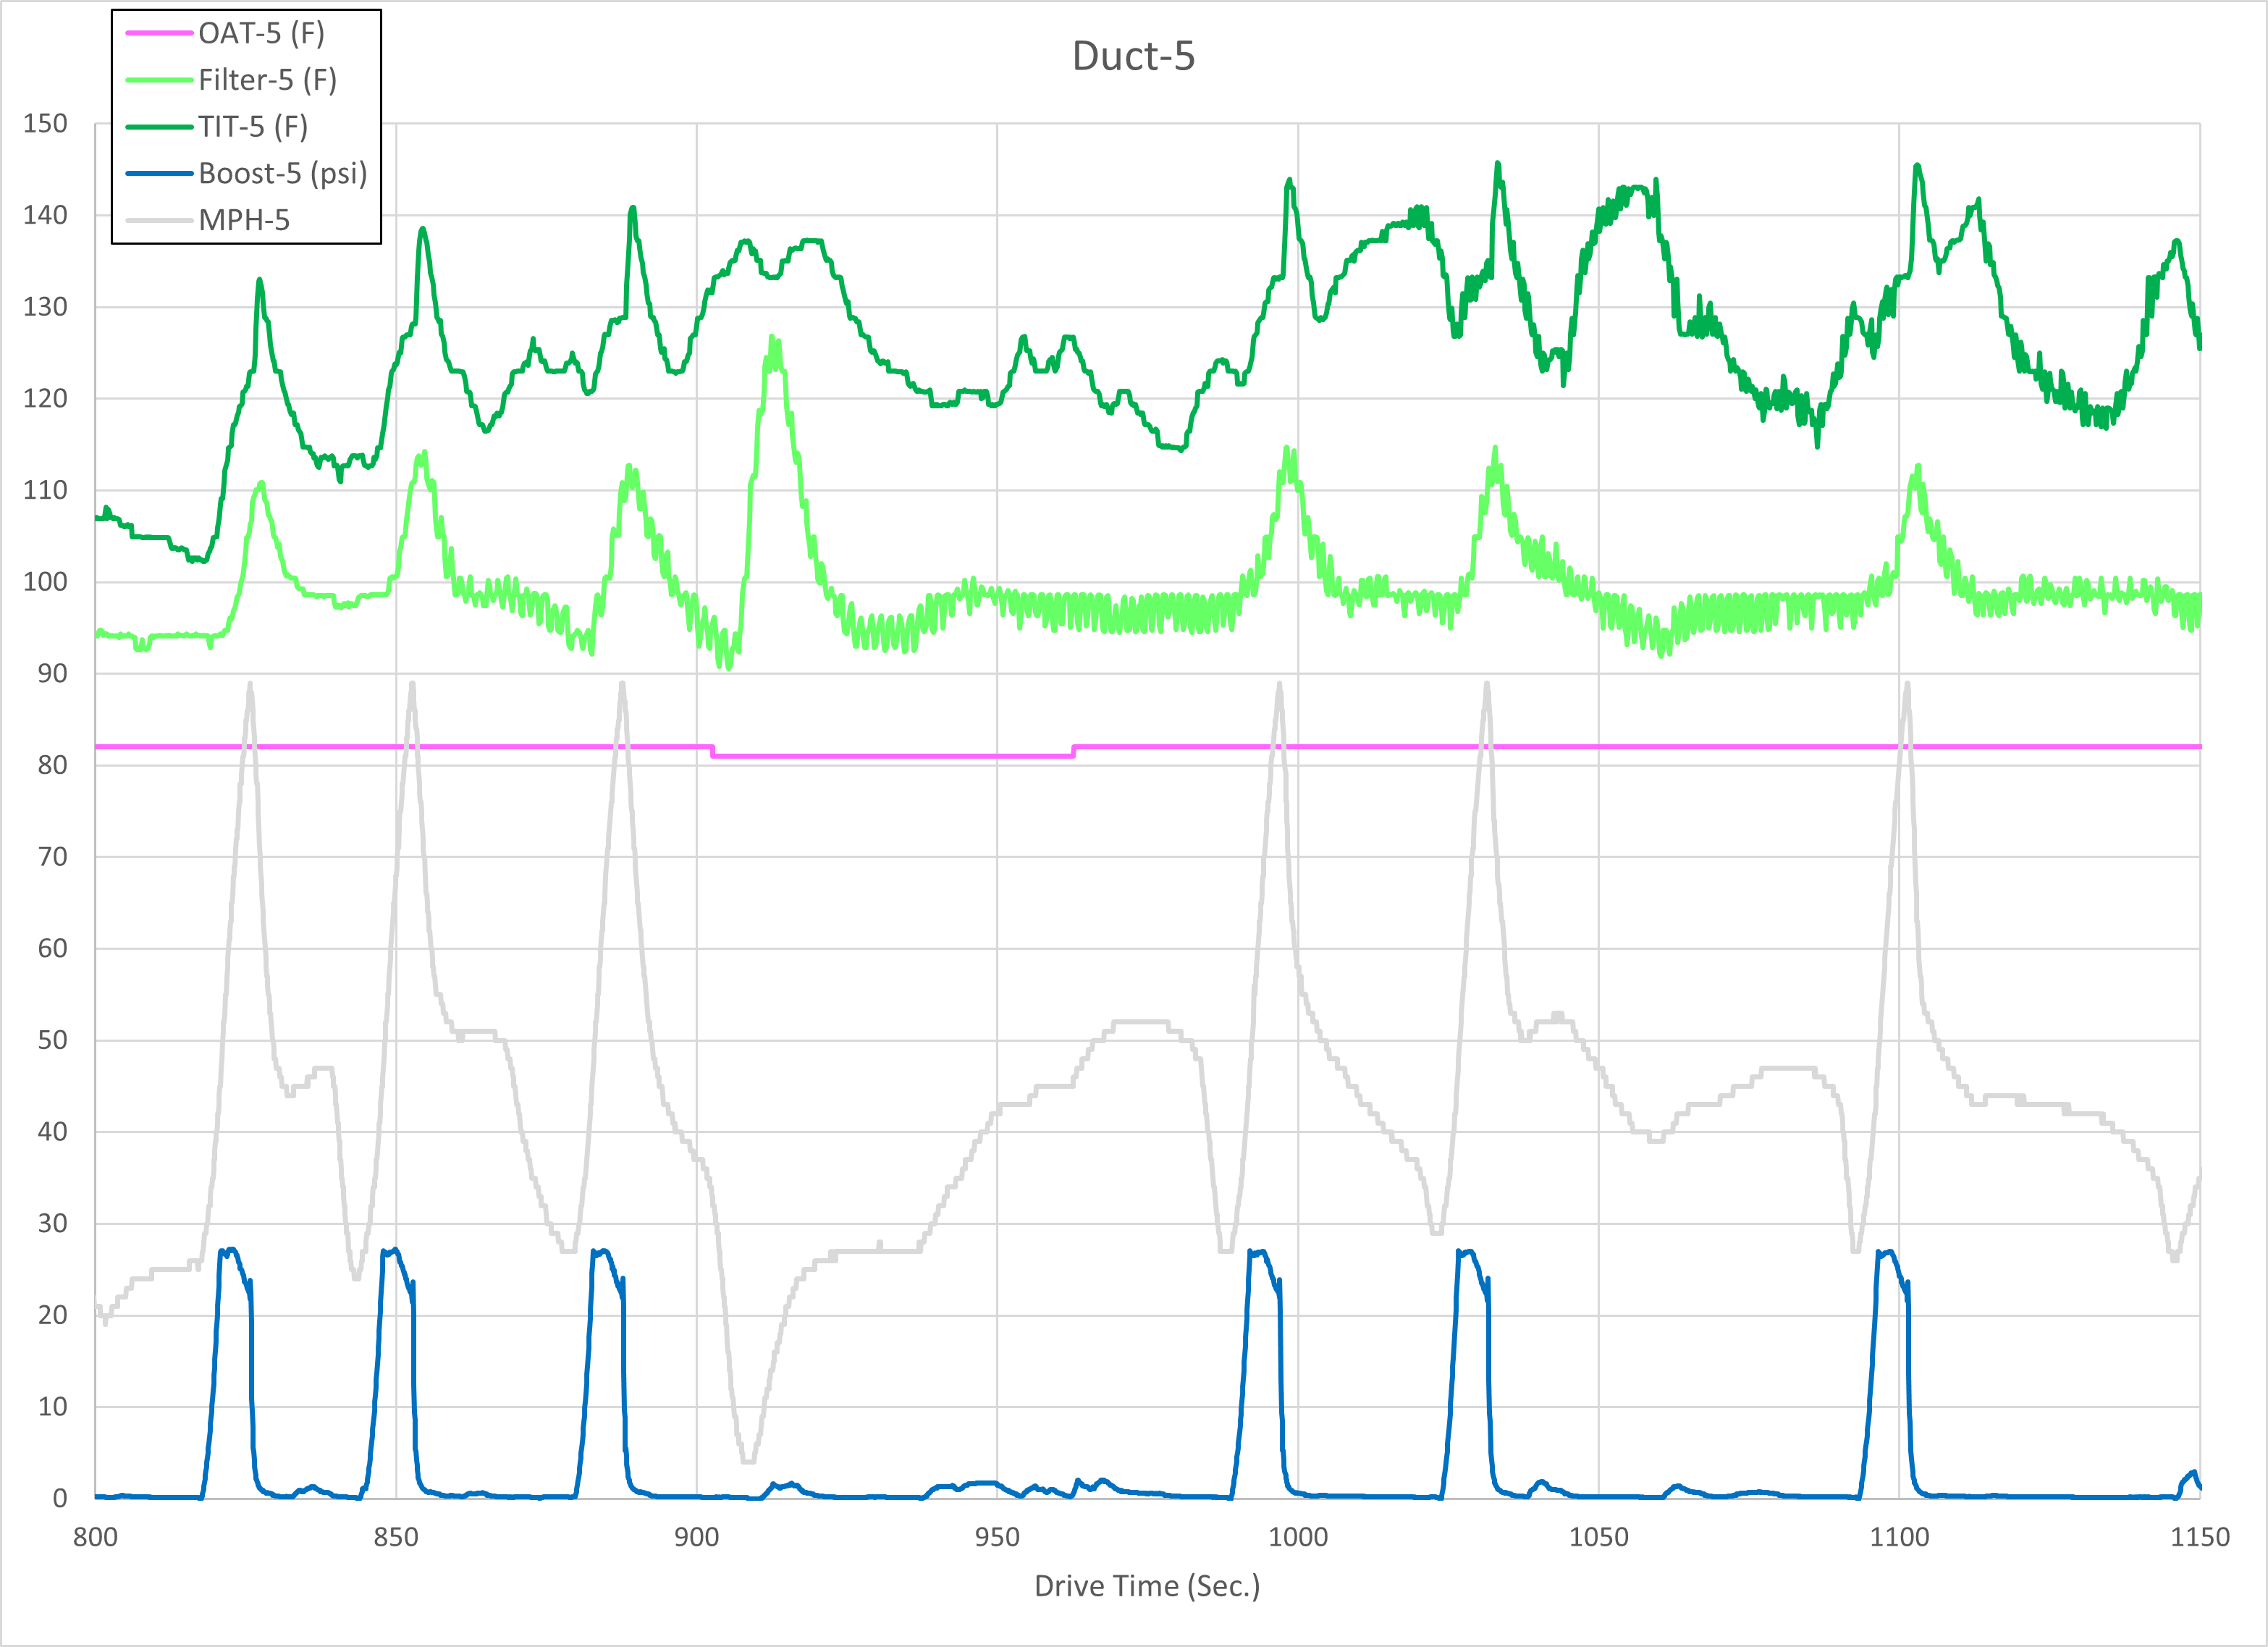
The second chart is a close-up of the time period during which the acceleration data is recorded.
The next chart shows a comparison of the Duct-5 turbo inlet air temperatures with the Duct-4 temperatures for the same period of the test.
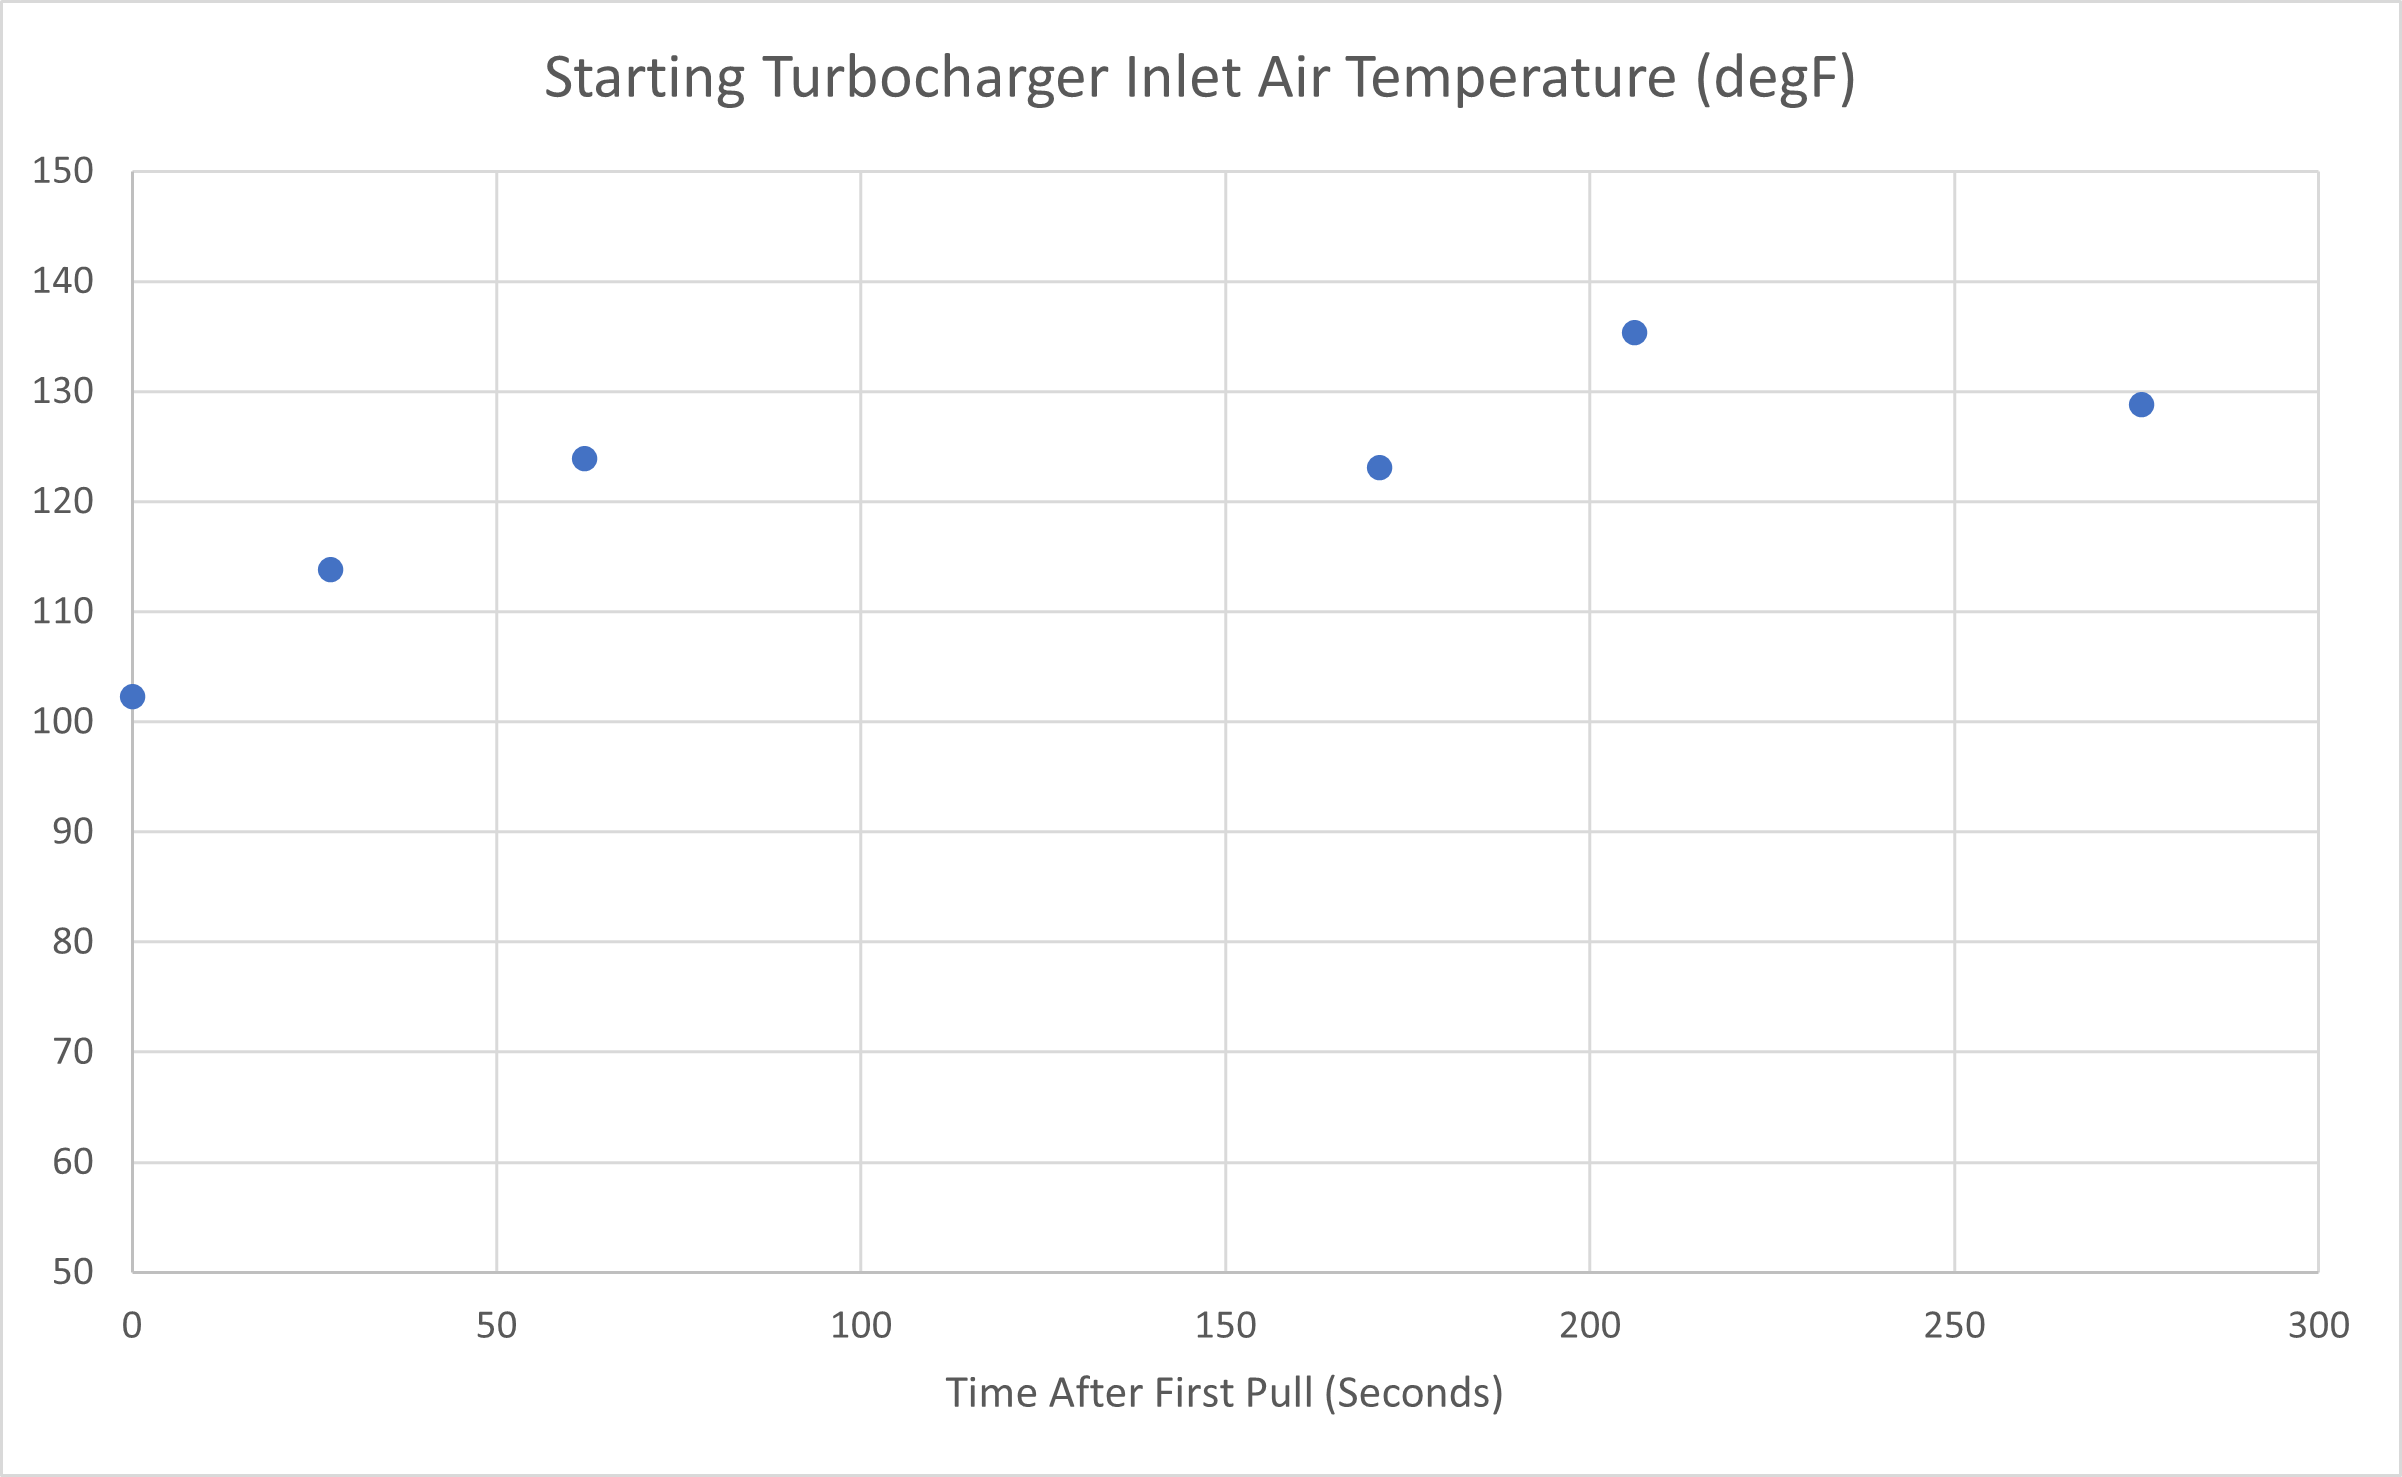
The next chart shows the trend over time of the turbocharger inlet air temperature at the start of each pull using Duct-5.
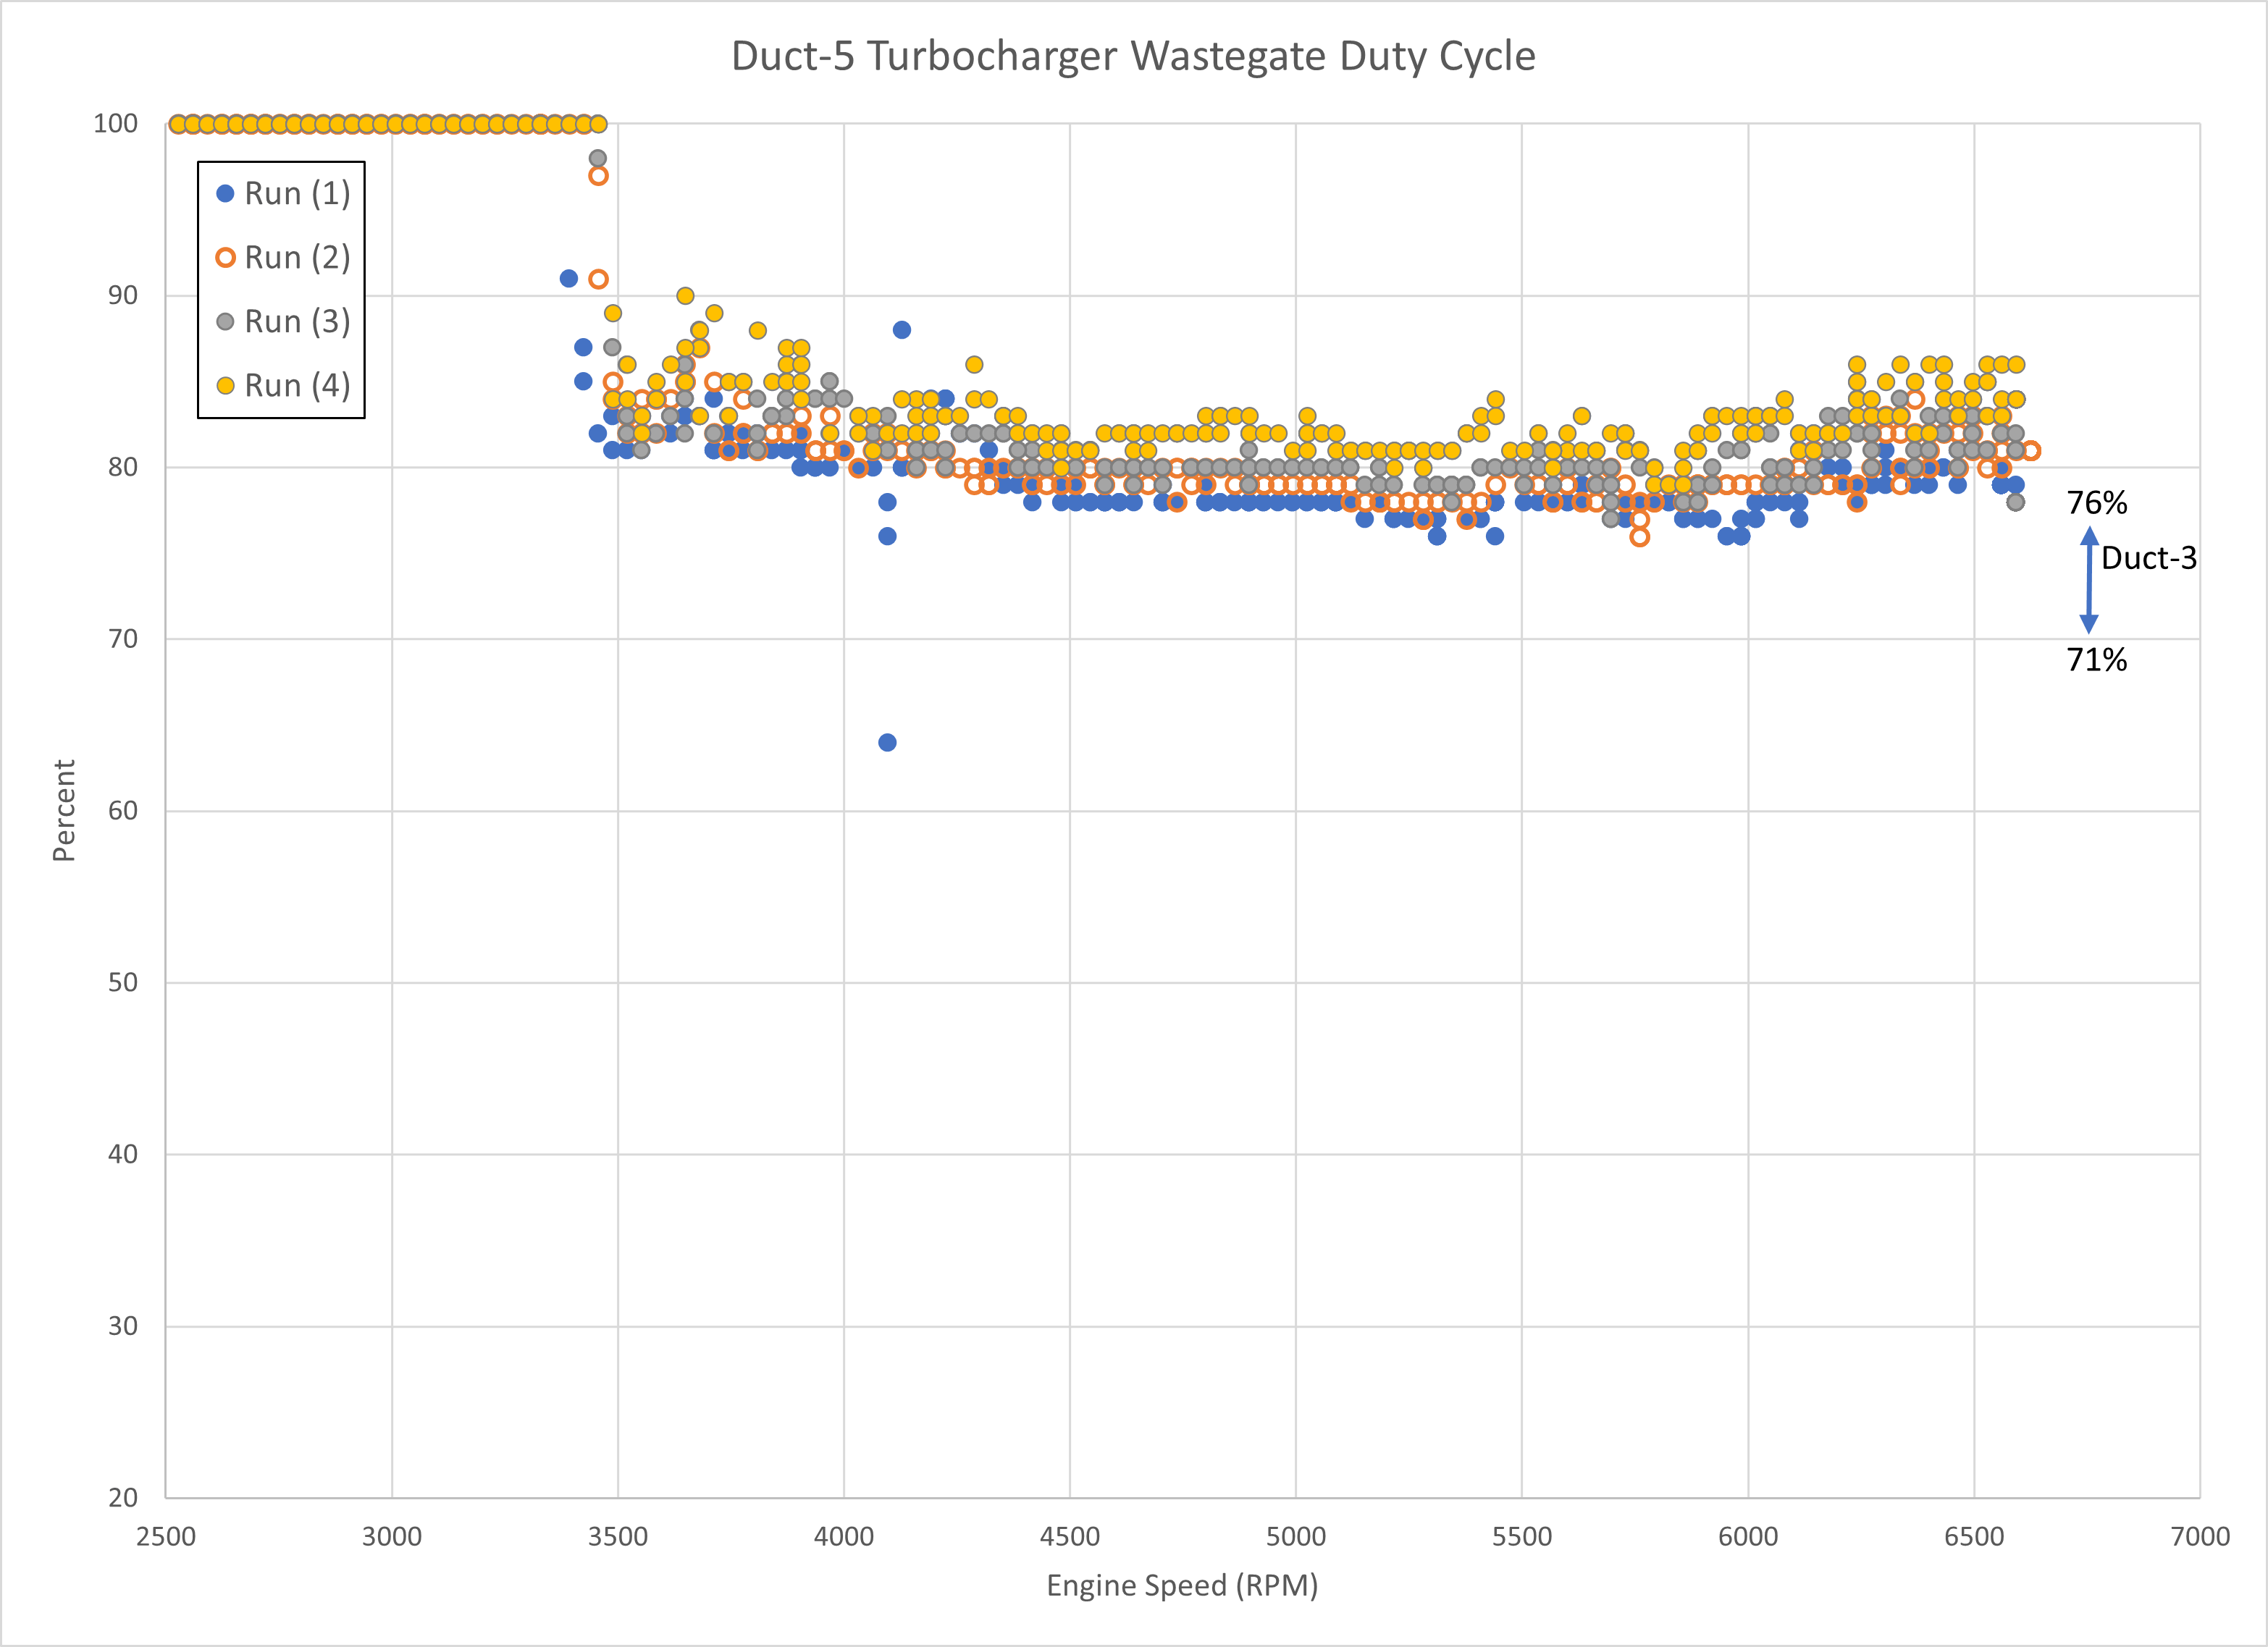
The next chart shows the turbocharger wastegate duty cycle during the first four acceleration periods compared to the range that was measured with Duct-3, which was the same Duct arrangement but with the heat shield installed.
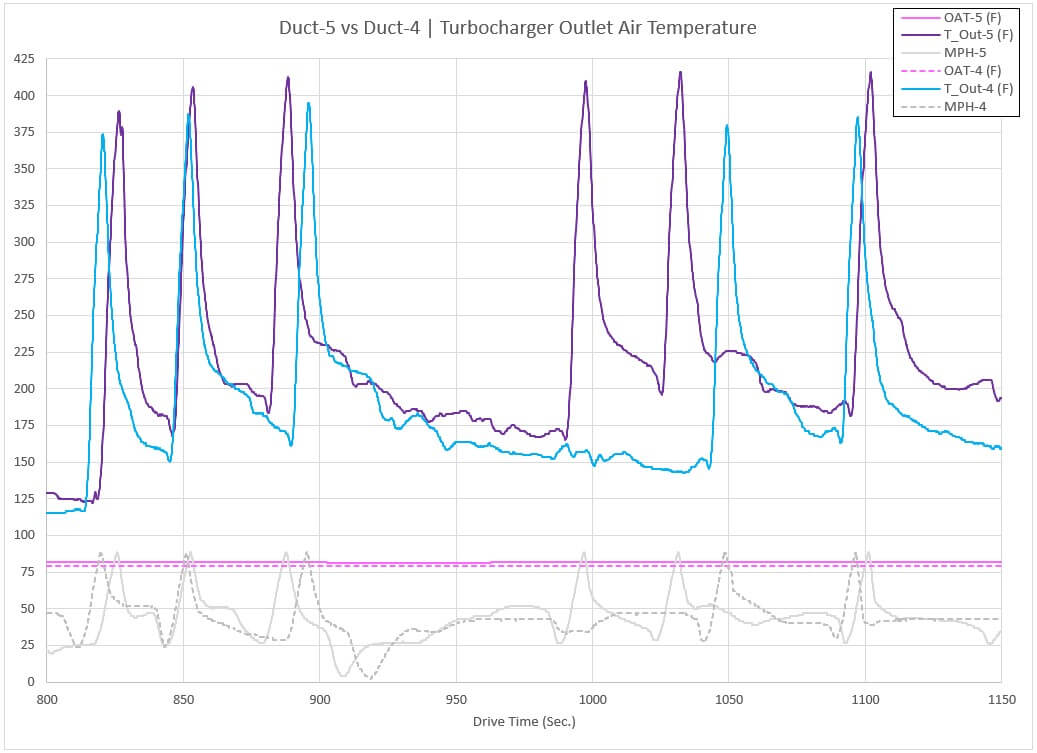
The next chart shows the turbocharger compressor outlet air temperature for each configuration.
Next is a summary chart showing the Turbocharger Inlet Air Temperature minus the Ambient Air Temperature at the start of a pull for each of the configurations that have been tested.
The square marker is the average of the individual data points, represented by the circular markers.

Shown next is the change in the turbocharger inlet air temperature over the duration of a full-throttle acceleration pull.
Again, the square marker is the average of the data points.

The next chart shows the Turbocharger Inlet Air Temperature minus the Ambient Air Temperature at the conclusion of the acceleration pull.

Next is a rough estimate for comparing WHP during the pulls.
Rough is emphasized because the intent of this data collection was not to compare estimated wheel horsepower, and some of the steps to ensure valid data for this comparison were omitted.
Additionally, there are insufficient data points to draw a confident conclusion.

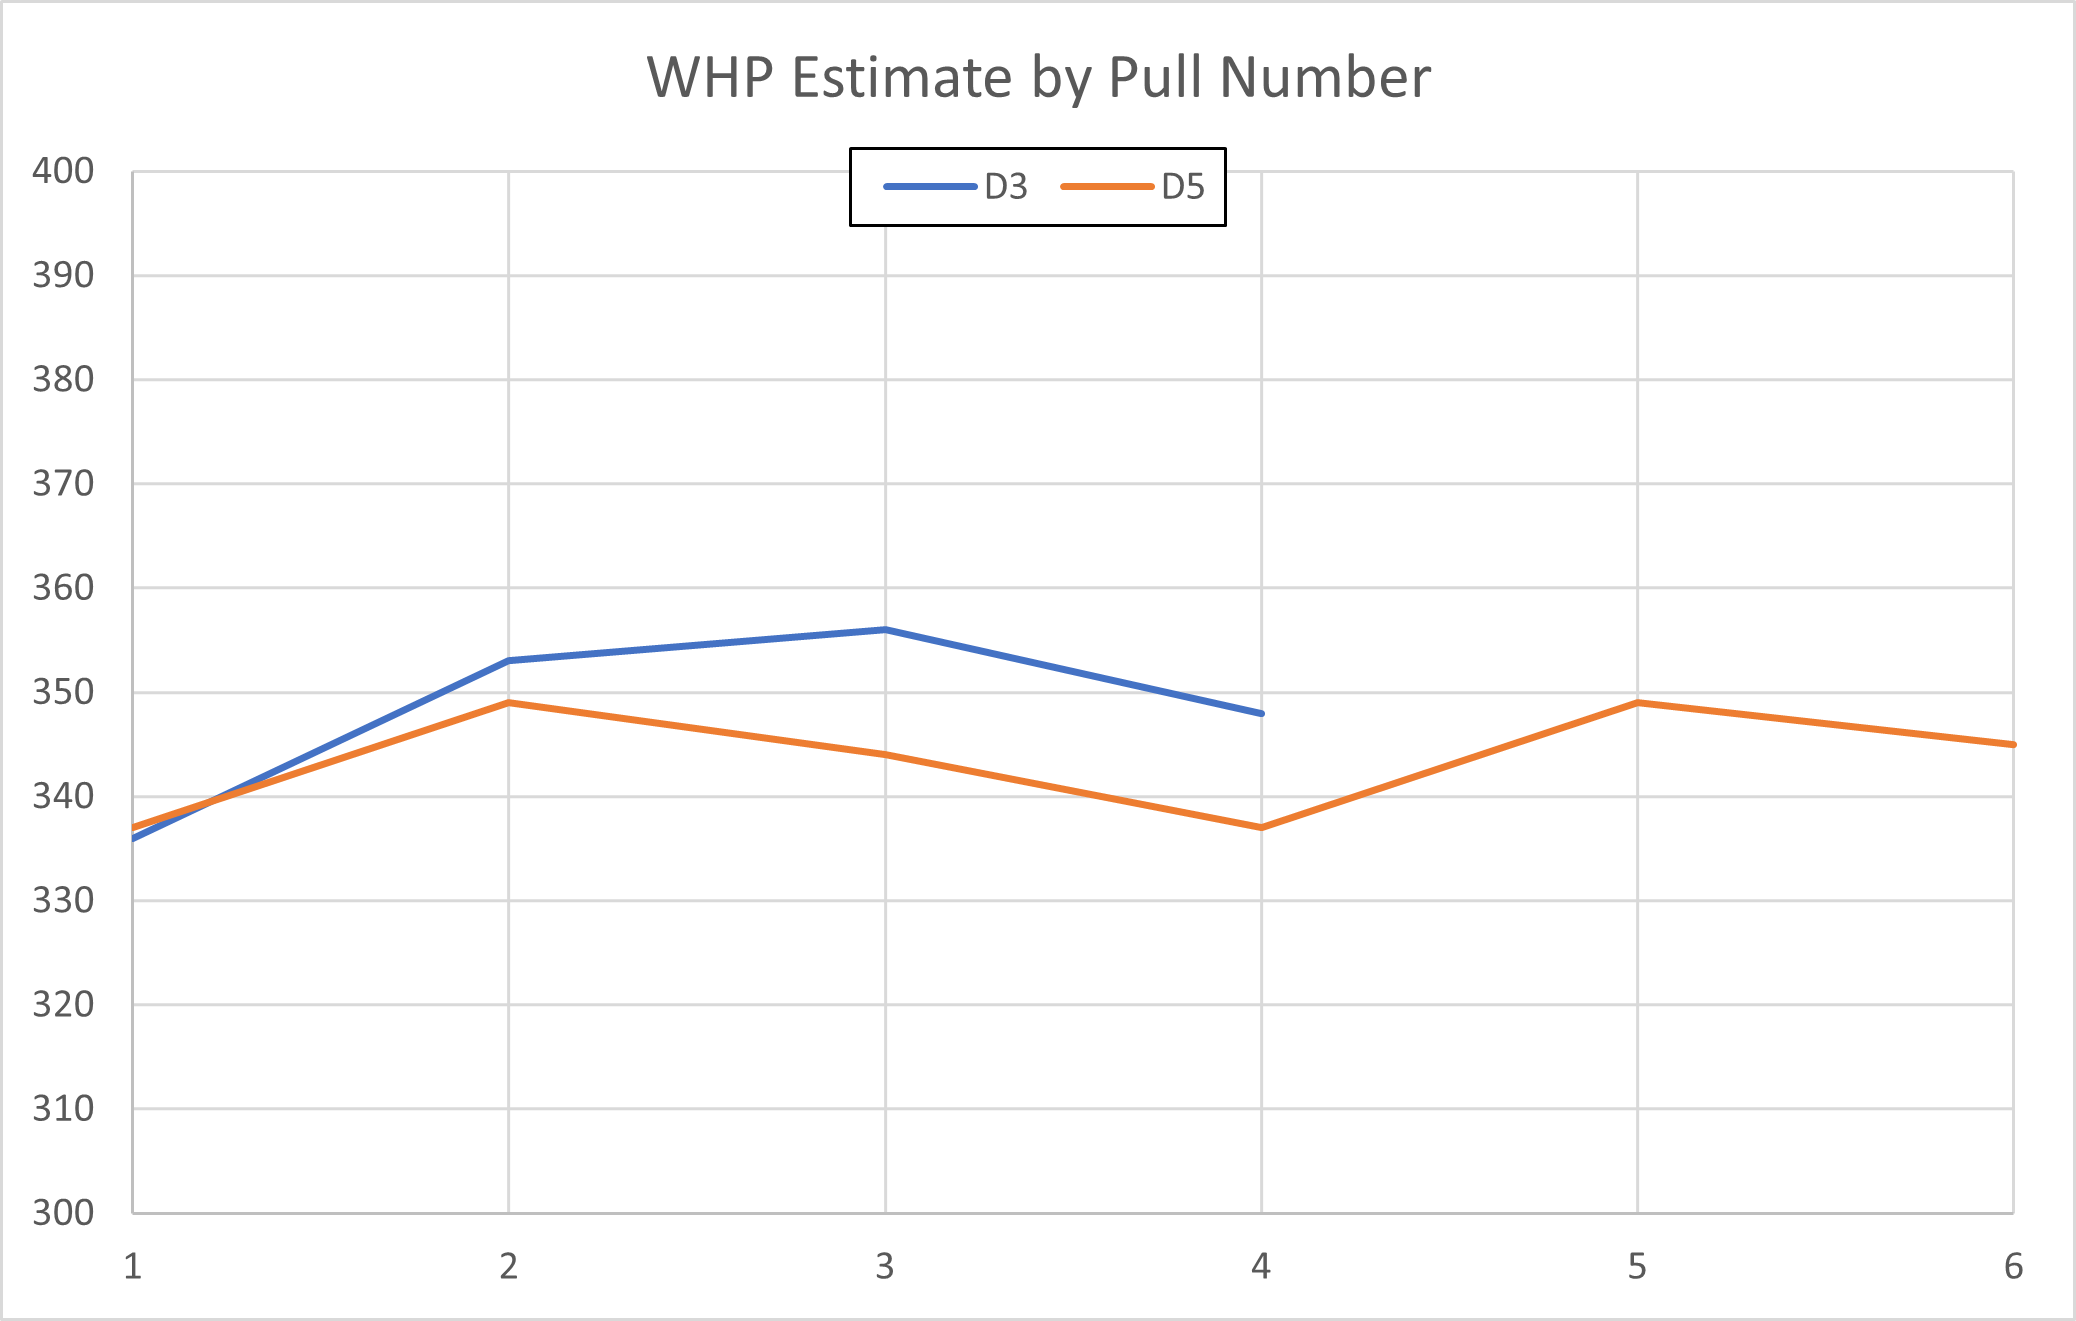
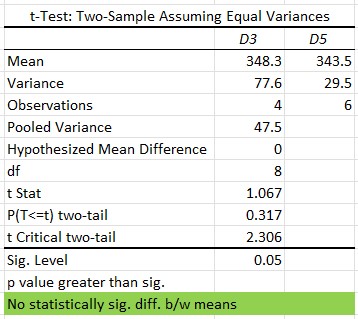
Although the trends are pointing to the shielded intake correlating with higher peak horsepower, the low number of data points and variance in the data don’t support making this conclusion with confidence, as indicated by a t-Test result that the average WHP values are not statistically different.
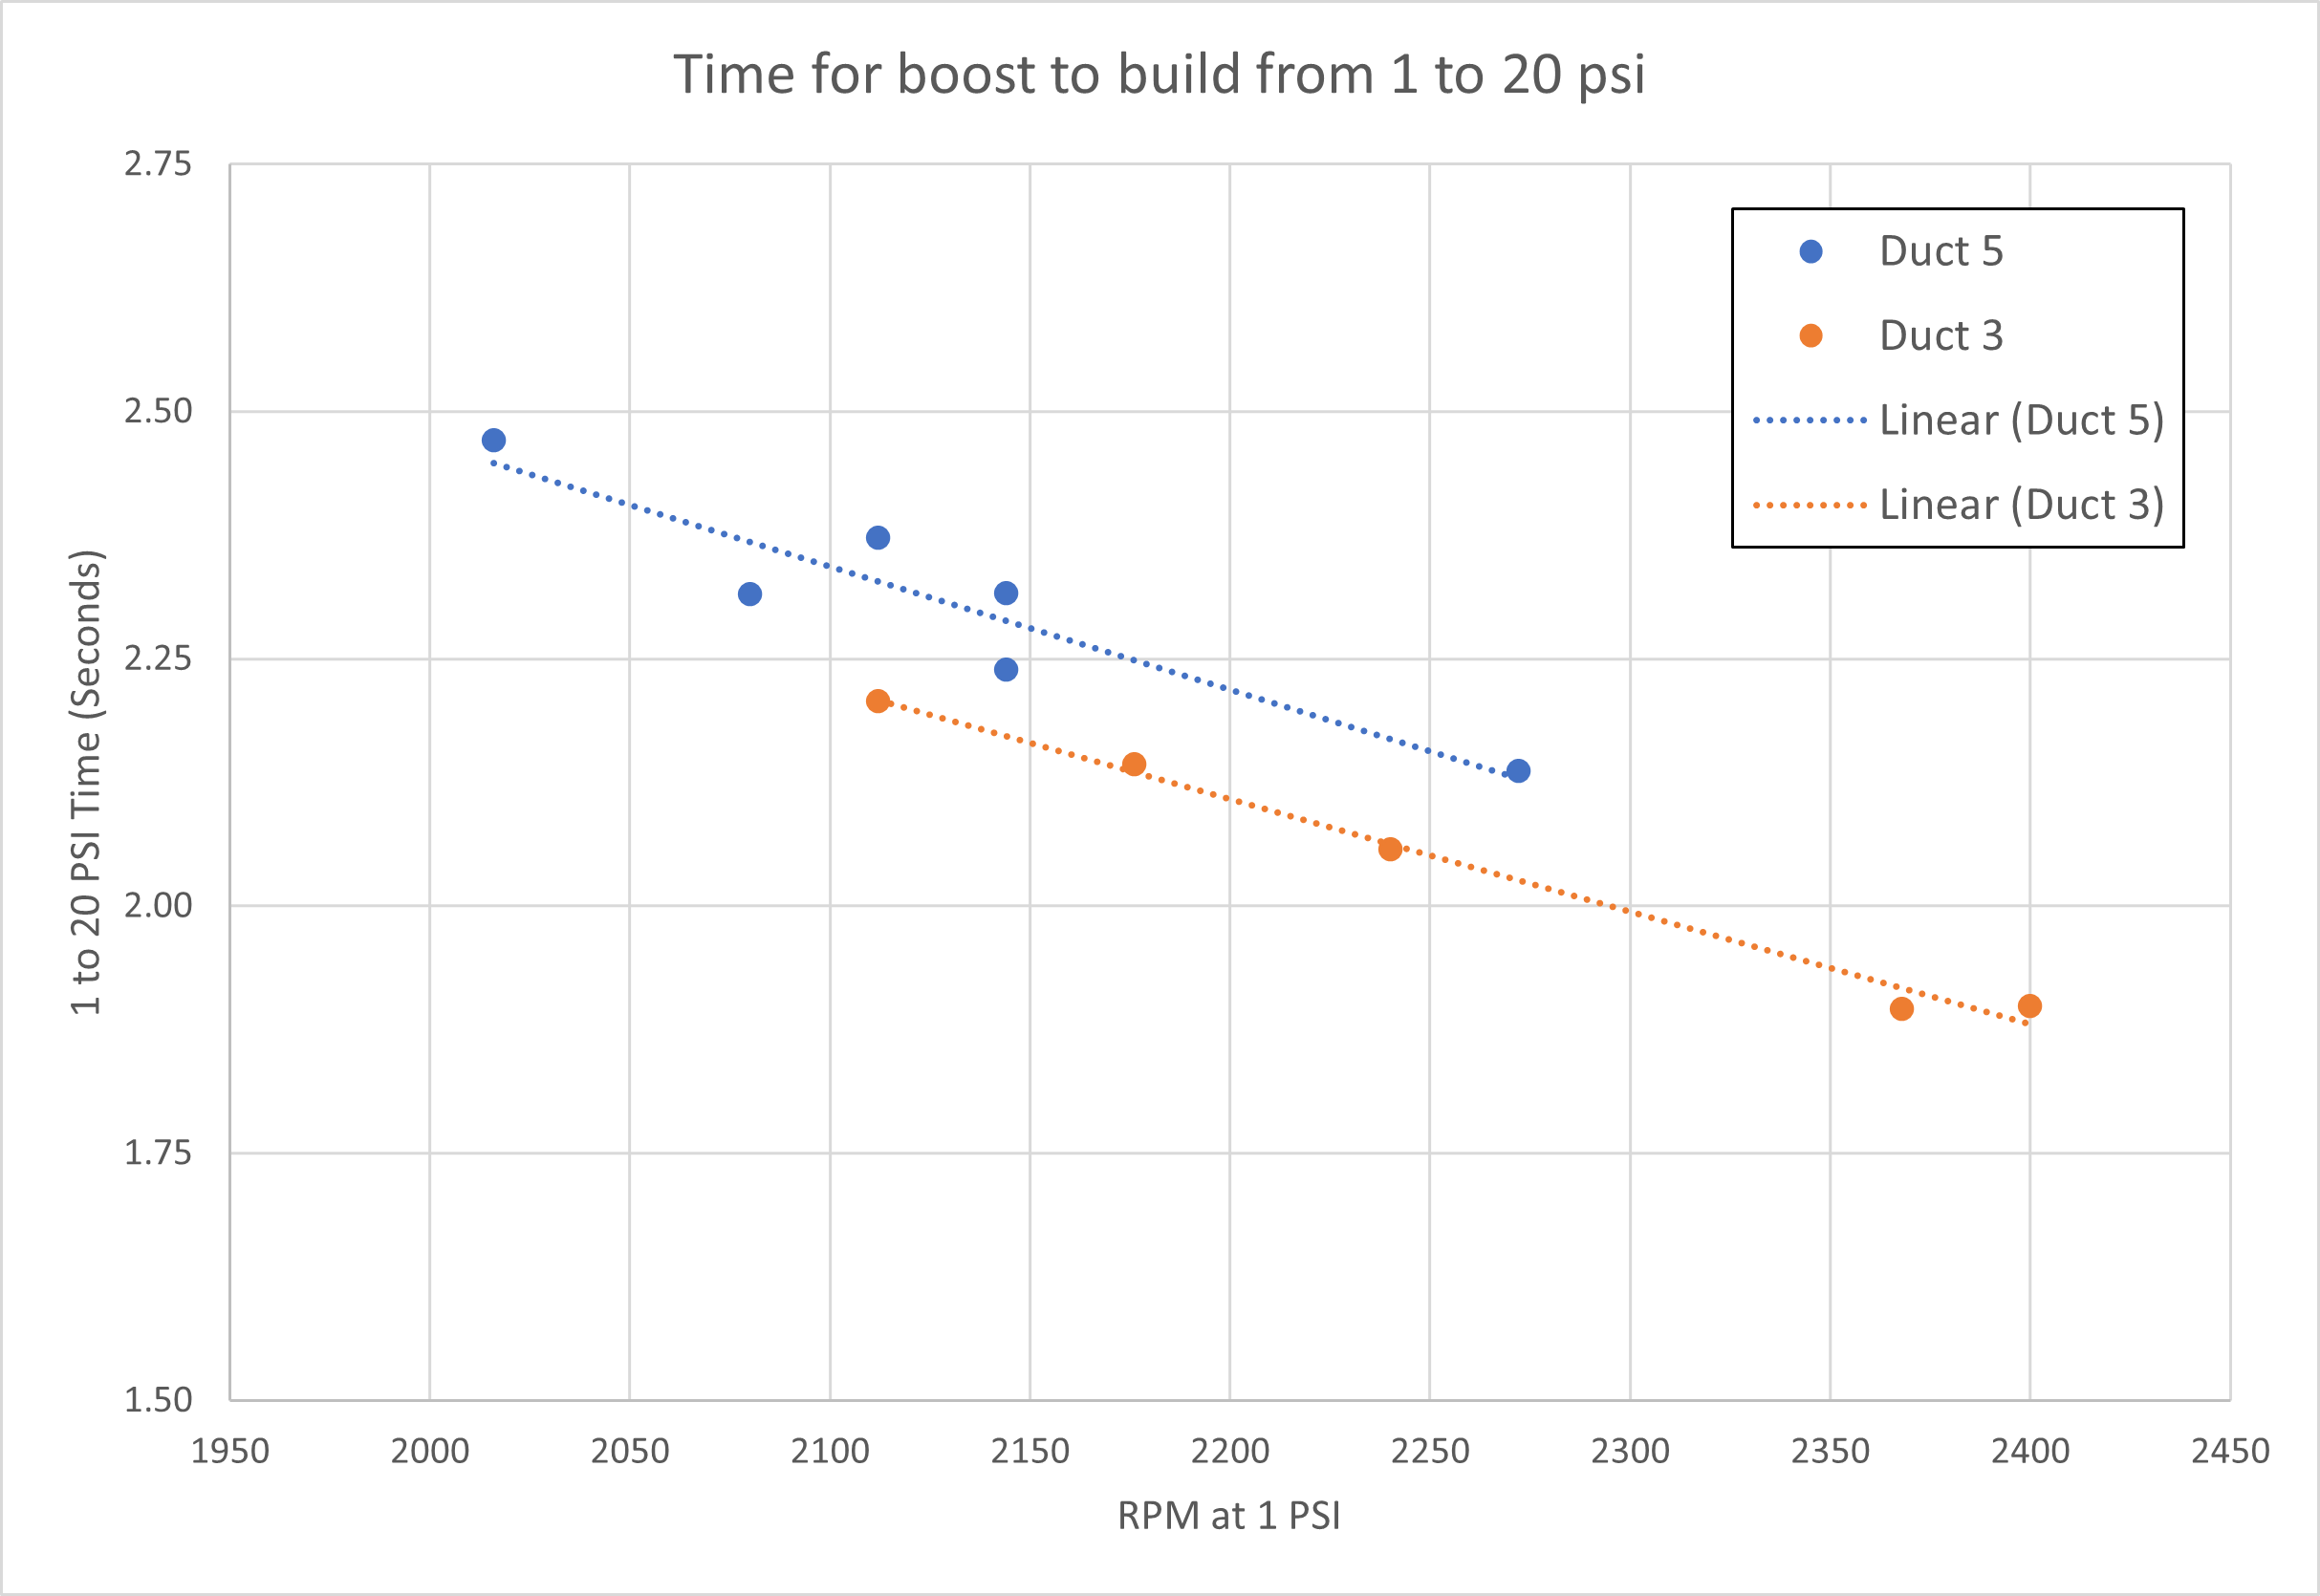
A comparison of the time for boost pressure to build does show the shielded intake correlates with a faster boost response.
Conclusions:
The removal of the CTS Turbo intake shield resulted in measurable changes to air temperature and turbocharger performance.
The Turbocharger inlet air temperature increased by approximately 20-30 degrees Fahrenheit during routine driving.
During acceleration pulls the starting turbo inlet air temperature, temperature rise during the pull, and the final turbo inlet air temperature all increased with the removal of the heat shield.
The turbocharger wastegate duty cycle increased anywhere from ~3% to 17% depending on the pull with the removal of the heat shield.
The turbocharger compressor outlet air temperature also increased, on average by approximately 25 degrees Fahrenheit with the removal of the intake heat shield.
The time for the turbocharger to develop boost pressure was increased by removing the heat shield.
Estimating the GTI’s wheel horsepower was not a planned part of this test and steps to obtain adequate quality measures were not taken. Inconclusive data points to the vehicle possibly having a lower power output when the heat shield is removed.
Data recorded during this test does not support the recommendation to remove the heat shield if increasing system performance is a goal.
In looking at the data between D1 and D5, if someone wanted to keep approximately the same intake temps, they could alter the duct and then remove the heat shield. I don’t why anyone would want to do that but it could explain the suggestion I suppose.
The case with the heat shield removed (D5) is using the duct configuration with the driver’s side open and the back of the passenger side is blocked off. If the duct was unmodified and the shield removed, I suspect that would generate higher temperatures than any of the configurations I tested.