
Background:
Recently I reinstalled the stock intercooler on my Mk7 GTI. After making a series of pulls I compared the results with data I have measured using two different aftermarket intercooler setups.
The first comparison is with an aftermarket Front Mount intercooler (FMIC). This is the Vibrant 12810 IC used in the Baun Performance kit that I street-tested last year.
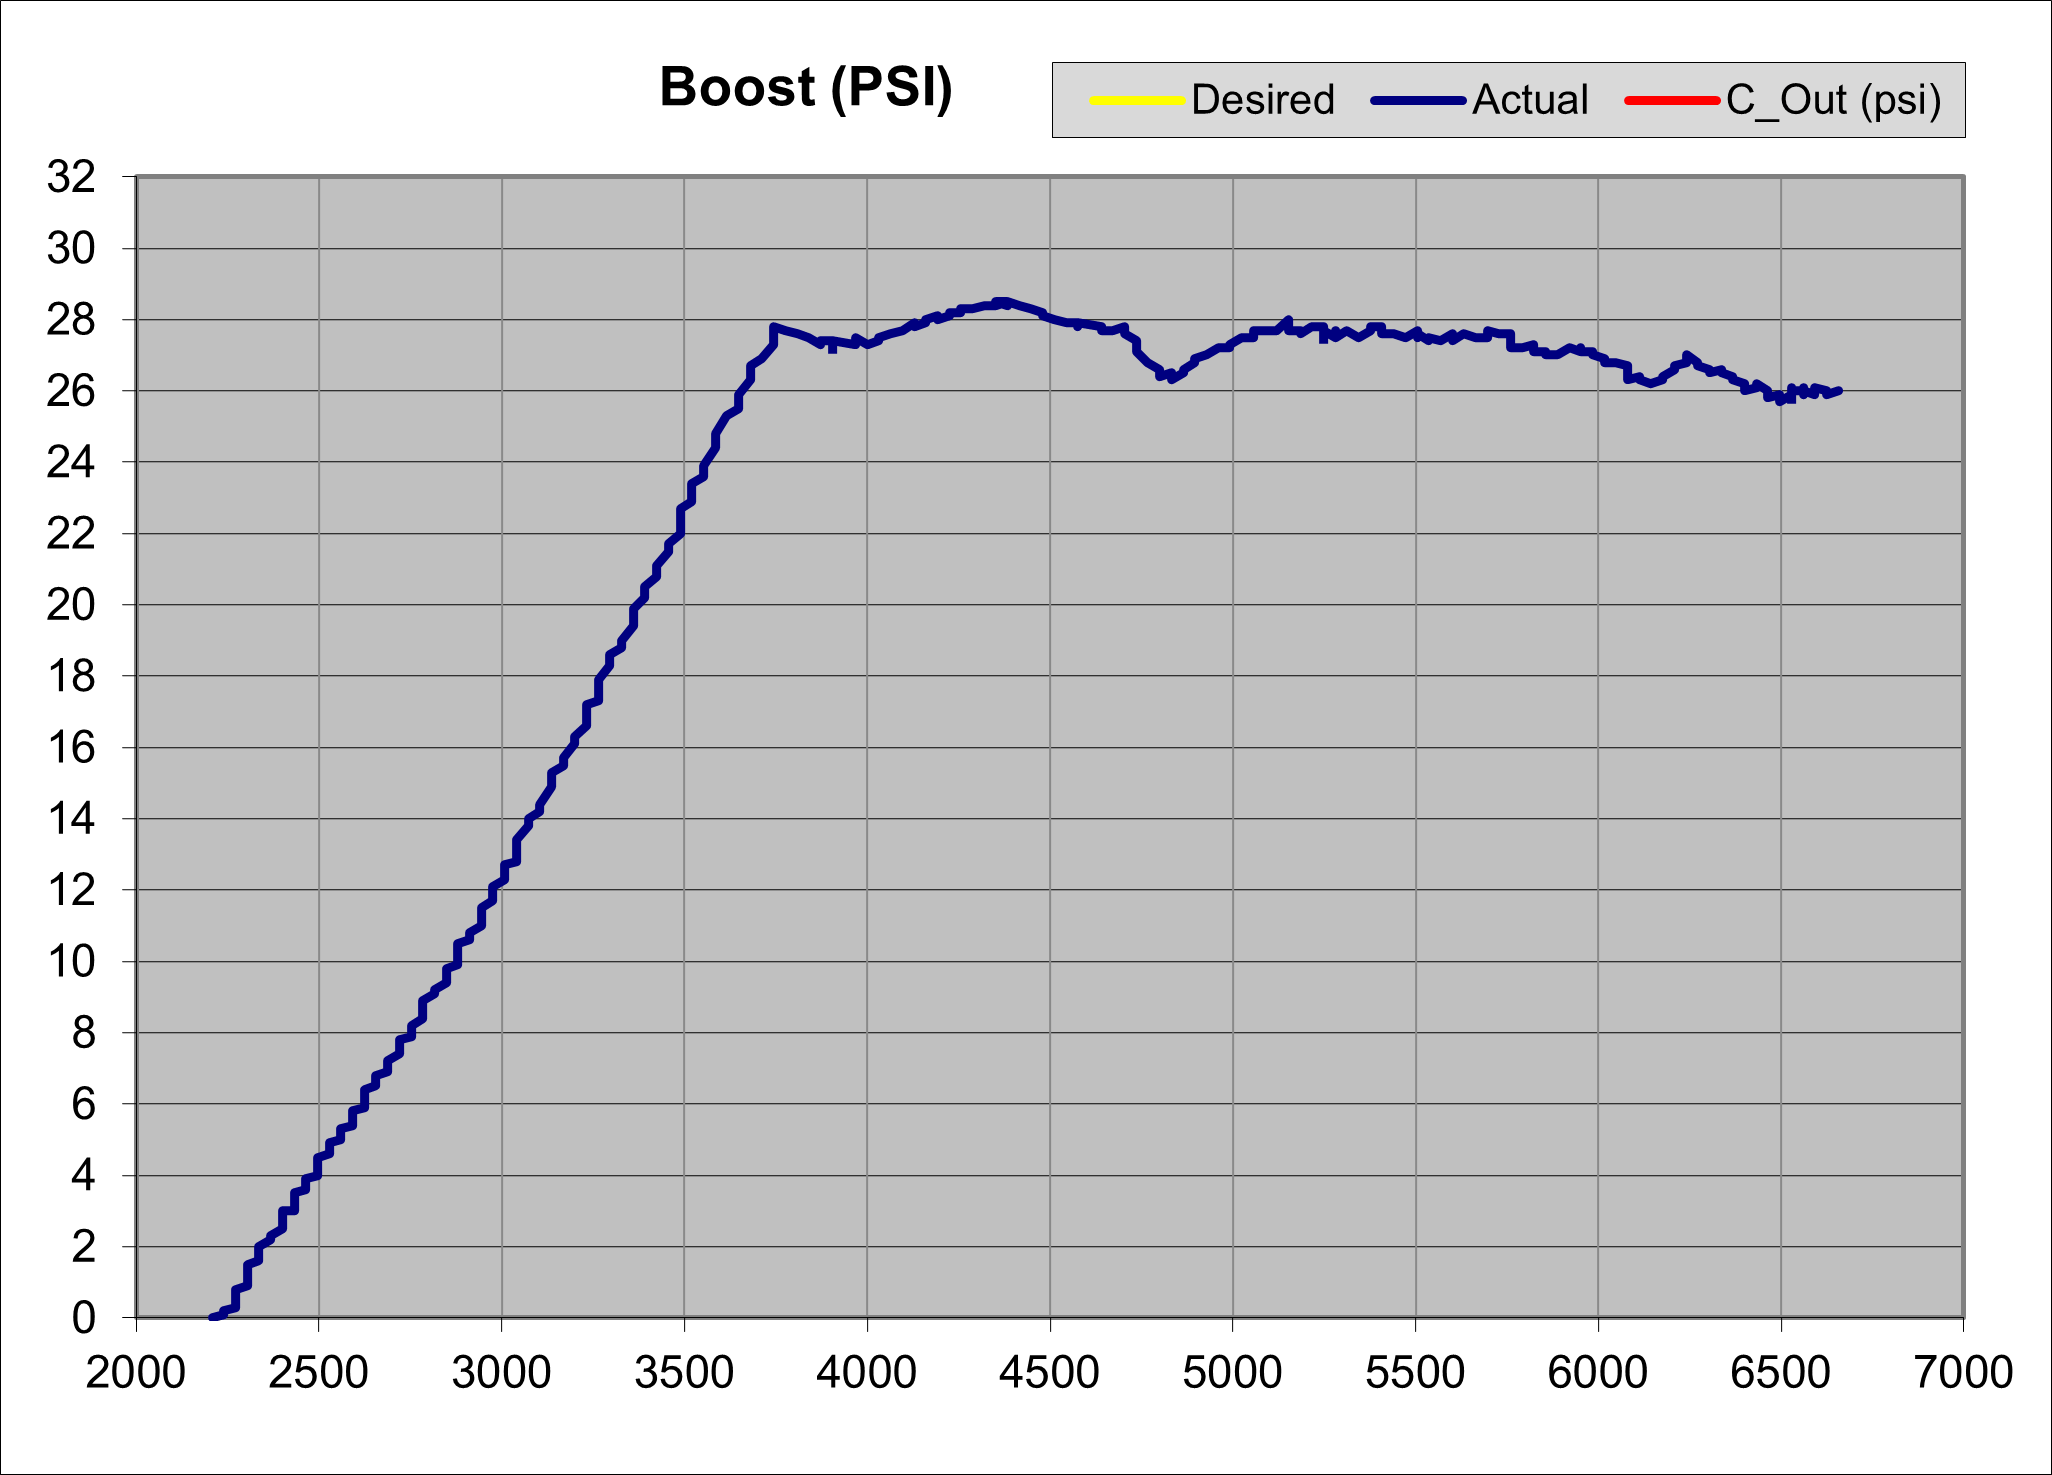
In this comparison when the GTI is equipped with the stock IC it is operating using an E30 tune. The boost profile with this tune is shown below:
The data using the Vibrant FMIC is while using a 93-octane tune that holds slightly less boost pressure.
The second comparison is against a bicooler configuration using an AMS Performance stock location intercooler and a G-Plus FMIC.
Both sets of data that are compared in this case are with the IS38 turbo-equipped GTI using the E30 tune.
Measurement process:
In each case, the GTI is operating in third gear during full-throttle acceleration. The on-boost period begins around 2000-2500 RPM and ends around 6500 RPM.
A series of full-throttle periods are repeated after a short time out of boost.
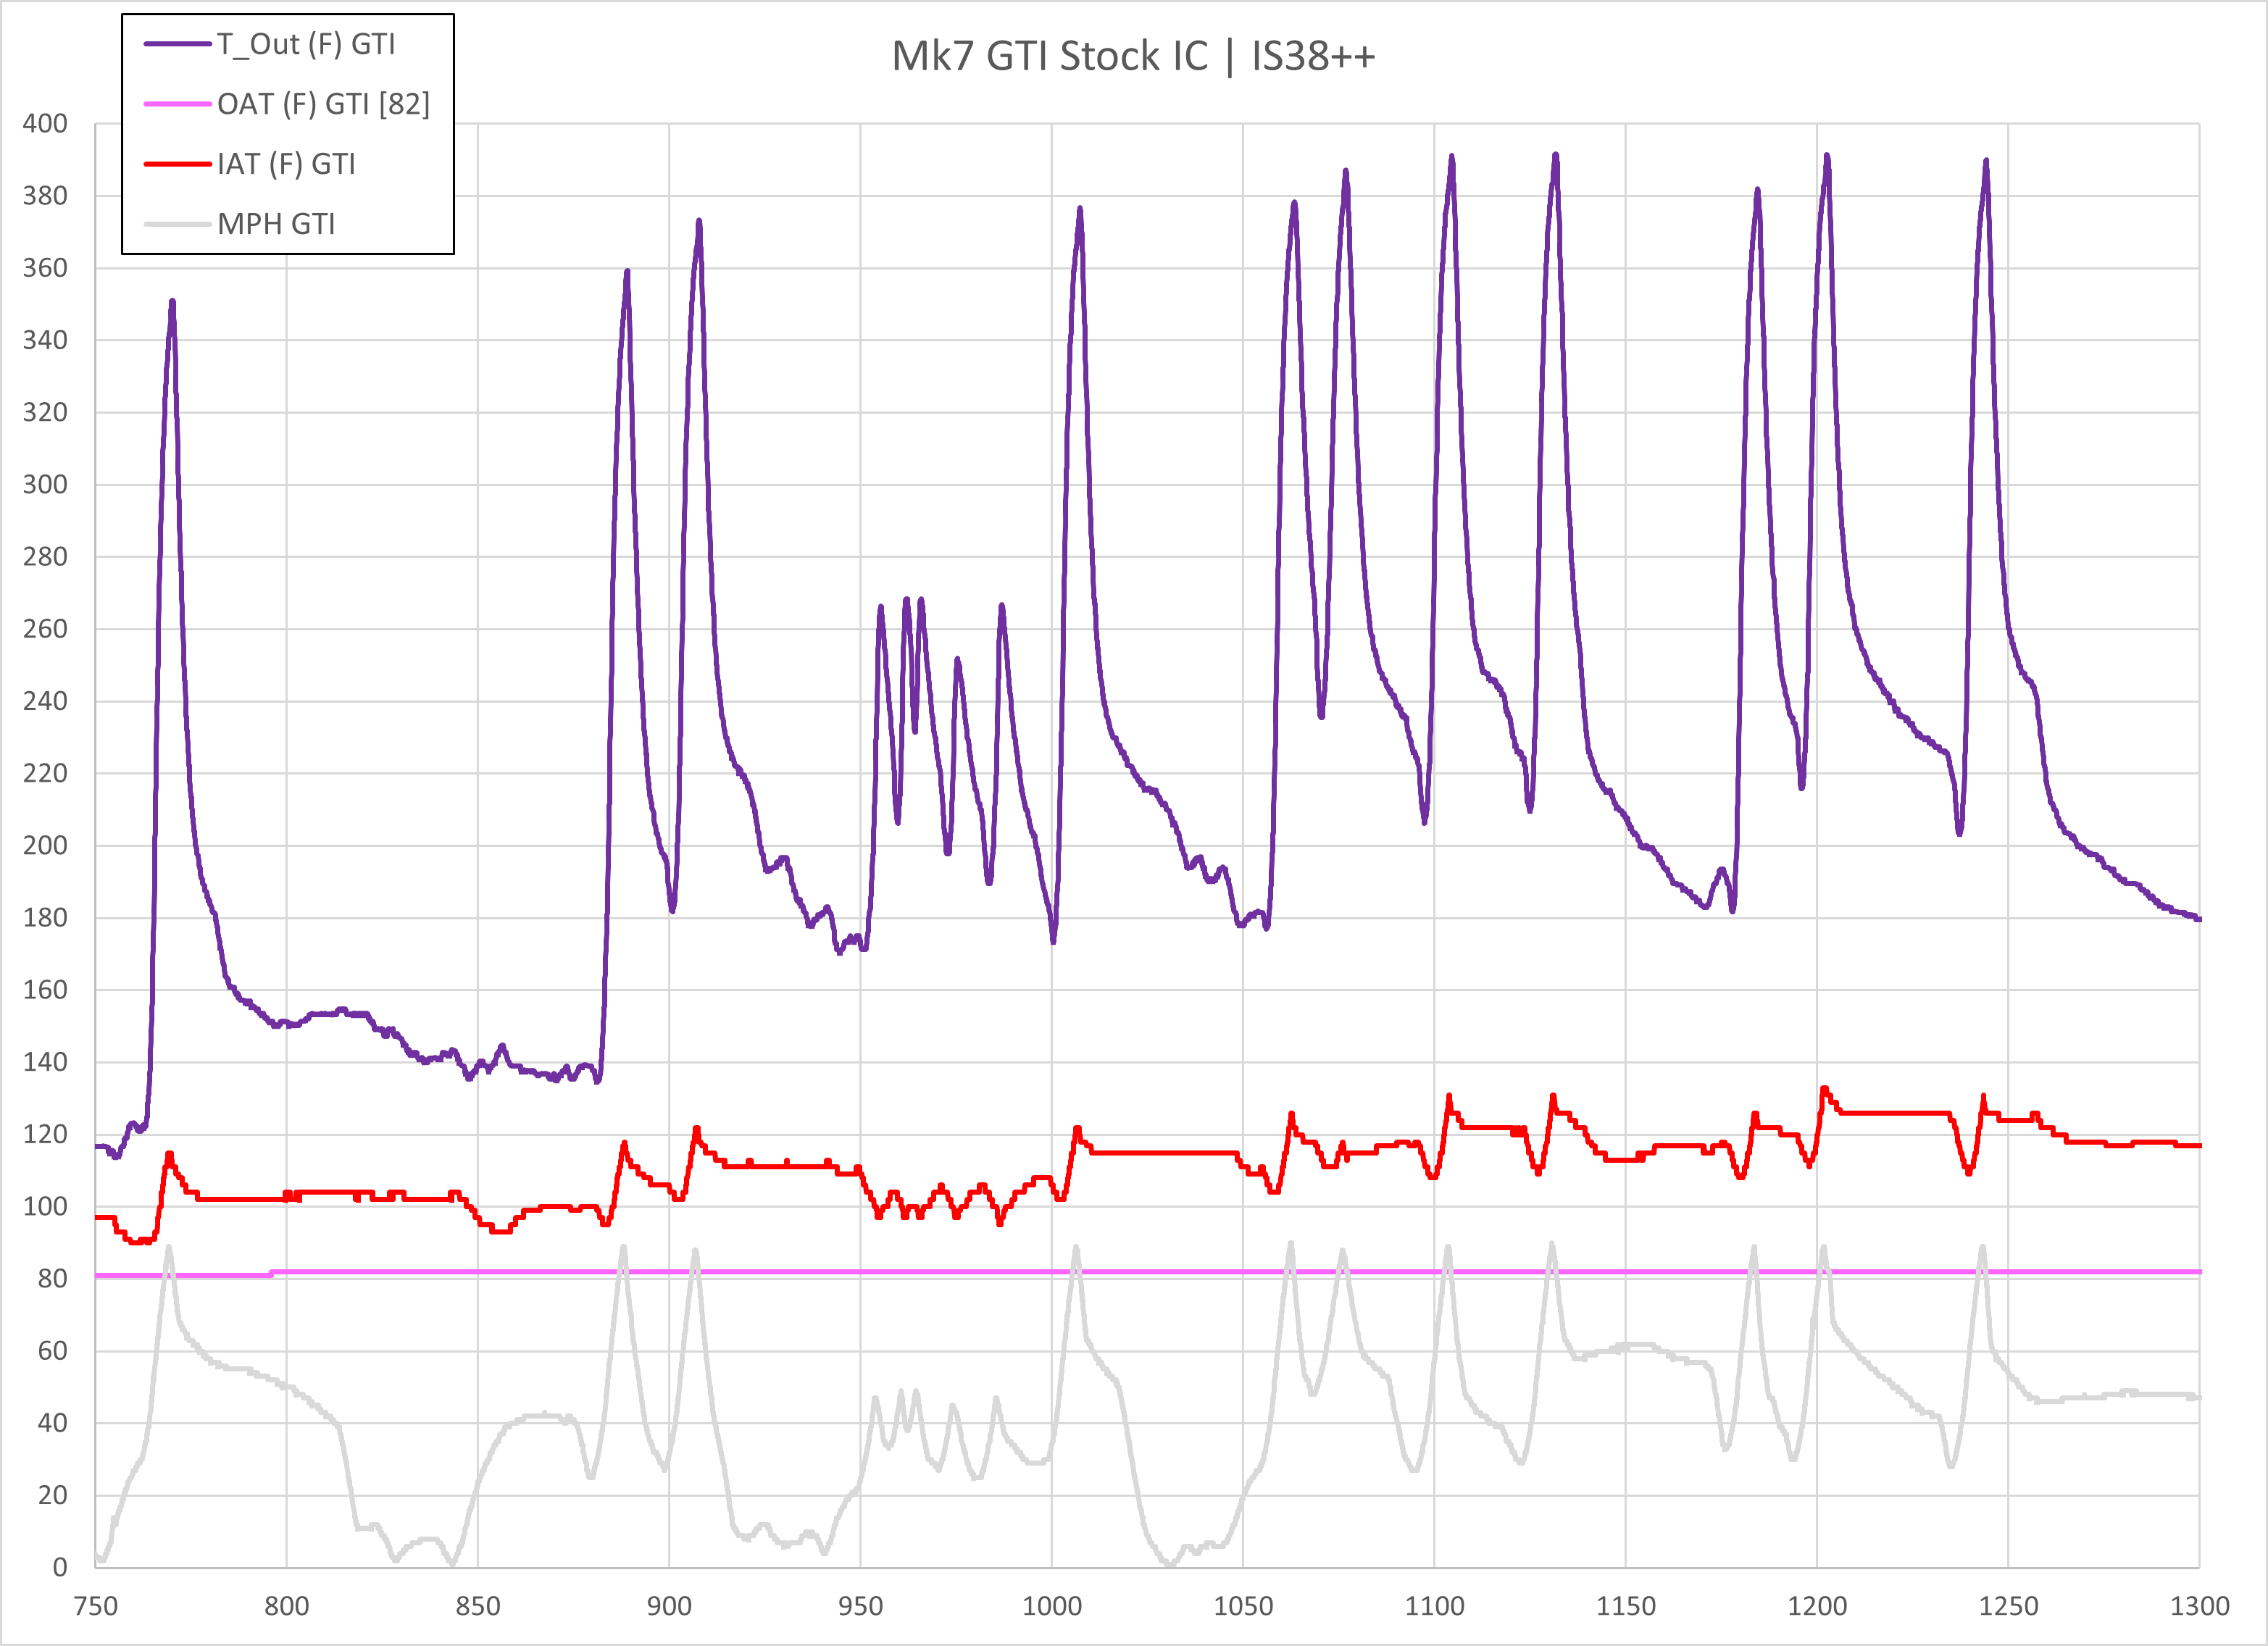
An overview of the relevant portion of the data collection session during which eleven (11) pulls are made is shown below:
Results:
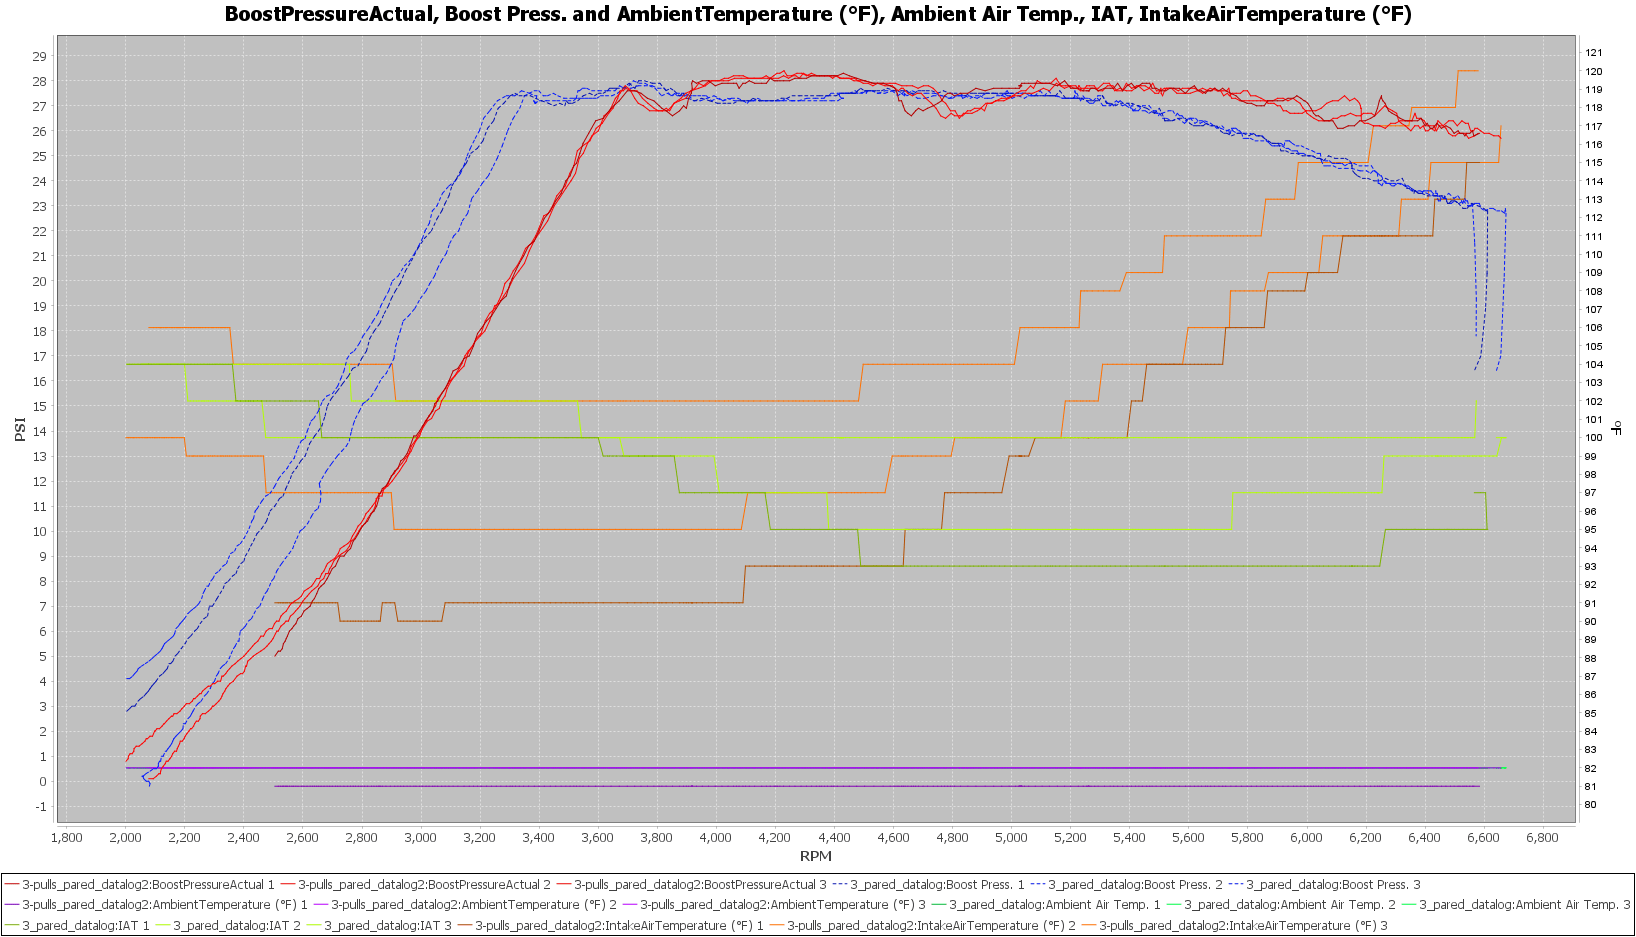
The chart below shows a comparison of the boost pressure, intake air temperature, and ambient air temperature when operating with the stock IC and the FMIC.
The red line is the E30 tune boost pressure and the blue line is the 93-octane tune. Ambient air temperature is very similar for each case. The intake air temperature rises more quickly with the stock GTI IC after approximately 4500 RPM.
The next chart shows the bigger picture, of how much each intercooler is cooling the air exiting the turbocharger.
The turbocharger compressor outlet air temperature is shown with the purple and light blue lines that peak between 375 and 400 degrees Fahrenheit.
The red and orange lines show the Intake Air Temperature (IAT) at the intake manifold.
When IAT is viewed in context with the compressor outlet air temperature the differences between the two types of intercoolers are less dramatic.
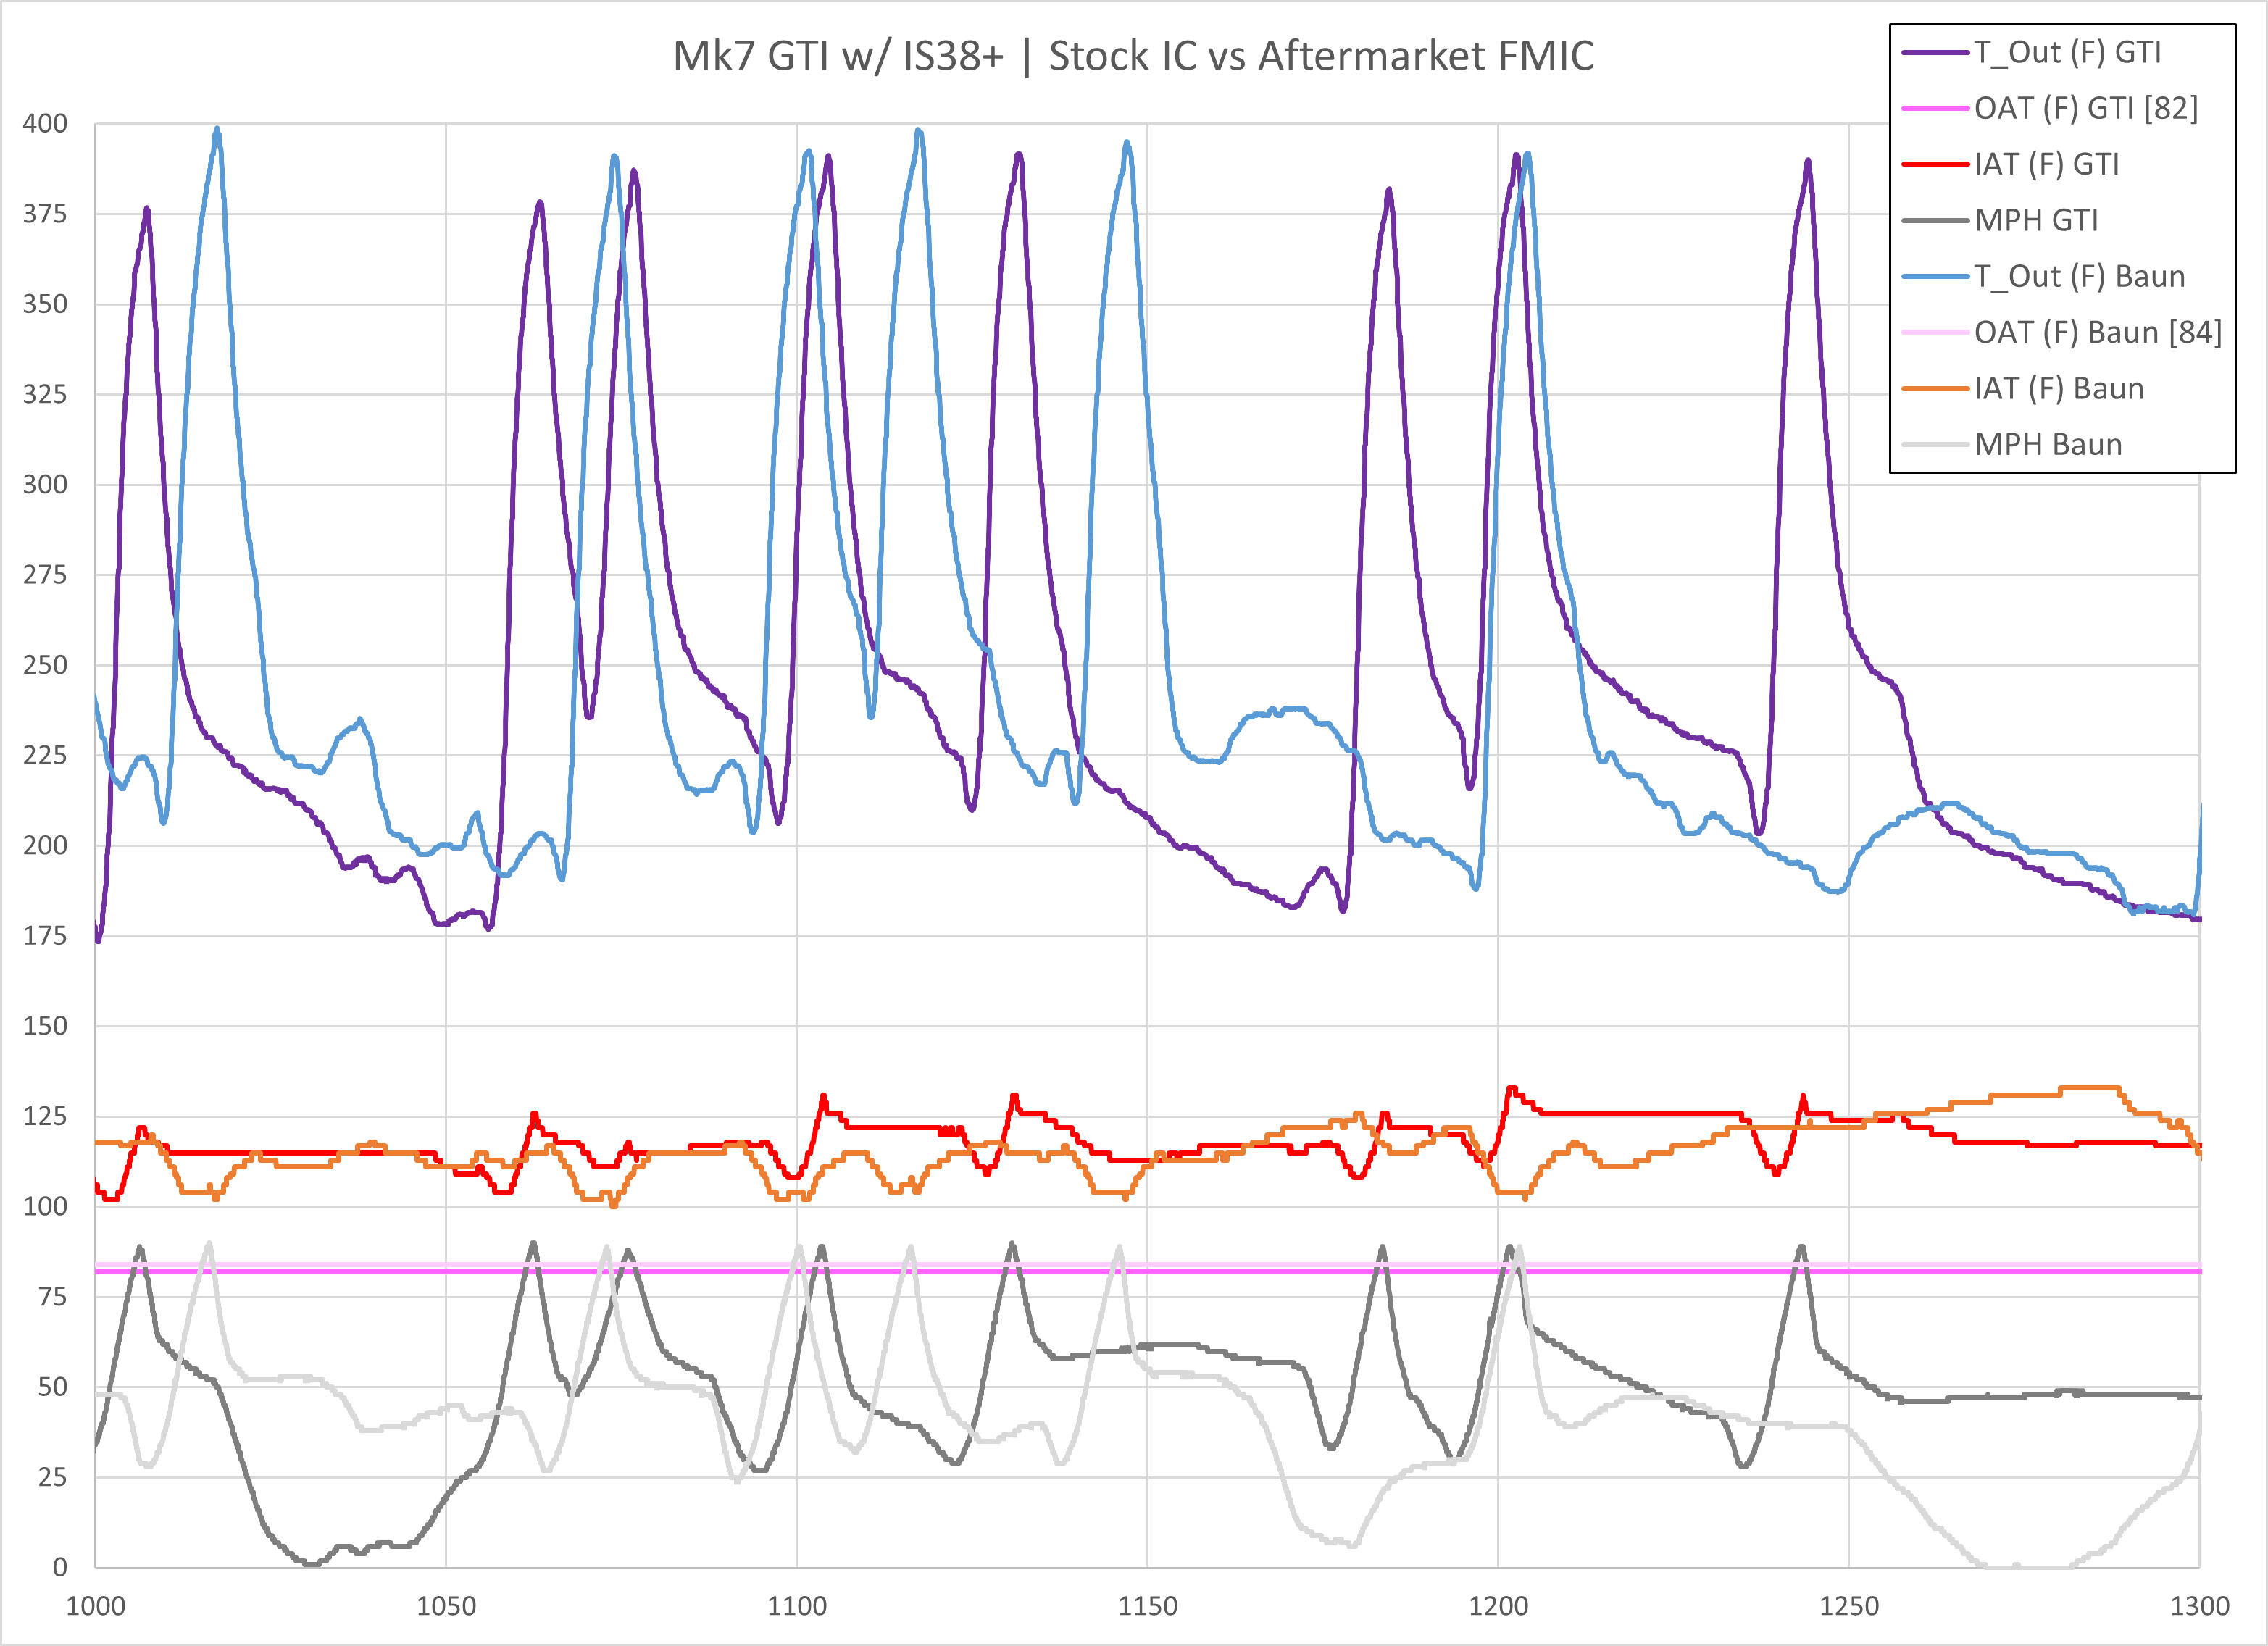
Note: Eight pulls are shown for the stock GTI IC and six pulls are shown for the FMIC.
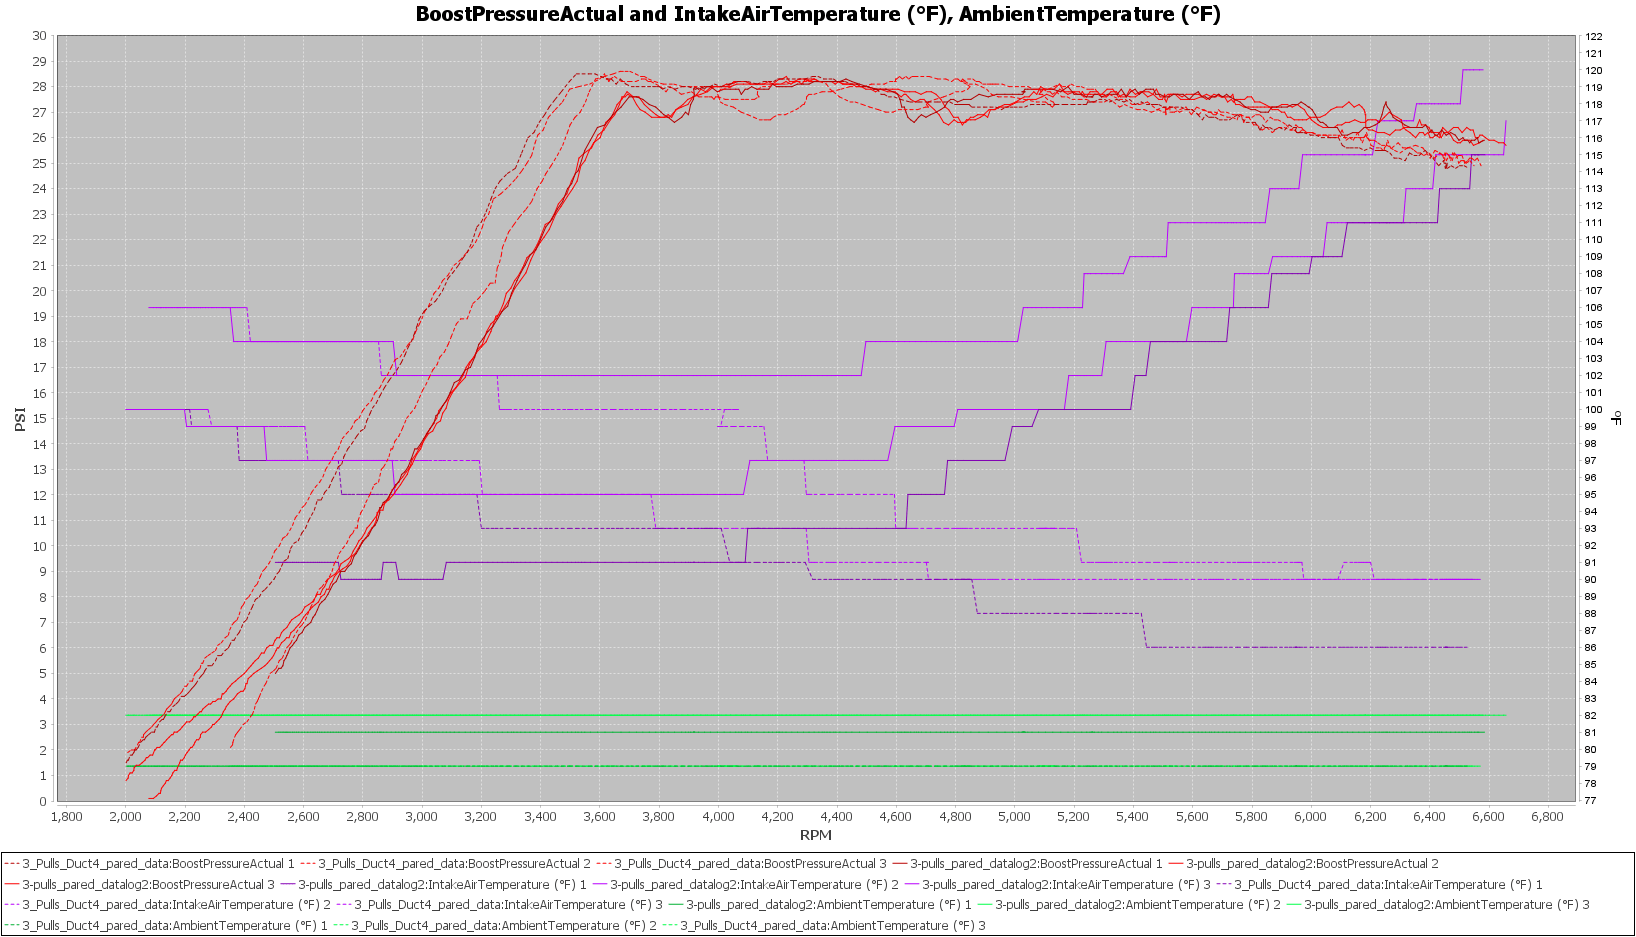
The next chart compares Boost Pressure, Intake Air Temperature, and Ambient Air Temperature between the stock GTI IC and the AMS/G-Plus bicooler.
With both configurations using the E30 tune the boost profiles are very similar. Again the ambient air temperature is similar for each configuration. The bicooler IAT shows a steady decrease as the pull progresses while the stock IC IAT begins to increase after ~4600 RPM.
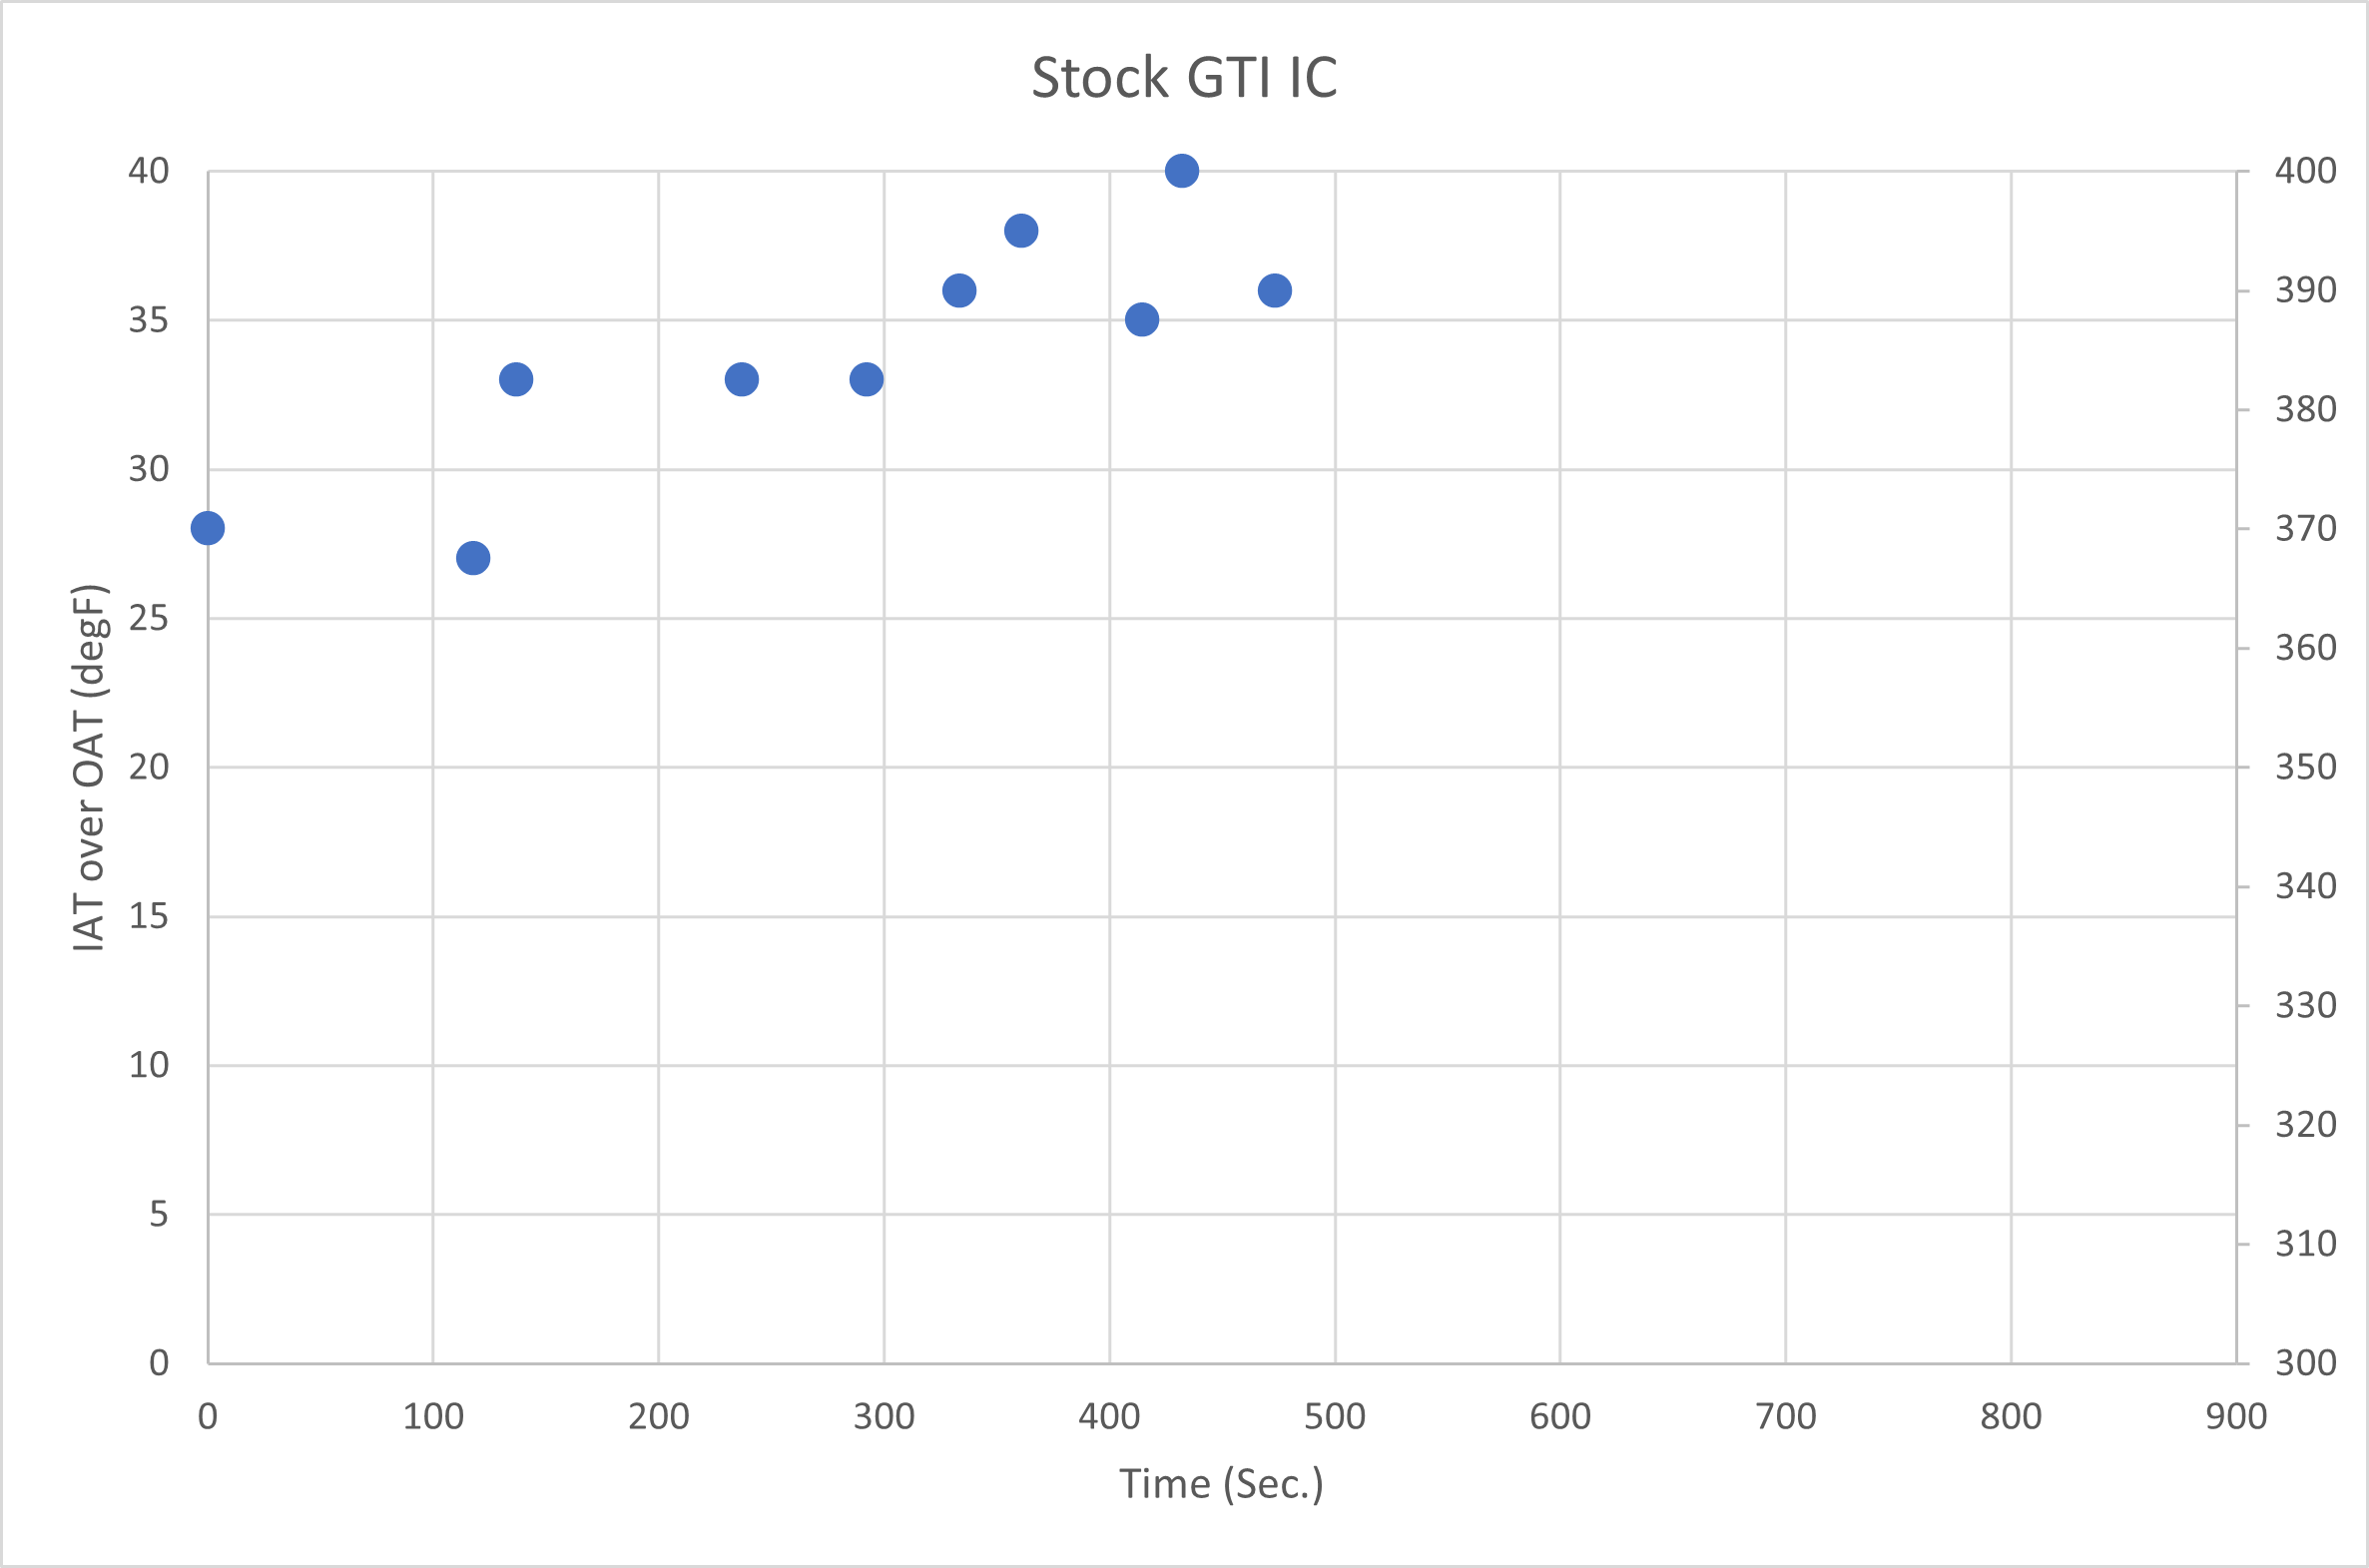
Next is a chart showing the IAT above the OAT at 6k RPM during the pulls.
With the tune remaining the same a comparison of estimated peak wheel horsepower is made using the Virtual Dyno application.
The stock intercooler pulls show a drop in the estimated peak wheel horsepower compared to the bicooler IC setup.
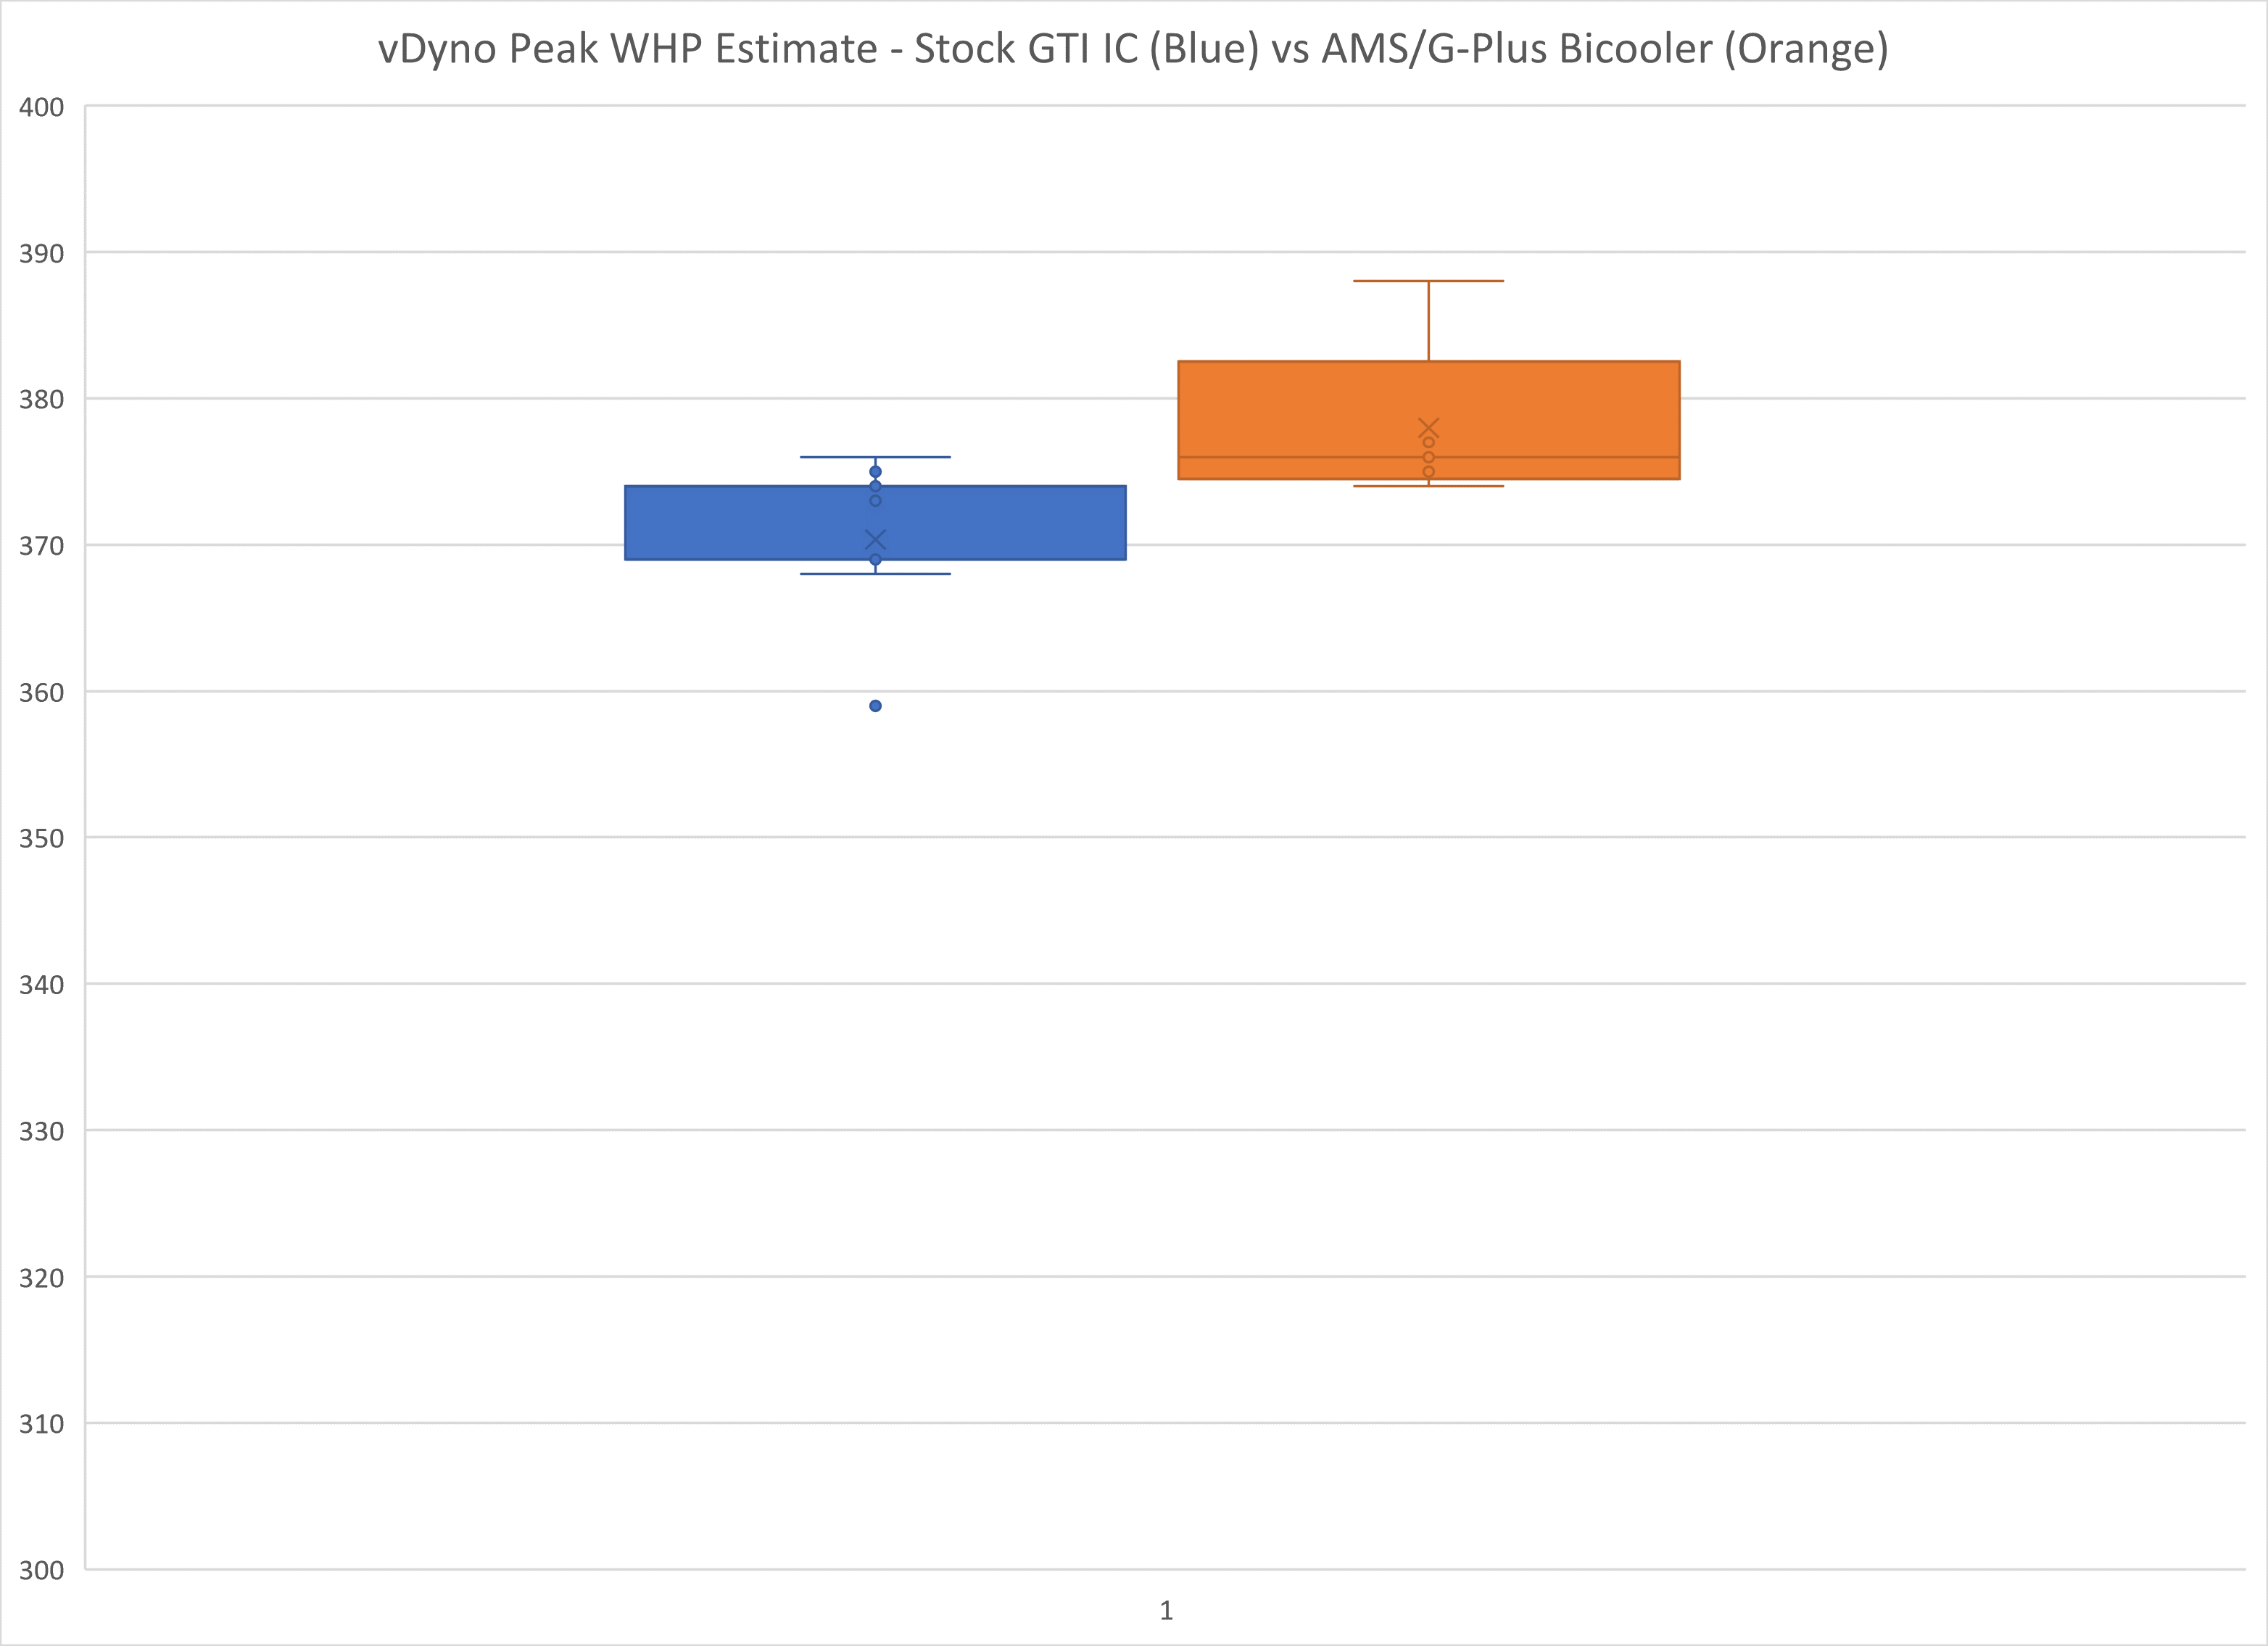
The “average” drop in peak wheel horsepower is approximately 8 whp.
Quality check:
As the box plot above shows, when recording “real world” data making comparisons is complicated by factors other than the main effects we’re interested in evaluating. These factors lead to variances in the data for which statistical techniques can help with estimating how confident we can be with the measurements.
The two-sample t-Test is a commonly used hypothesis test. It is used to compare whether the average difference between two sample groups is really significant, or if instead, it is due to random chance.
Comparing the estimates for the stock IC and AMS/G-Plus bicooler wheel horsepower a t-Test is applied:
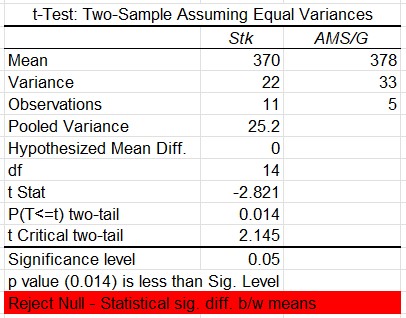
The results point to there being a statistically significant difference between the means of the sample data, or the difference in wheel horsepower measurements is statistically significant at a 0.05 significance level.
Power analysis:
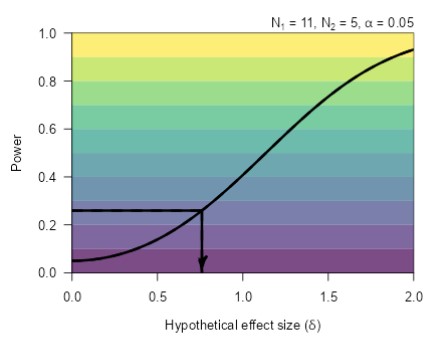
Even though the t-Test indicates there is a statistically significant difference between the sample means, a question remains about whether the test has sufficient power to make a reasonable conclusion.
Assuming an effect size (how meaningful the difference between groups is) of 0.76, which is calculated for a WHP difference of at least 4, and using the sample standard deviations, it’s found that the power is only about 0.25 (0.8 is a commonly used power).
The purpose of a power analysis is to evaluate the sensitivity of a design and test. In the next chart what is shown is a calculation of the minimum sample size needed to have an experiment sensitive enough to consistently detect the specified hypothetical effect size.
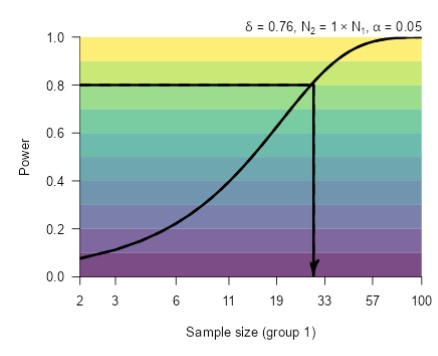
A sample size of 29 in each group would be needed to reliably (with a probability greater than 0.8) detect an effect size of δ≥ 0.76, assuming a two-sided criterion for detection that allows for a maximum Type I error rate of a=0.05.
As it turned out, the difference in the estimated WHP means is greater than 4, and the actual effect size is roughly 1.13. This means that only 14 samples for each configuration would have been sufficient to meet the goal of 0.8 power. Unfortunately, that is still more than the number of measures that were recorded.
For this case, the small sample size means it is more likely that the effect will be missed.
Conclusions:
The stock GTI intercooler was used with an IS38+ turbocharger operating around 26-28 psi of boost pressure.
Intake air temperature measurements compared with two different aftermarket intercooler options show that the aftermarket intercoolers cool better than the stock GTI intercooler under the test conditions.
Estimates of vehicle wheel horsepower on an E30 tune using the GTI IC and an AMS IC with G-Plus bicooler show that the stock IC usage correlates with a decrease in peak WHP of approximately 8 WHP.
The difference in WHP means is statistically significant at a significance level of 0.05, but a power analysis indicates there is a decent likelihood of the effect (difference between groups) being missed due to a small sample size. In plain language, it looks like there is a significant difference in the sample data, but there is not enough sample data to conclude this sample data represents the true magnitude of the performance difference.
The drop in WHP is less in this comparison than when I did a similar comparison a couple of years ago. My initial guess is that the E30 tune is a primary factor causing the difference from the last time when a 93-octane tune was being used. Looking into that some more will be the subject of a future post.