Background:
Happening across this comment about the Baun Performance FMIC led to an inquiry:

If the claim turned out to be true the IC would be performing very well.

The person making the claim never got back to me with a data log, so I decided to see for myself how well it cools.
Test Procedure:
The Vibrant 12810 intercooler used in the Baun Performance FMIC Kit is installed on my Mk7 GTI which is equipped with a Shuenk IS38+ turbocharger.

For this test, the ECU is loaded with a custom 93-octane tune from EQT. The boost profile for this tune is shown in the results section.
The GTI is accelerated at full throttle while in third gear starting from approximately 2,000 RPM and concluding at approximately 6,300 RPM.
The Intake Air Temperature (IAT) sensor reading when the engine RPM is 6,000 is compared to the ambient air temperature and the difference is calculated to be the IAT delta. This IAT delta is the metric used for comparing with other intercoolers.
The GTI is driven briefly before repeating the process. This is performed a number of times.
Note: The hardware, software, and operating conditions for this test will factor in the output temperature from the intercooler. This test does not necessarily indicate how efficiently this intercooler would operate with different components or under different conditions. It is assumed that a hybrid turbocharger capable of higher boost pressure would create a greater cooling demand from the intercooler.
The GTI is equipped with supplemental sensors to record the temperature and pressure at the turbocharger outlet. There is another temperature sensor located in the throttle body charge pipe. The temperature at this location is reported as IC_Out on the chart in the results section.

Data was recorded over a period of approximately 15 minutes with minimal variation in the outside air temperature.
Test Results:
An overview of data collection is shown. A total of 24 data points were recorded.

As has been previously reported, the vehicle IAT reading (red line) is on average greater than the temperature leaving the intercooler (orange line).
The following composite chart shows the tune boost profile along with the IAT and ambient air temperature for all of the pulls.
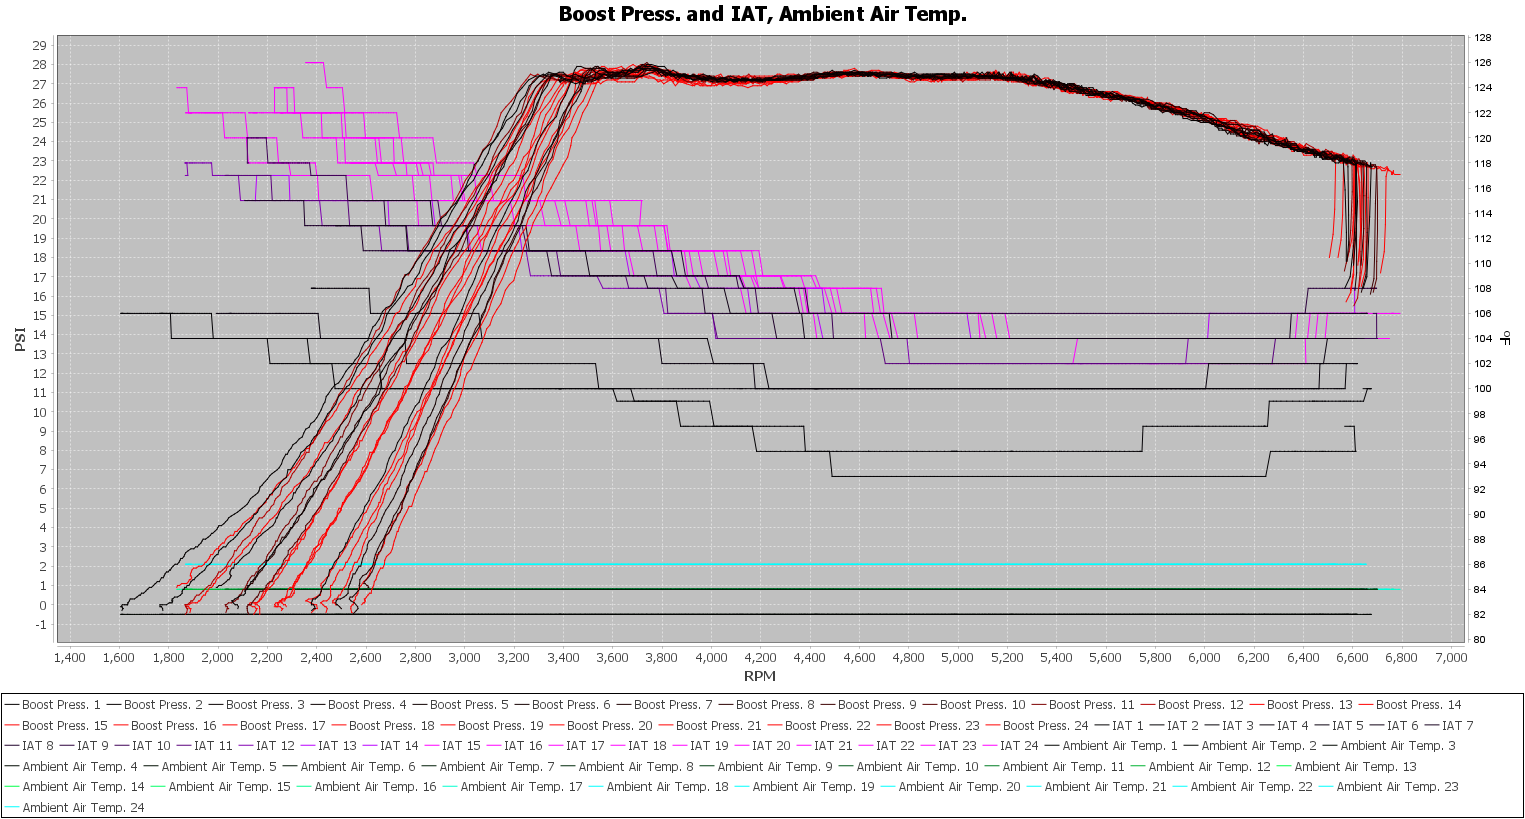
As additional pulls are made the starting IAT at lower engine speed increases.
The next chart shows how the Vibrant-Baun Performance Kit IAT delta trends with subsequent pulls.

The IAT delta is 11 degF during the first pull and increases slowly over the next five pulls.
The IAT delta reaches a steady state of around 20 degF.
The pressure drop across the Vibrant-Baun Performance Kit FMIC is approximately 3.9 psi at 6,000 RPM and is shown on the boxplot below:

The next chart shows the average temperature out of the intercooler 10 seconds after letting off the throttle. This chart is intended to give some idea of how well the intercooler recovers after being subjected to a heavy load.
Note: The number of data points recorded, and the sequence of recording sessions, will have an effect on this value. Most intercoolers I have tested will heat up by some amount during consecutive pulls. If data points are recorded during multiple sessions, allowing the IC to cool completely in between sessions, a lower average value will result.

Wheel horsepower estimates calculated from the logged data using Virtual Dyno are shown next:

The next chart summarizes all of the intercoolers that have been installed on the GTI for the recording of street data along with airflow measurements made using the flow bench.
Note: Previously I have shown that flow bench airflow measurements correlate very well with street-recorded pressure drop.
Every product “data point” on the chart represents an average temperature value and is really a range of temperature values from multiple samples. Depicting this range on the chart would make the presentation harder to read.

Conclusions:
The Vibrant 12810 intercooler is used in the Baun Performance FMIC kit for the Mk7 GTI and is the subject of street data collection.
On average the IAT delta during a pull is approximately 20 degF. The average pressure drop at 6k RPM is 3.9 psi. The temperature out of the intercooler ten seconds after a pull averages approximately 17 degF above the ambient air temperature.
The claim that this FMIC delivers single-digit temperatures above ambient with a hybrid turbocharger is not supported by the data recorded using an IS38+ turbocharger following the procedures described above.
References:
Power Drop Investigation:
The power drop during the data collection wasn’t entirely unexpected. As the intercooler becomes hotter the cooling efficiency declines.
The amount of drop, approximately 25 whp by the midpoint of the data collection was greater than expected. Also unexpected was the return of the power level to the starting level over the second half of the data collection.

To try and understand the source of the power swing I looked at some of the data that was recorded.
My first guess was that the average speed was behind the change:

Nothing obvious stood out from the moving average.
Next, a pair of box plots summarize the speeds during the first half of the drive, from the first to the last pull before turning around, which is when the speed drops to zero.

The second half of the drive is slightly faster on average.
Histograms for each half help to give a better picture of the speed distribution.


These results are close also with 80% of the data through 60 mph in the first half and 82% of the same data in the second half.
Looking at the air temperature leaving the intercooler in the two halves of the drive:
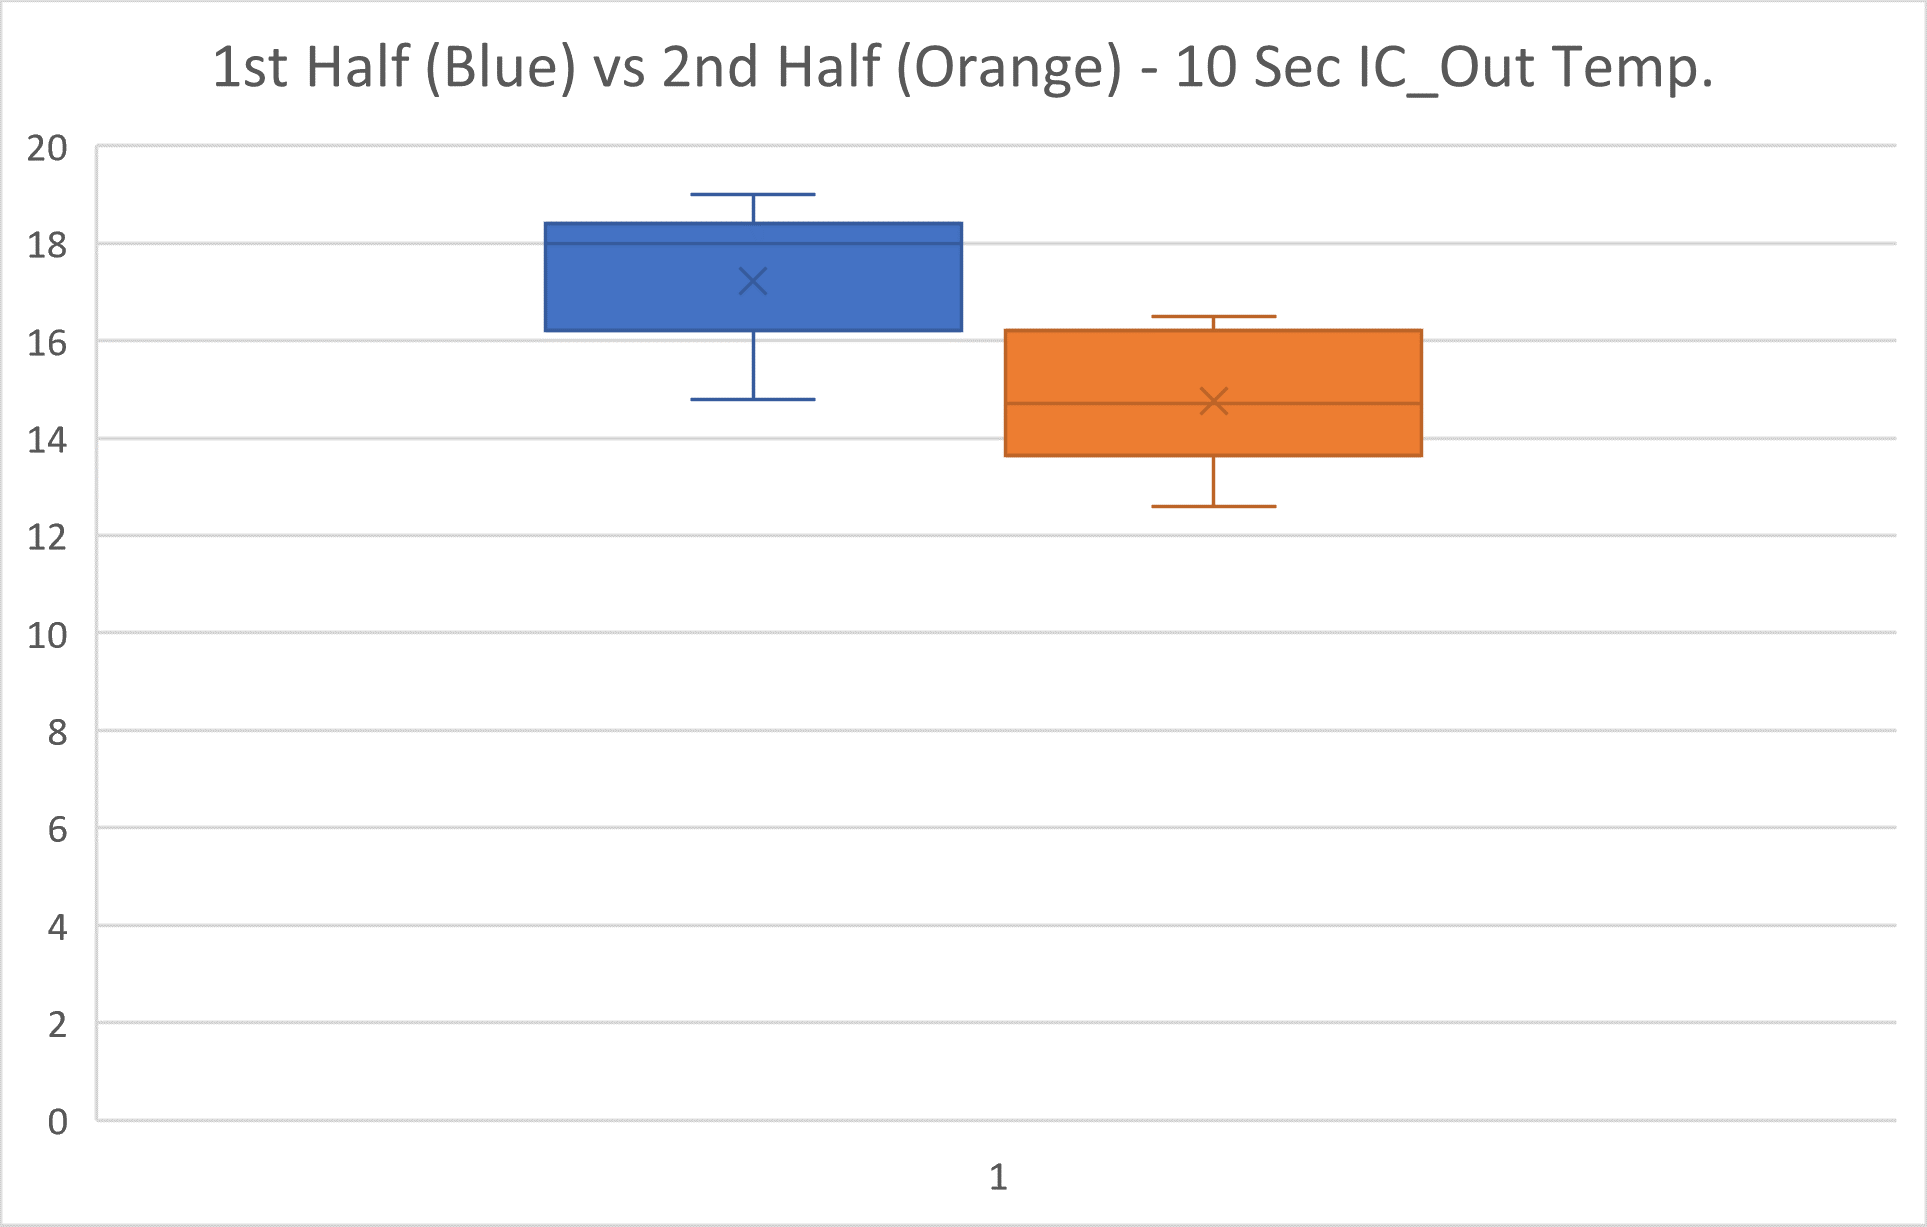
The second half of the drive does show a slight improvement in the temperature exiting the intercooler, but only by 2-3 degrees Fahrenheit on average.
Thinking that perhaps ignition timing changes were causing the change the next chart shows the timing advance at 5,500 rpm versus the calculated power:

Nothing useful is shown with that perspective.
The final chart shows the change in calculated WHP from the previous pull versus the time between pulls, the thought being that shorter time intervals might correlate with lower power.

Another dead end.
After trying a couple of multiple linear regression models without success I decided to leave this puzzle unsolved.