Background:
A post I made several months ago received a comment from someone on Reddit recently proclaiming that they had never seen a correlation between flow bench tests and ‘real-world‘ performance.
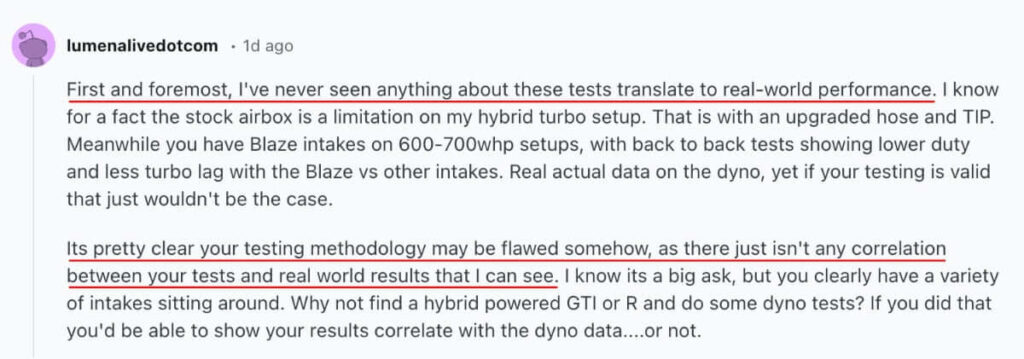
To them, it was clear that something must be wrong with my ‘testing methodology‘, because they could not see any correlation between flow bench tests and ‘real world results‘.
Reality Check:
Their point does beg the question: If there is no correlation between a flow bench test and real-world results, how has the flow bench survived as a tool for automotive product development for 60 years?
As you may suspect, the issue is not with the flow bench but with this person’s research.
To illustrate the correlation between flow bench testing and ‘real-world‘, I present the following comparison.
The test will entail measuring flow rate through a collection of intake parts and then comparing the flow bench measurements with data logged on the street using my Mk7 GTI to find out if there is any correlation.
Products Under Test:
The Mk7 GTI is equipped with a Mabotech M520 hybrid turbocharger and operates with a Russell Road & Racing ECU tune that produces the following boost pressure curve.
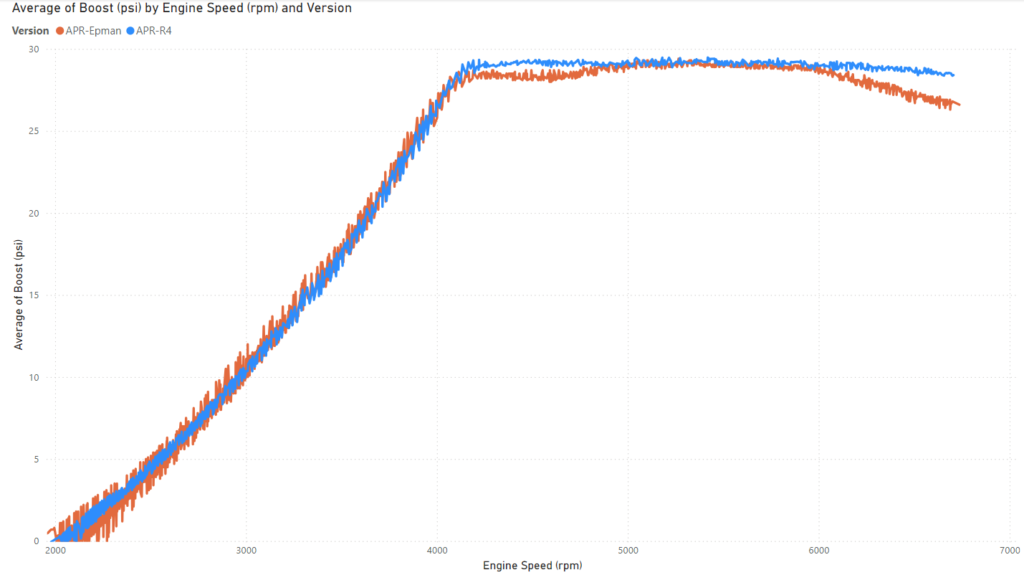
Spoiler alert: The difference in boost pressure curves results from the parts under test.
The intake components that will be tested are shown in the image below:

They consist of an APR PEX open intake, MST Performance turbo inlet hose, MST Performance turbo inlet elbow (V2), Racingline R600 intake, Racingline (RL) turbo inlet hose, and Epman (APR knockoff) turbo inlet elbow.
The configurations that will be tested are:
- APR PEX intake / MST hose / MST V2 TIP
- APR PEX intake / RL hose / Epman TIP
- RL600 intake / MST hose / MST V2 TIP
- RL600 intake / RL hose / Epman TIP
The TIP is the product of most interest to the outcome since the Epman is made to work with a stock IHI turbocharger, and the MST V2 is made to work with a hybrid turbocharger.
The turbo inlet hose must be changed because the inlet end of the TIP is a different size for the Epman and MST products.
Testing of two intakes is done to determine if the results are consistent.
Test Process:
Testing with the flow bench will be through an adapter sized to simulate the compressor inlet of a hybrid turbocharger. The flow bench will be operated at a depression of 28″ of H2O, and the flow rate through each intake configuration will be recorded at this depression.
Street data will be logged through the GTI’s OBD2 port during full-throttle third-gear pulls that begin at around 2,000 RPM and conclude at around 6,500 RPM.
The turbocharger’s wastegate duty cycle (WGDC) is the measure of interest as it will indicate relatively how much work the ECU requests from the turbocharger. Changes to this value should indicate if the intake components affect the work the turbocharger is performing. The WGDC will be compared at an engine speed of approximately 6,500 RPM.
Test Results:
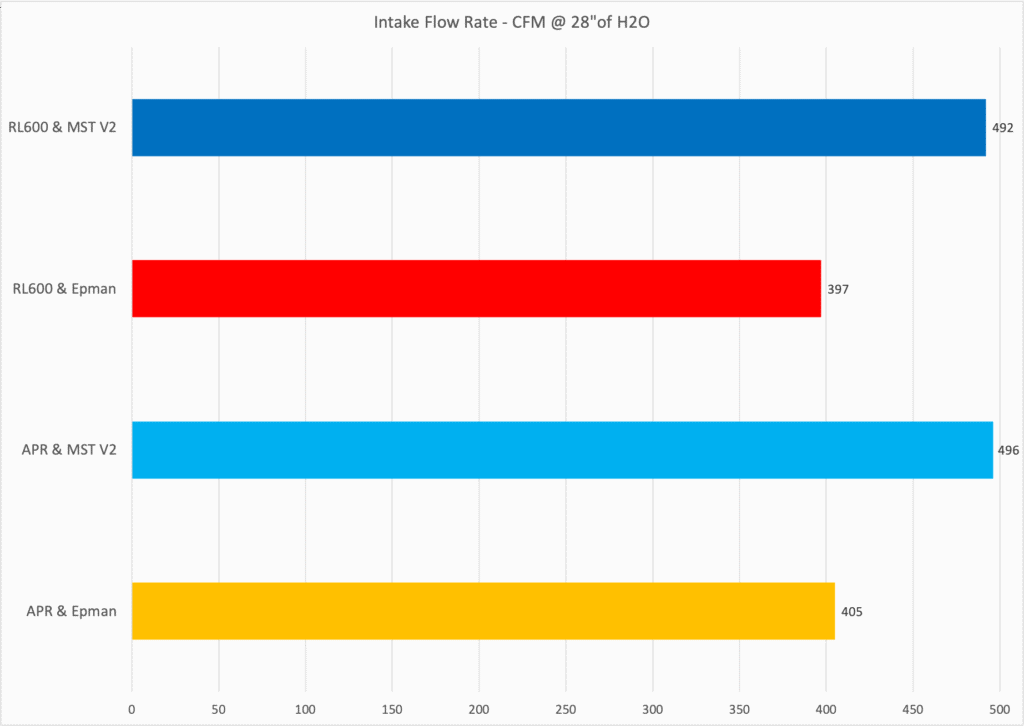
The flow rates through the intake configurations measured with the flow bench are as follows:
- APR PEX intake / MST hose / MST V2 TIP – 496 CFM @ 28″ of H2O
- APR PEX intake / RL hose / Epman TIP – 405 CFM @ 28″ of H2O
- RL600 intake / MST hose / MST V2 TIP – 492 CFM @ 28″ of H2O
- RL600 intake / RL hose / Epman TIP – 397 CFM @ 28″ of H2O
These results are summarized in the chart below:
The street logged measurements with the APR PEX intake using the Epman and MST V2 TIPs are shown below.
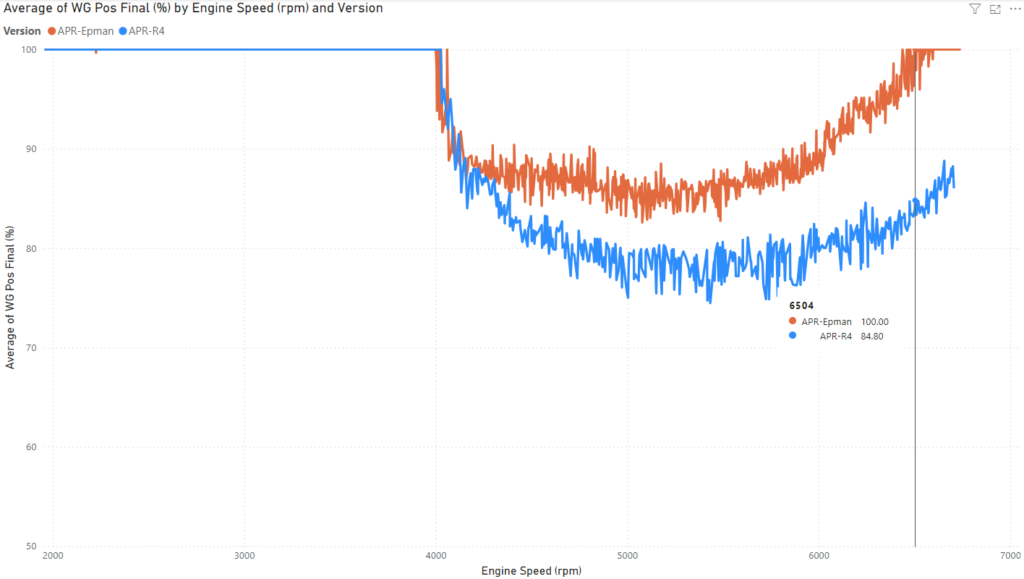
The difference in WGDC at 6,500 RPM is:
- APR PEX / Epman – 100%
- APR PEX MST V2 – 84.8%
The next chart shows the street logged WGDC using the Racingline R600 intake.
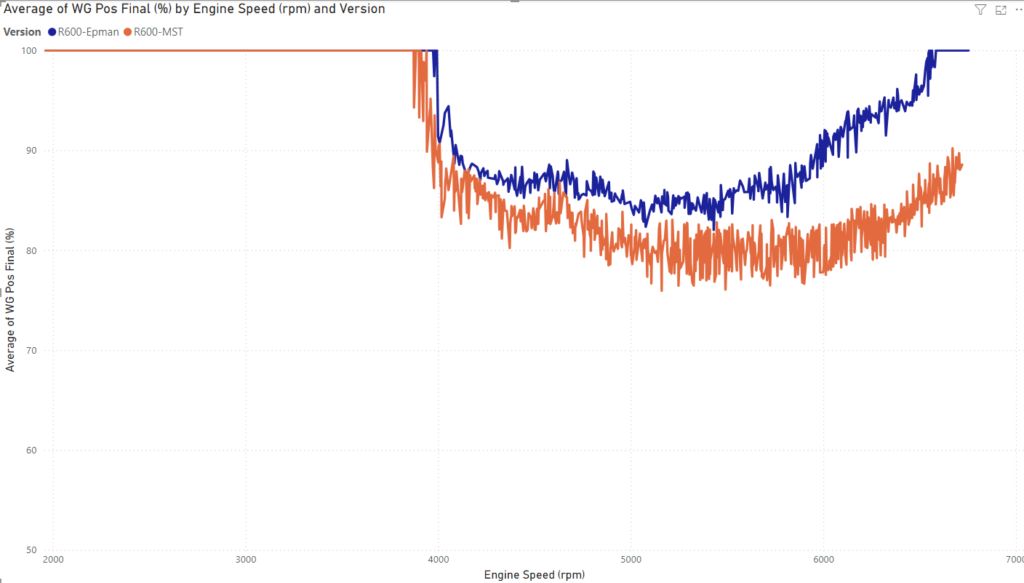
The difference in WGDC at 6,500 RPM is:
- Racingline / Epman – 99.3%
- Racingline / MST V2 – 85.2%
The following chart shows a summary of the street logged ‘real world‘ turbocharger WGDC using each intake configuration:

Correlation Plot:
Finally, the street-logged ‘real-world‘ performance data (WGDC) is plotted against the flow bench-measured flow rates (CFM) to look for correlation.

There is a visible strong correlation between increased flow rate as measured on the flow bench and reduced turbocharger wastegate duty cycle.
Additionally, the calculation of the Pearson correlation coefficient (r) value produces a result of -0.995, which confirms the strong correlation between Flow Bench Measured CFM and Street Logged WGDC.
Conclusions:
A consumer professed to never having seen a correlation between Flow Bench testing and ‘real-world‘ performance.
Evidence of such correlation is demonstrated by changing intake parts for a Mk7 GTI and operating on the street to record ‘real-world‘ performance data of the turbocharger wastegate duty cycle (WGDC).
The same intake parts were then subjected to a Flow Bench test, in which the maximum flow rate in cubic feet per minute (CFM) was measured at a depression of 28″ of H2O, through different configurations.
The results from each measurement method were analyzed using a scatterplot and found to show a strong correlation.
This test provides this consumer and others with evidence of a correlation between Flow Bench testing and ‘real-world‘ performance.


They just can’t get their head around that the Blaze has a built-in TIP that is hybrid size so changing from a standard turbo TIP on any intake will always show less flow than the Blaze using the hybrid TIP. Good lord.
Yes. In defense of the people who have fallen for the marketing spin, shortly after the intake came out and I was pointing to the effect of the elbow, Ed Susman did an effective job of character assassination to keep the truth buried from them.