
Background:
The next Mk7 GTI intercooler to be evaluated by way of a bench cooling test is another stock location replacement, this one made by Integrated Engineering.
The purpose of the test is to generate cooling efficiency data under well controlled conditions that can be used for making comparisons among different IC options for the Mk7 GTI. This is one test that is part of a larger effort to evaluate candidate intercoolers.
The product being tested is the Integrated Engineering intercooler version 1.

Test Process:
The IE intercooler is connected to the flow bench to regulate the volume of air that flows through the IC. A pair of hot air sources are connected at the inlet of the intercooler and a temperature sensor is placed in the outlet airstream to record the “cooled” air temperature.
A cooling fan is positioned to blow cooling air directly onto the core once two minutes of heating have passed. The hot air continues to flow through the IC while the cooling air is forced through the external fins. After three minutes total time the hot air source is removed and the cooling fan continues to run until the outlet temperature begins to drop.
The test is repeated twice with a cooling period between each test run. The test is ended after three minutes run time for the second and third tests, meaning the time when the heating curve turns downward is measured only on the first test run.
A three run average is used in generating the comparison charts.
Test Results:
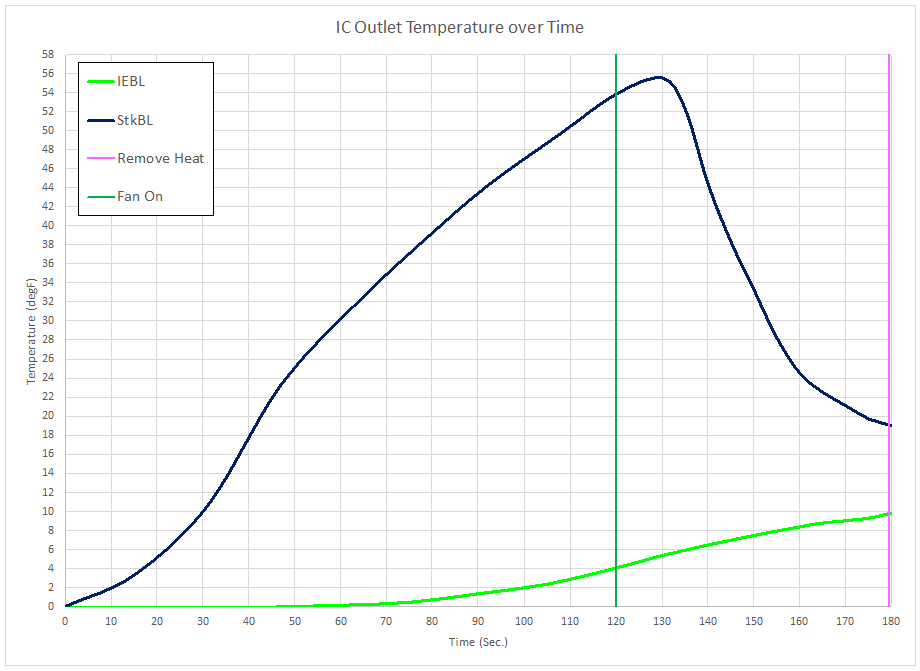
A comparison of outlet temperature over ambient air temperature of the IE vs Stock GTI intercoolers is shown in the chart:
The IE intercooler versus all of the other stock location intercoolers that have been tested is shown on the next chart:

Scaling the temperature axis (y-axis) to better differentiate results with the aftermarket intercoolers is shown on the next chart:

Results of the extended run that determines the time when the outlet temperature first begins to decrease is shown on the next chart:

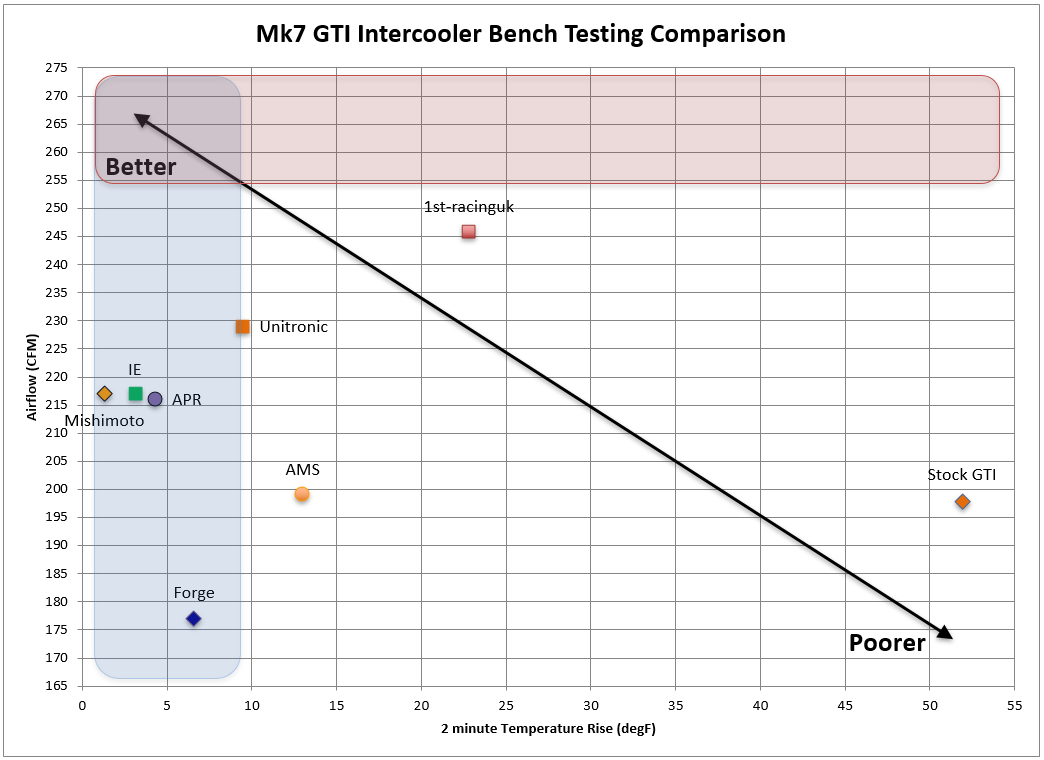
The temperature rise at 120 seconds is combined with airflow test results to populate the next chart:
Conclusion:
The Integrated Engineering intercooler average temperature rise after two minutes was slightly more than three degrees Fahrenheit. The trend over the duration of the heated phase of the test was very similar to the APR intercooler, with the IE intercooler showing slightly better cooling and trailing only the Mishimoto intercooler after two minutes.
During the no heat cooling phase the IE intercooler performed near the middle of the aftermarket ICs that have been measured.
The combined results from the flow test and bench cooling test, including the extended cooling phase test, met my threshold to justify moving the IE intercooler on to testing with my GTI.
Caveats:
Use of this data to make conclusions about intercooler performance on a vehicle depends on the confidence each person gives to the test methods.
On the car the quantity and temperature of air exiting the turbocharger will exceed the conditions of the bench test. It is likely that as more bench data is recorded and can be compared with vehicle data logs for different intercoolers that the time that the temperature measurement should be noted, two minutes presently, will change to better approximate relative intercooler performance on the GTI.
This test is one part of an effort to identify the “best” intercooler for my GTI. “Best” is determined by factors I consider important and these factors may not be important to other owners.
Note: I’m always on the lookout for other test result data to consider as part of my evaluation. If you have a source of other comparison data please post a link in the comments section.
These tests are extremely interesting and as good as they can be with limited recourses, especially with the extended period data recording. (giving insight into the thermal inertia and some other factors)
Thank you!
When are you planning to test the do88 IC? I’m extremely interested in that test as the IC has such a high flow rate compared to any similar IC, i’m really curious if it gives up any cooling performance to achieve this…. (for example by having less cooling fins internally)
Thanks! The do88 IC is going to be the next one that I get to.
Hey Jeff, the IE that you tested is that V1 or V2?
Version 1
I’ve said this before and I’ll say it again here. While there’s limitations to the test methods, the data is consistent among all items and that makes it extremely attractive to read. Thank you!!
I do have a question regarding interpretation of the graphs though. On the 2nd to last graph, am I correct in interpreting it as while most IC starting heat soaking earlier, the Mishimoto keeps a nearly 3 minute long lead (due to volume perhaps?) at the expense of starting to cool later and at a couple of degrees hotter?
Yes, you are reading the graph correctly. My guess is this is attributable to the mass and number of charge rows, both of which are on the high end of the products that have been tested. I interpret the chart as showing the Mishimoto does better than the others at absorbing heat, but slower to transfer that heat out of the core, under these test conditions.