Background:
I’ve used a set of the SSR Competition wheels for a long time across car models and have been a fan of their lightweight design.

When Apex announced that they were developing a wheel for the Mk7 GTI, I was excited to join the group buy for these track-focused wheels.
It took almost two years from Apex announcing their interest in developing a Mk7 suitable wheel to when I took delivery of a set.
Along the way, I had added a TTRS brake setup to the GTI, which would complicate a switchover to the Apex wheels.

When the Apex wheels arrived, I decided to conduct an acceleration test with them and the SSRs to see how the different weight wheels and tires would affect the vehicle acceleration.
Test Process:
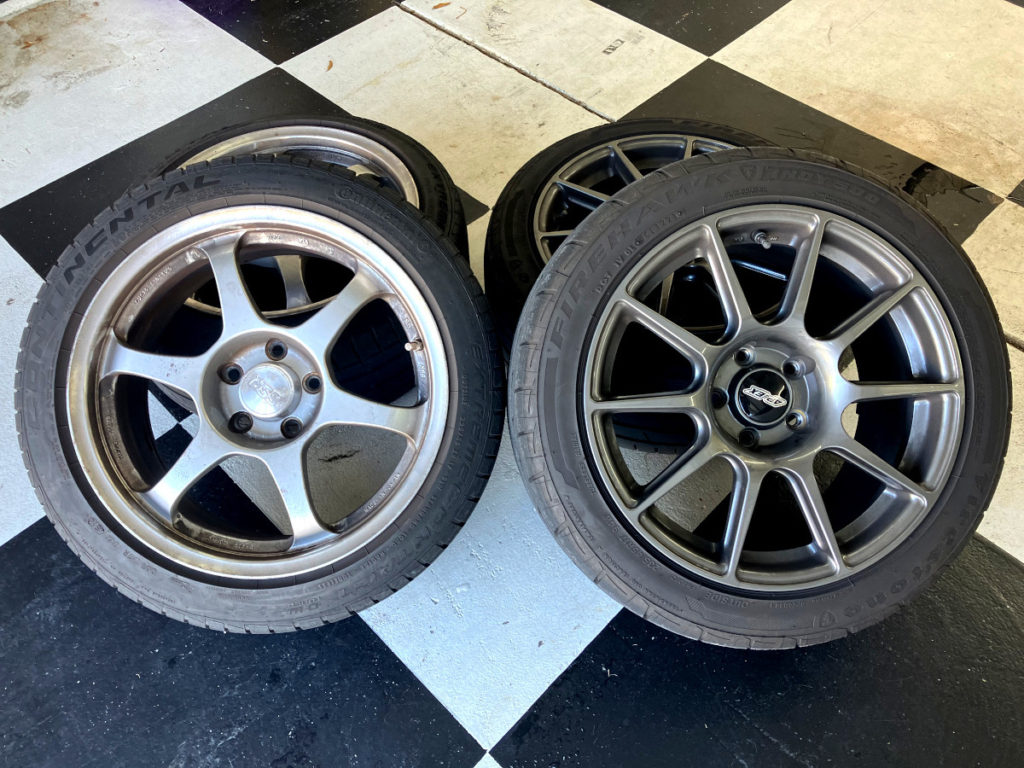
The first step of the test involves weighing the wheel and tire combinations.
- Apex / Firehawk Indy (235/45R17) – 43.4 lbs
- SSR / Conti (225/45R17) – 34.4 lbs
Three test cases were run:
- July 15, 2022 – Apex Wheels / < Quarter tank of gas
- July 22, 2022 – SSR Comp Wheels / < Quarter tank of gas
- July 29, 2022 – SSR Comp / Full tank of gas
Note: The dates are accurate; it has taken a while to write up the test report.
The acceleration is made in third gear at full throttle, starting around 2,000 RPM and finishing around 6,500 RPM.
Test Results:
First, the intake air temperature (IAT) is checked for consistency to rule out the possibility that it is a cause of the differences in acceleration times.
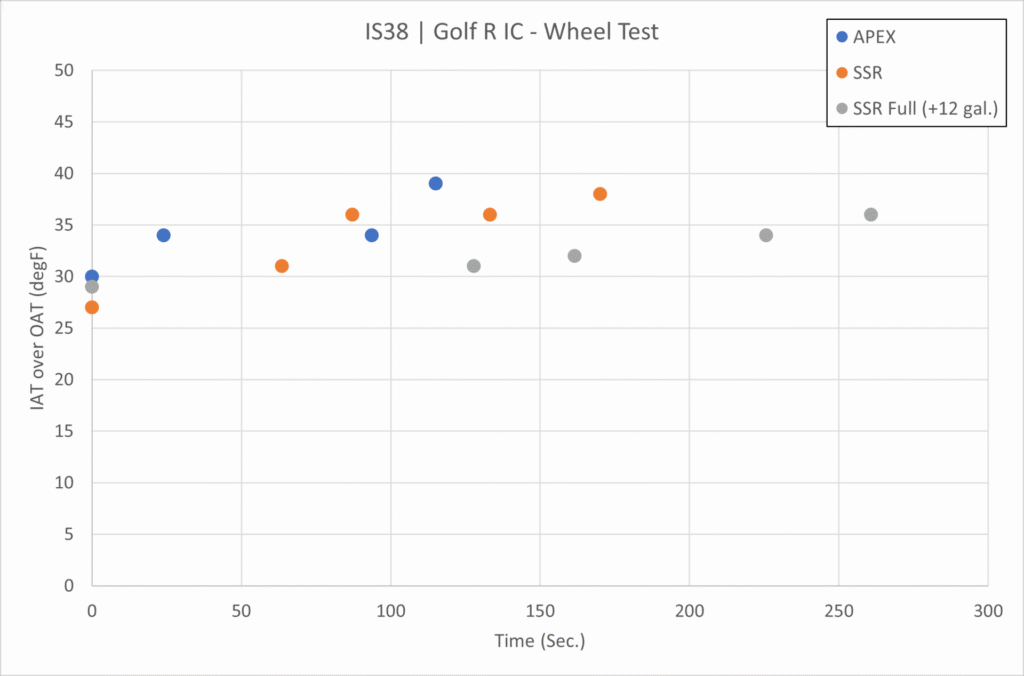
Note: As pointed out in the comments section, Air Temperature is not the only other factor that could influence the acceleration rate. Some others are mentioned in the addendum section.
Then the acceleration times from 47 to 84 miles per hour are compared.
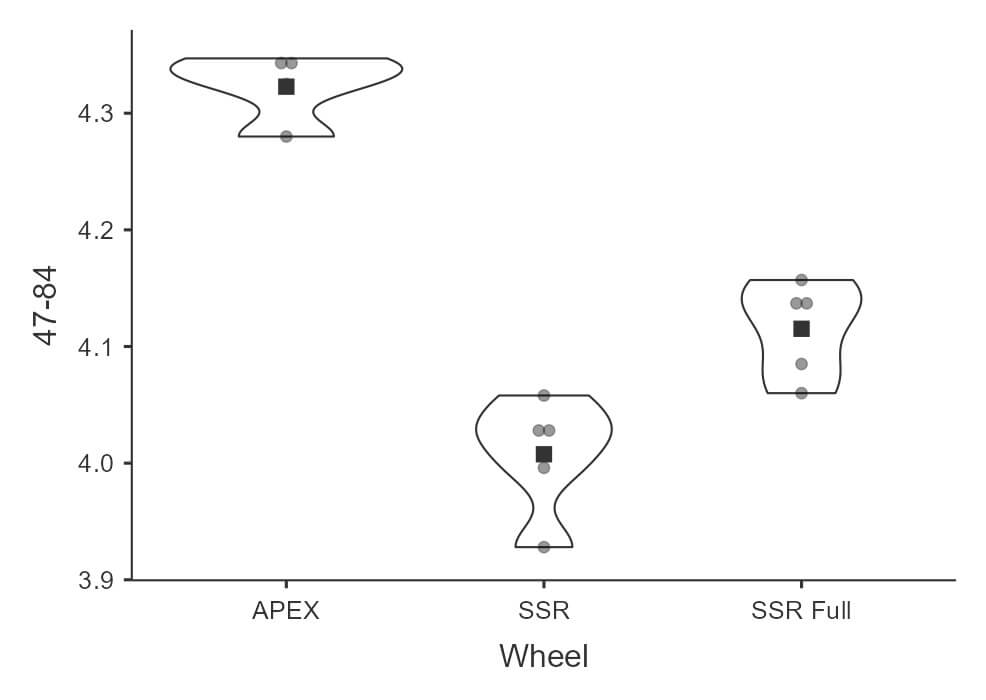
The Apex wheel runs are consistently slower than the SSR wheel runs, even after the fuel tank is filled and the SSR wheel run is repeated.
Note: The added weight of the fuel is ~50-70 lbs.
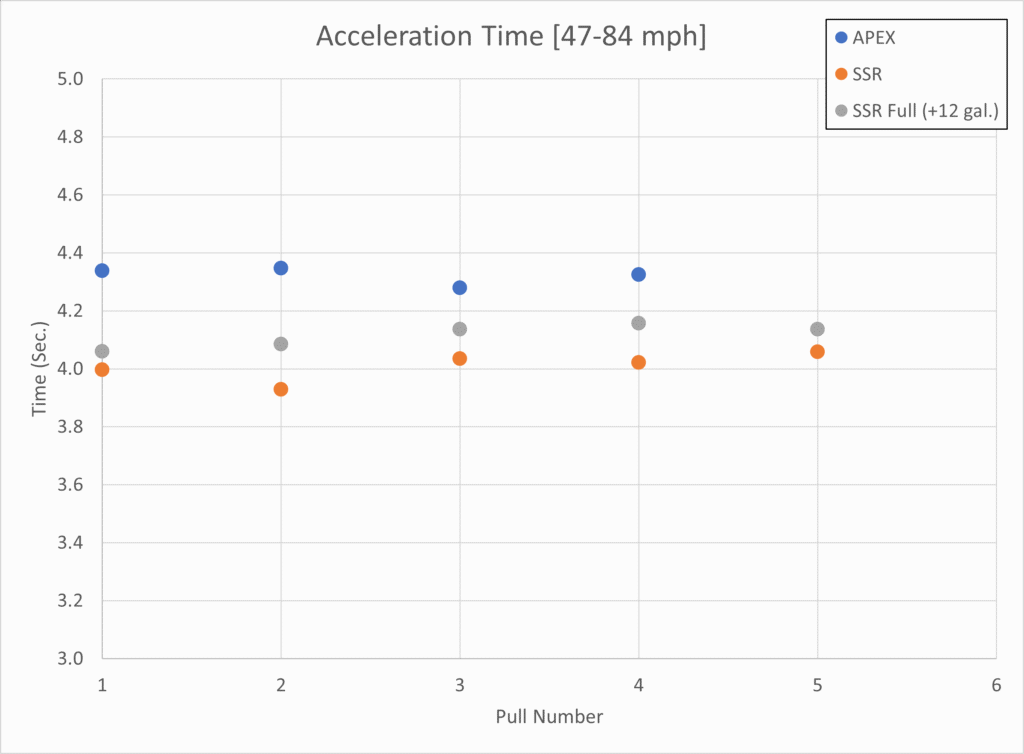
The following chart shows the data points and the average acceleration times.
Next, the acceleration data is processed using Virtual Dyno to estimate the peak wheel horsepower.
Note: To estimate the power difference equivalent to the wheel difference, the power calculation is performed while holding the vehicle weight constant, despite its variation when the wheels are changed and fuel is added. Put another way, the change in acceleration time due to the change in vehicle weight is equivalent to what amount of HP change.
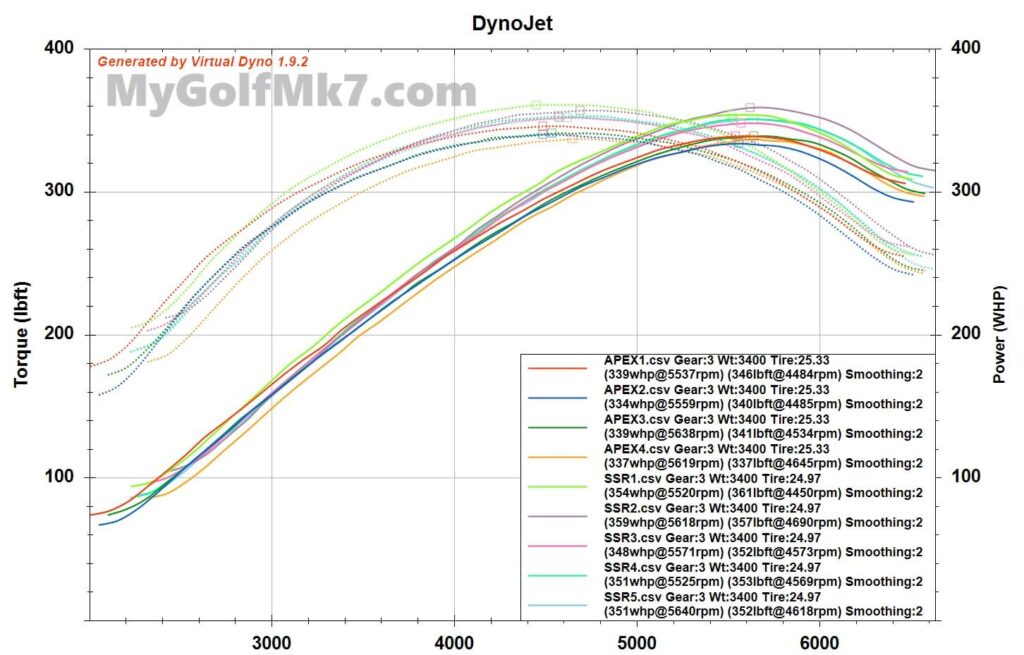
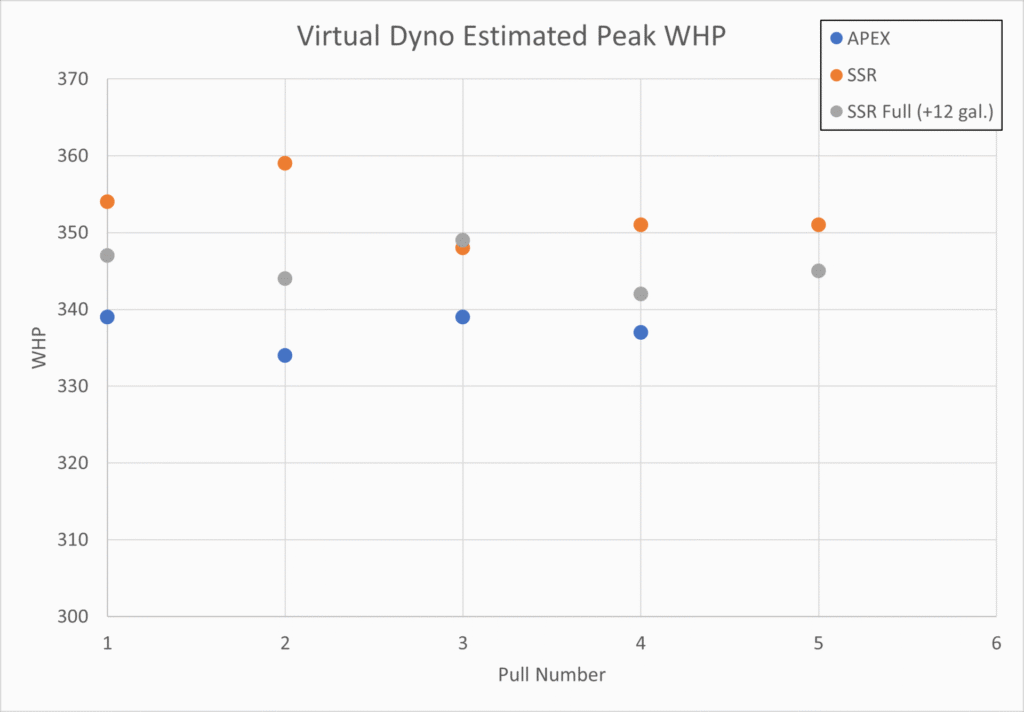
Plotting each of the peak wheel horsepower values over the series of pulls.
Finally, summarizing the peak WHP values and comparing the data points and means.
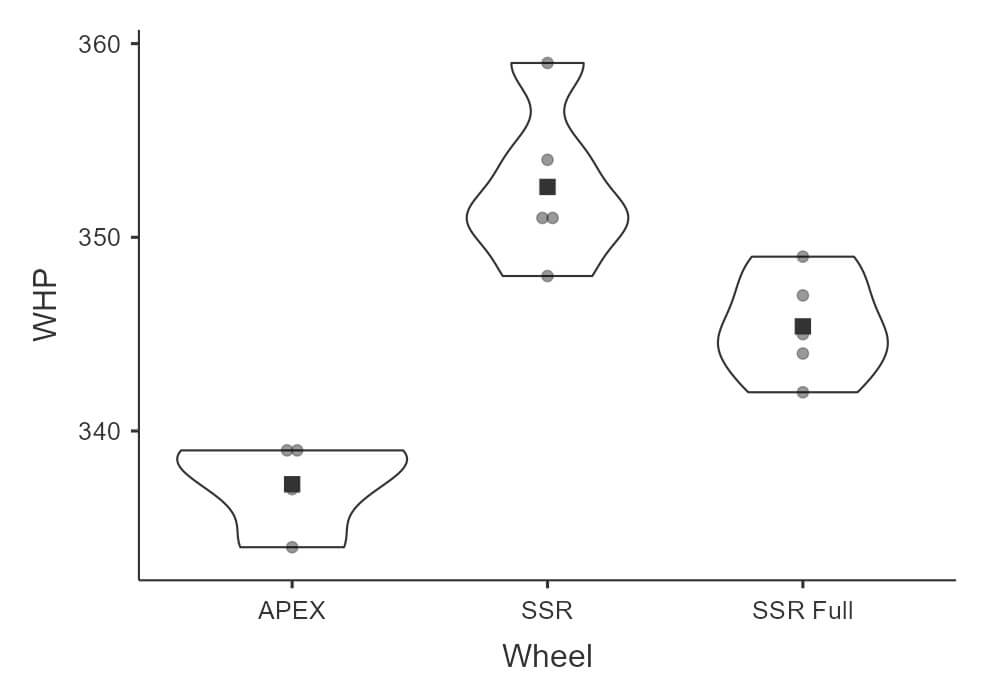
| Configuration | Average Peak WHP |
|---|---|
| Apex Wheels & 235/45R17 Tires | 337 |
| SSR Comp Wheels & 225/45R17 Tires | 353 |
| SSR Comp Wheels & 225/45R17 Tires + Full fuel tank | 345 |
Conclusions:
A test was conducted to compare the acceleration times of a Mk7 GTI using different wheel and tire combinations. The wheels and tires tested had a weight difference of 9 lbs per combination, resulting in a total weight difference of 36 lbs.
Note: The tires also have different diameters, discussed in the addendum.
The heavier wheel and tire pair had slower acceleration times, estimated to be equivalent to a 15 whp peak difference in wheel horsepower.
After filling the vehicle’s fuel tank, which added between 50 and 70 pounds to the lighter vehicle configuration, the vehicle’s acceleration rate decreased, but not to a slower rate than the heavier wheel tire combination, which was a 36-pound difference.
The peak WHP difference between this full tank configuration and the heavier wheel tire pair was approximately 8 WHP peak.
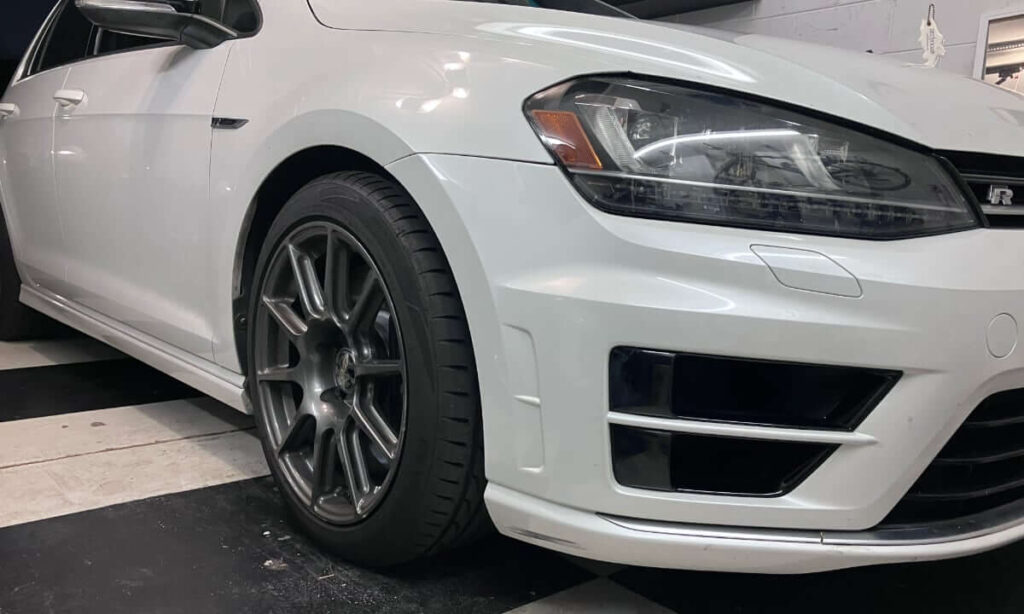
This test demonstrated that differences in the tested wheel and tire combinations could affect vehicle acceleration to a degree equivalent to a 15 whp difference.
Ultimately, the paper-thin clearance between the Apex wheels and the GTI’s TTRS brake calipers necessitated their installation on my wife’s Golf R.
References:
Addendum:

As the comment below points out, there is a difference in tire diameter between the Firestone and Continental tires, which could affect the vehicle’s speedometer reading and the effective final drive ratio.
The speedometer is calibrated for the OEM tires, which are not part of this test. The speedometer reading is “off” for both setups tested. Using a GPS-based datalogger would have helped mitigate some of the tire diameter effect; however, it was not used in this test.
This raises a question about the extent to which the tire diameter affected the acceleration times.
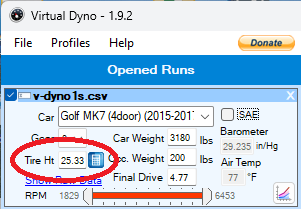
Note: Virtual Dyno does not use Speed as an input, and the tire diameter is an input that is accounted for when calculating the estimated power at the wheels.
Factor Analysis:
Firestone and Continental report the tire diameters as:
- Firehawk Indy – 25.4″
- ExtremeContact – 25.0″
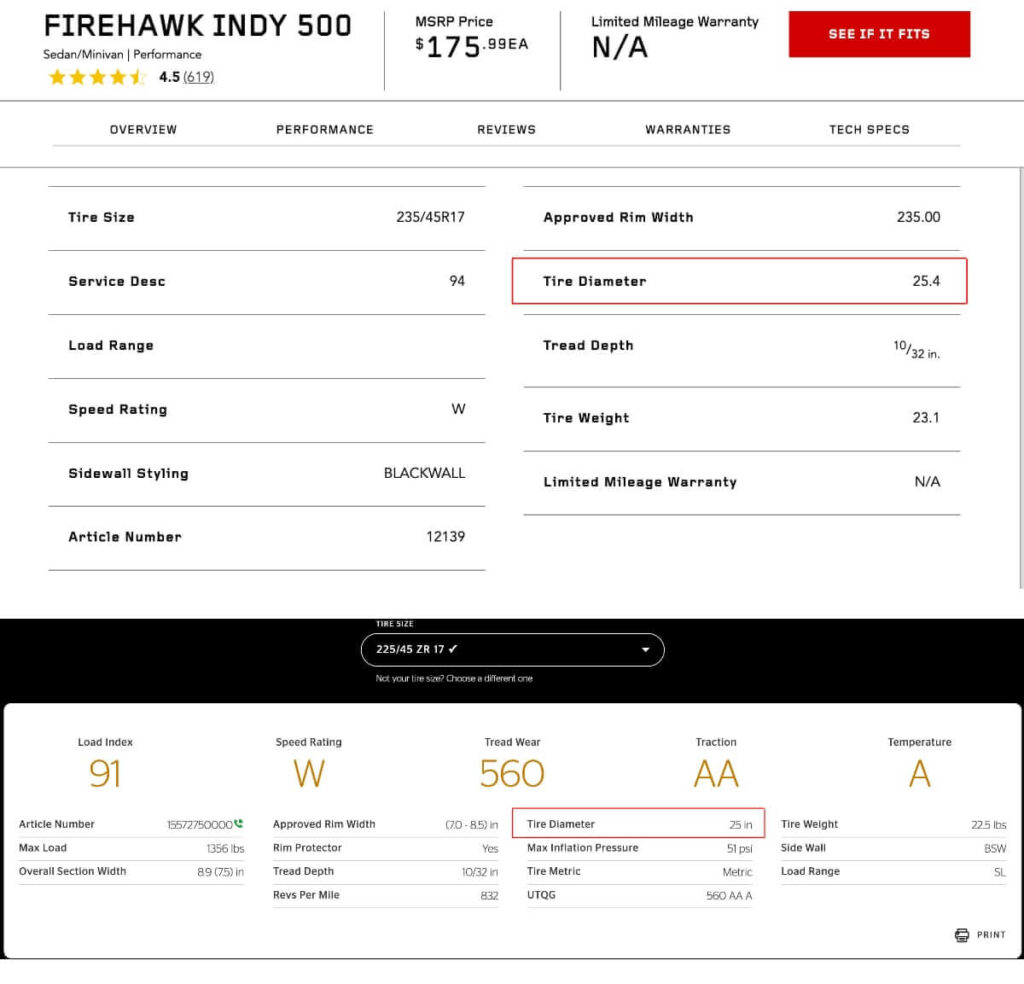
The larger tire (Firehawk) has a 1.6% longer rolling radius than the smaller Conti.
Due to flattening at the contact patch, the tire is not a perfect circle under load, which reduces the difference in rolling radius. How much difference is there in tire deflection under load between the different-sized tires? Unknown.
Assuming the larger diameter tire has slightly more deflection, the difference in rolling distance would decrease. For estimation purposes, 1.2% is used instead of 1.6%.
The effective gear ratio affects the torque at the contact patch, which in turn affects the acceleration rate. The ratio of tire diameter can be used to calculate an effective gear ratio. The 1.6% increase in rolling radius decreases the effective gear ratio by an equal amount, 1.6%. Again, considering the deflection under load, this value becomes 1.2%.
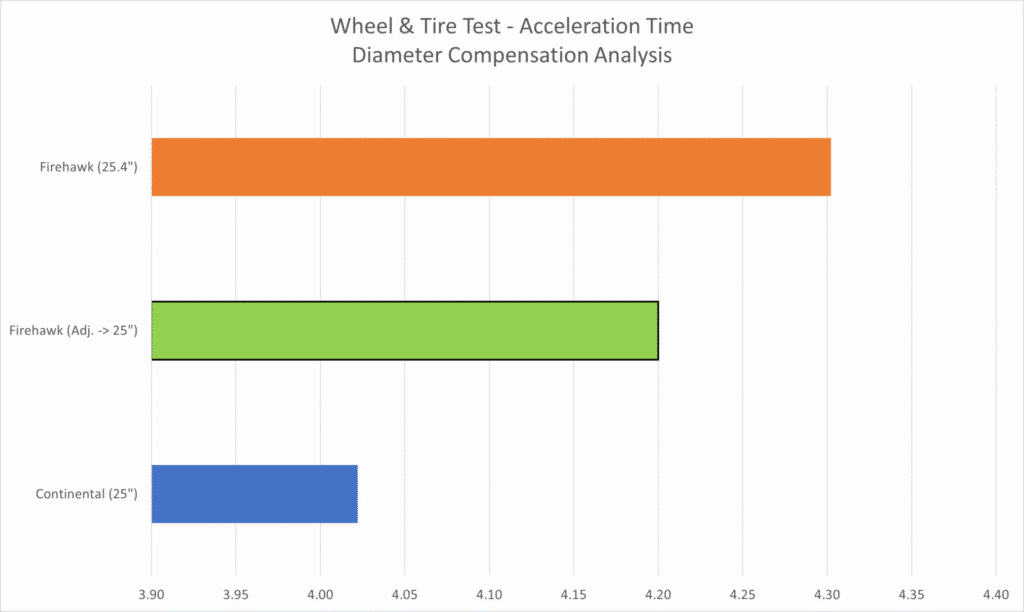
Factoring the radius effect on the speed window (47-84 mph) – expanding it, and the acceleration rate, reducing it, if the Firehawk Indy were a 25″ diameter tire instead of 25.4″, the average acceleration time would decrease from ~4.3 seconds to ~4.2 seconds.
This adjustment and the measured values are shown on the chart.
Conclusions:
The difference in diameter between the Firestone and Continental tires is a factor affecting the acceleration times measured for this comparison.
Note: In a designed experiment, this is referred to as a Noise factor. This is a variable that you neither control nor block, but you recognize will introduce variability.
Analysis of the effect on the speed window (47-84 mph) suggests that if the diameters were equal, the average acceleration time of the Firehawk test case would decrease by approximately 0.1 seconds. This adjusted time is 0.18 seconds greater than the measured time using the Continental tires.
Estimated power values from the Virtual Dyno calculation do not rely on vehicle speed for calculations and account for wheel diameter as one of the input factors; therefore, no adjustment is needed.
Tire diameter is a factor that affects the scale of the acceleration time difference, but does not change the result that the GTI equipped with a lighter SSR/Continental wheel/tire pair accelerated faster than the Apex/Firehawk pair.
Note on other factors:
As this addendum illustrates, not all factors are accounted for with this comparison. A sampling of some other factors that are not controlled are tire pressure, tire rolling resistance, vehicle mass (not the exact same fuel weight), ambient temperature, road slope, wind, engine operating temperature, and road surface.
When test conditions involve more factors, techniques such as blocking, randomization, and replication can help to identify the contribution of the factor of interest to the response variable.
The importance of finding the magnitude of influence of the factor of interest on the response variable can help determine the level of effort to apply to the test.

Thanks for posting this test. It confirms my seat-of-the-pants observations when I switched to a much lighter wheel and tire combo. The car just felt more sprightly.
Something I am curious about is the effect of the tire diameter on acceleration. The 235/45 is about 1/2 larger in overall diameter versus the 225/45. Would this not create a slight overall gearing disadvantage and throw off the speedometer readings slightly ?
You’re welcome!
I believe you are correct about the tire diameter. In the case of the timed measurement (using vehicle supplied data, not a GPS device), one tire would be from 47-84 mph, and the other something different, such as 48-85 mph. I don’t know how much, if any, difference in time there would be from accelerating over a range of 37 mph where the offset is around 1 mph. In the case of the Virtual Dyno application, it accounts for the tire diameter, and I used the correct diameter for each tire.