
A Data-Driven Look at What You’re Gaining
If you’ve already flashed Stage 1 software on your Mk7 GTI, you know how that feels. The car pulls harder and more consistently across the rev range. But you may be wondering: would Stage 2 feel like that same step forward, or is it a diminishing return for what I’m spending?

I put that question up against the data.
Where the Data Comes From
Four ECU tune vendors for the Mk7 GTI — APR, EQT, Revo, and IE — each publish dynamometer charts on their websites showing Stock, Stage 1, and Stage 2 power and torque curves. All four were tested on 93 octane fuel and reported results measured at the wheels.
Using those charts, I pulled the numbers for the power and torque curves for each calibration across the engine’s operating range and averaged delta curves: Stage 1 minus Stock, and Stage 2 minus Stage 1. Those deltas tell you how much each upgrade adds at every RPM point — not just at the peak numbers.
What Is a Just-Noticeable Difference?
Not every measurable gain is a perceptible one. A dyno chart can show a 5 WHP improvement that a driver will never actually feel. To separate real-world perception from statistical noise, I apply the just-noticeable difference (JND) framework from a 2013 study by Müller and colleagues at BMW, who investigated how sensitive drivers are to changes in longitudinal acceleration — the force you feel pushing you into the seat.
Their finding, which I find a useful benchmark, is that the average person can detect a change in acceleration only when it exceeds approximately 2.7% of the current acceleration level. This is an expression of Weber’s Law, a principle of human perception that says our ability to detect a change scales with the size of the reference stimulus — so detecting a gain is harder at high power levels than at low ones.
I covered this study and its implications for Mk7 GTI performance testing in an earlier post on this site.
What the Charts Show
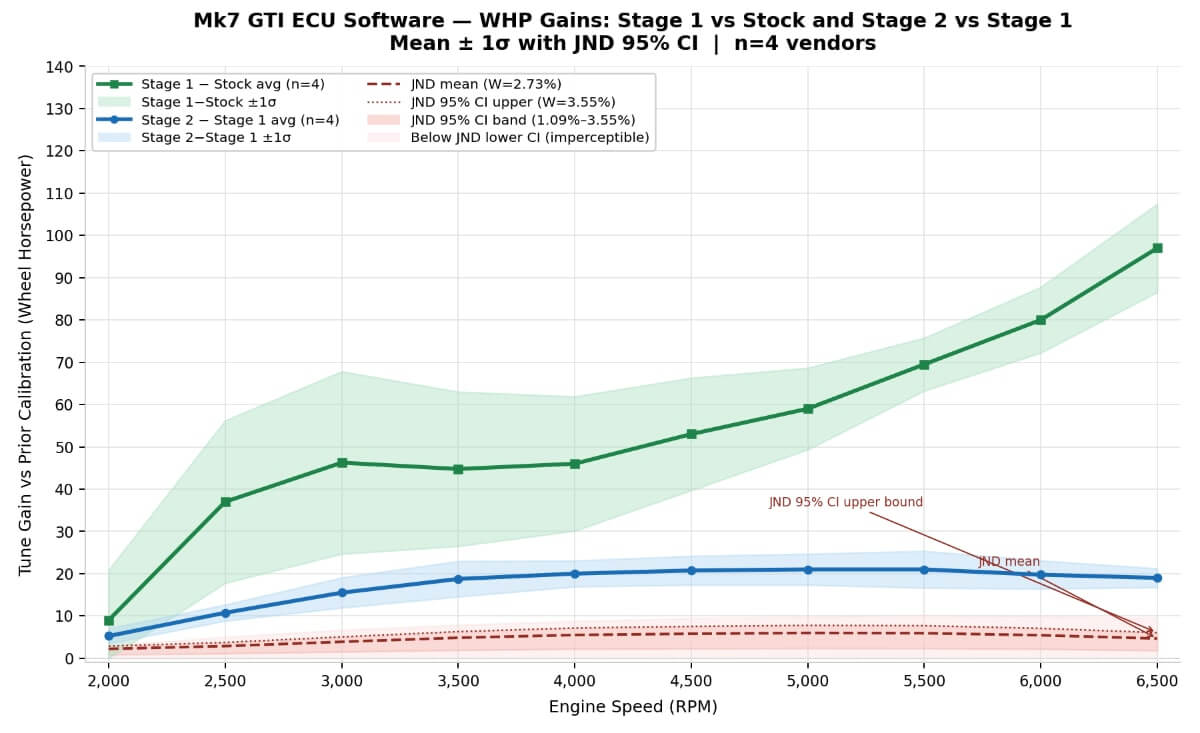
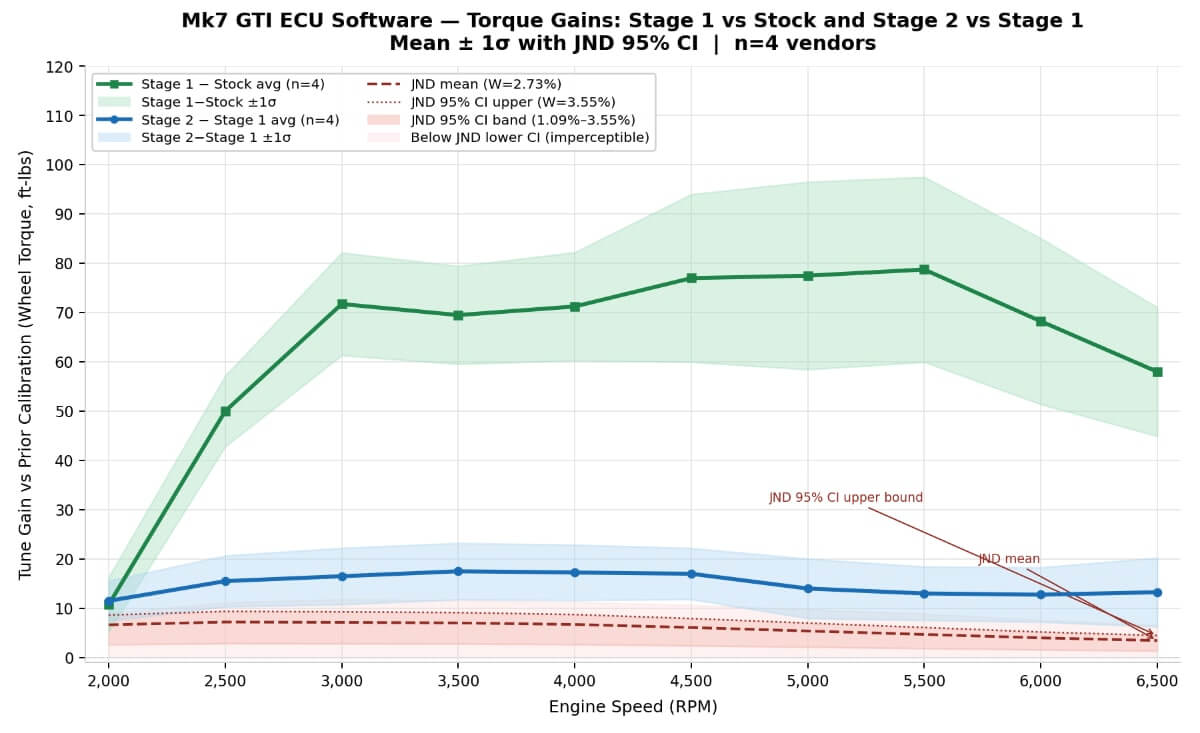
The charts accompanying this post show the average gain for each upgrade, with a shaded band indicating ±1 standard deviation across all four vendors. A dashed red line marks the just-noticeable difference (JND) threshold — the minimum gain a driver can actually perceive, based on the Weber fraction of 2.73% established by Müller et al. (2013) for longitudinal acceleration perception. Gains below that line are statistically real but perceptually undetectable.
WHP:
Stock to Stage 1
Stage 1 over Stock (green line) is a large and unambiguous step. The average WHP gain grows steadily through the rev range, reaching 70–90 WHP by 6,000 RPM.
Stage 1 to Stage 2
Stage 2 over Stage 1 (blue line) is a real but more modest improvement. The average WHP gain peaks around 20–25 WHP in the 3,500–5,500 RPM window, where Stage 2 modifications allow the calibration to push harder.
WTQ:
Stock to Stage 1
Torque gains are similarly substantial across the entire midrange, where most real-world driving occurs. Every vendor, at every RPM, clears the JND threshold by a wide margin.
Stage 1 to Stage 2
Torque gains average 14–22 ft-lbs through the midrange. Importantly, the entire average curve sits above the JND threshold — meaning the improvement is perceptible throughout the rev range, not just at peak torque.
Confidence Level
The four vendors show consistent results in terms of curve shape, which gives confidence in the general conclusion. The ±1σ band is relatively tight for the Stage 2 minus Stage 1 comparison, indicating reasonable agreement across the dataset.
Note: These are vendor-published marketing dynos, not independent back-to-back tests on a single vehicle. Different dynamometers, ambient conditions, and test vehicles contribute to the spread visible in the σ bands.
Also, the JND threshold shown applies specifically to the Stage 1 vs Stock comparison; the threshold for the Stage 2 vs Stage 1 comparison would be slightly higher in absolute terms, but the Stage 2 gain still clears even the more conservative benchmark.
Conclusions
If you’re on Stage 1 and wondering whether Stage 2 is worth the additional investment, the data says yes — you will notice the difference. It won’t feel as dramatic as going from Stock to Stage 1, which was a larger step, but it is a perceptible improvement across the entire rev range.
Think of it as the same type of improvement, at roughly one-third to one-quarter the magnitude. Whether that’s worth the cost of Stage 2 hardware is a personal decision, but you won’t be left wondering if anything changed.