
Background:
A few weeks ago, I conducted a test on the stock charge pipes and ARM Motorsport aftermarket charge pipes. This involved installing an intercooler with stock-size end tank connections, which I selected the Golf R IC for.
Then I switched to the aFe Power charge pipes and the Majesty Competition intercooler to test IC performance.
With data for each intercooler configuration, I decided to analyze how the two products compare.

Test Process:
The test vehicle is a Mk7 GTI equipped with a Shuenk IS48 turbocharger operating on a 93-octane custom tune from Russell Road and Racing.
Full-throttle acceleration is performed in third gear, starting at approximately 2,000 RPM and concluding around 6,500 RPM. The full-throttle acceleration “pull” is repeated several times with a short recovery interval between pulls.
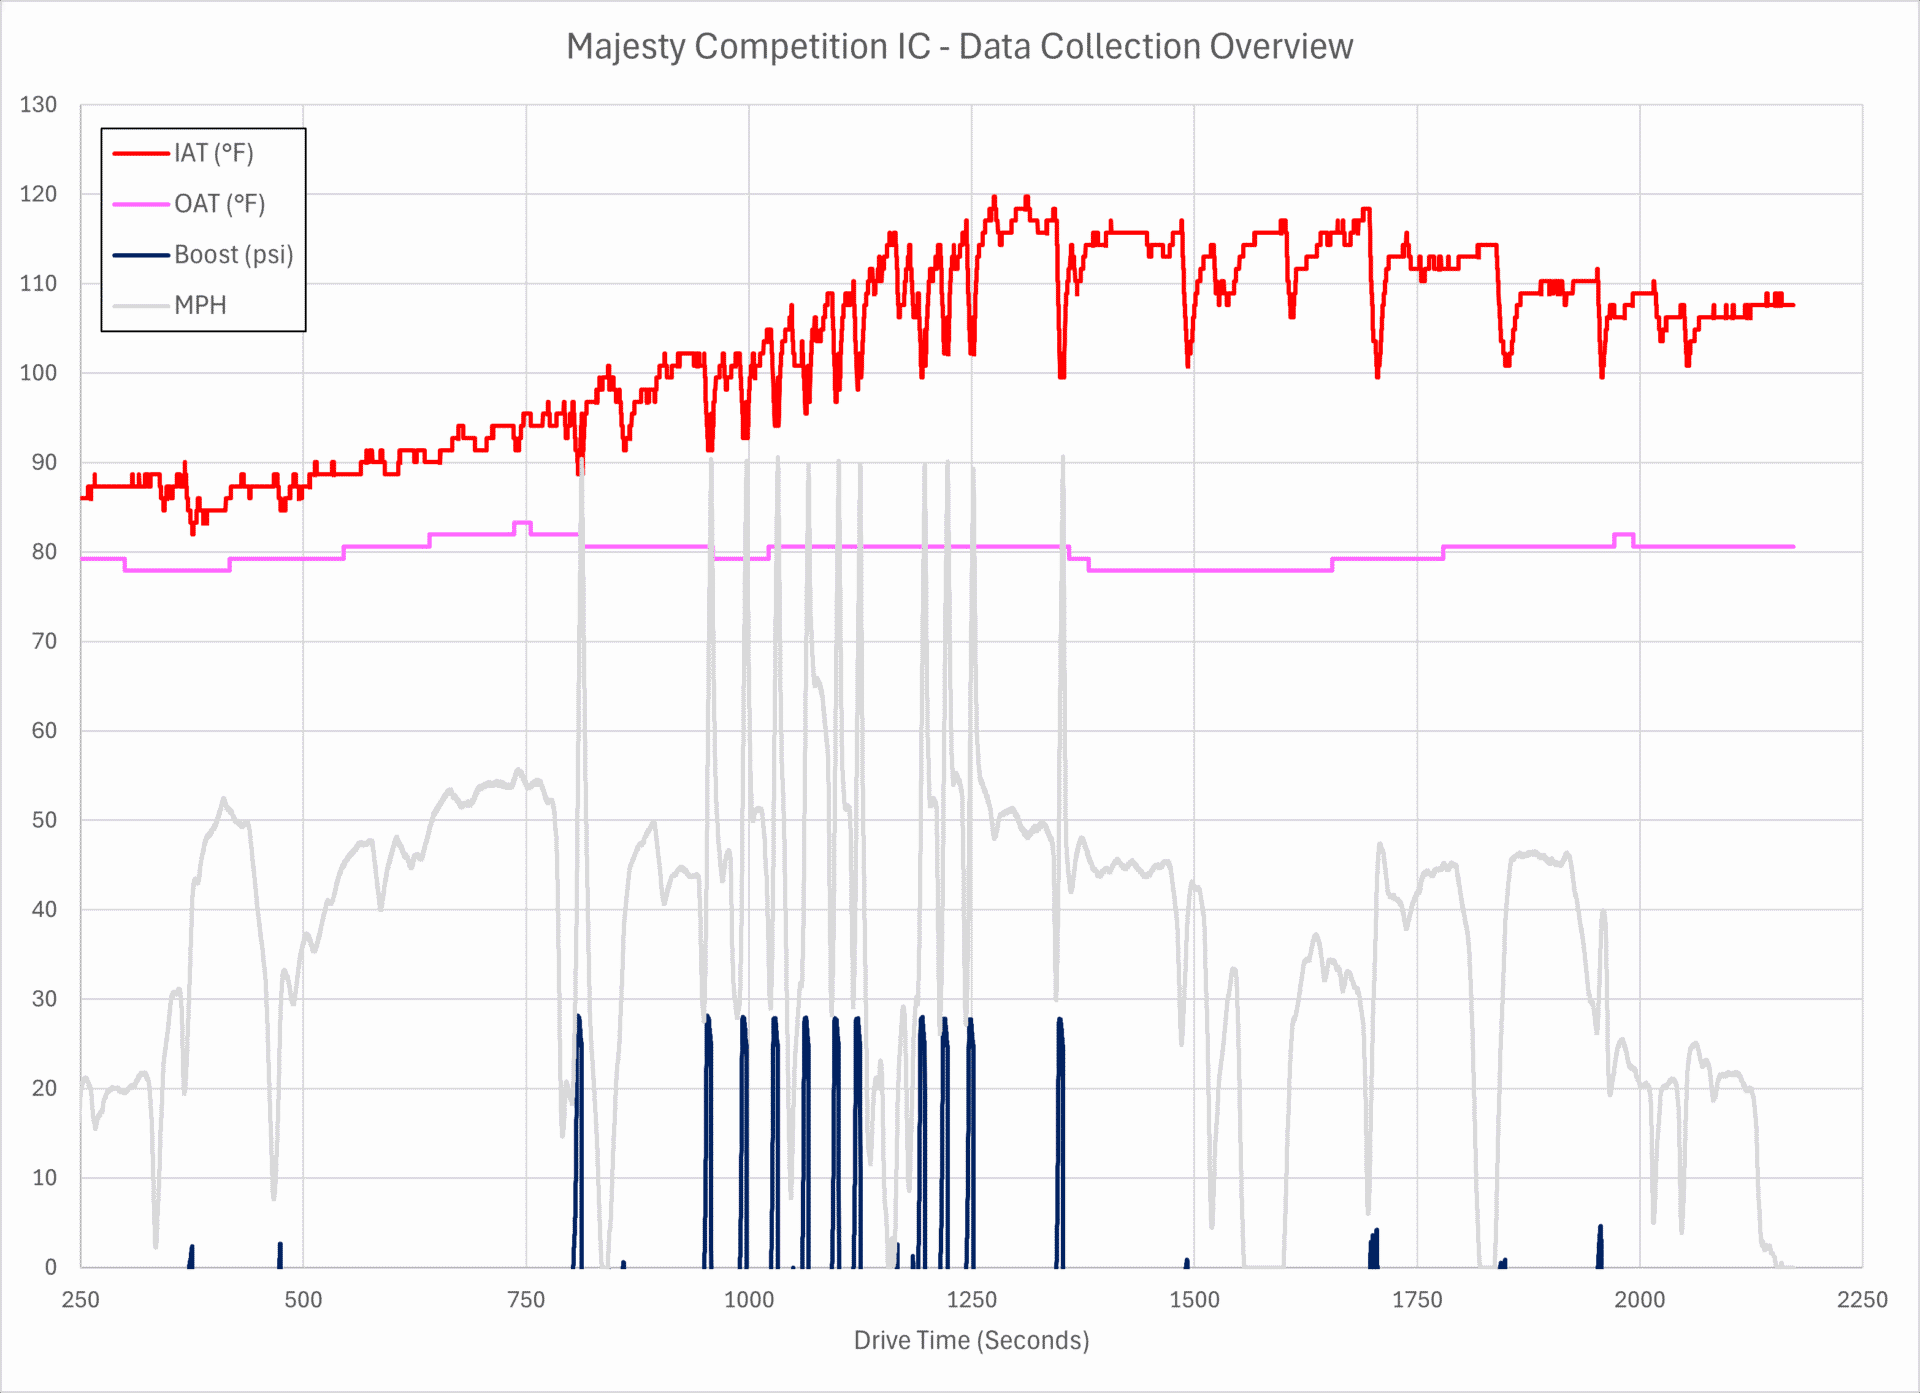
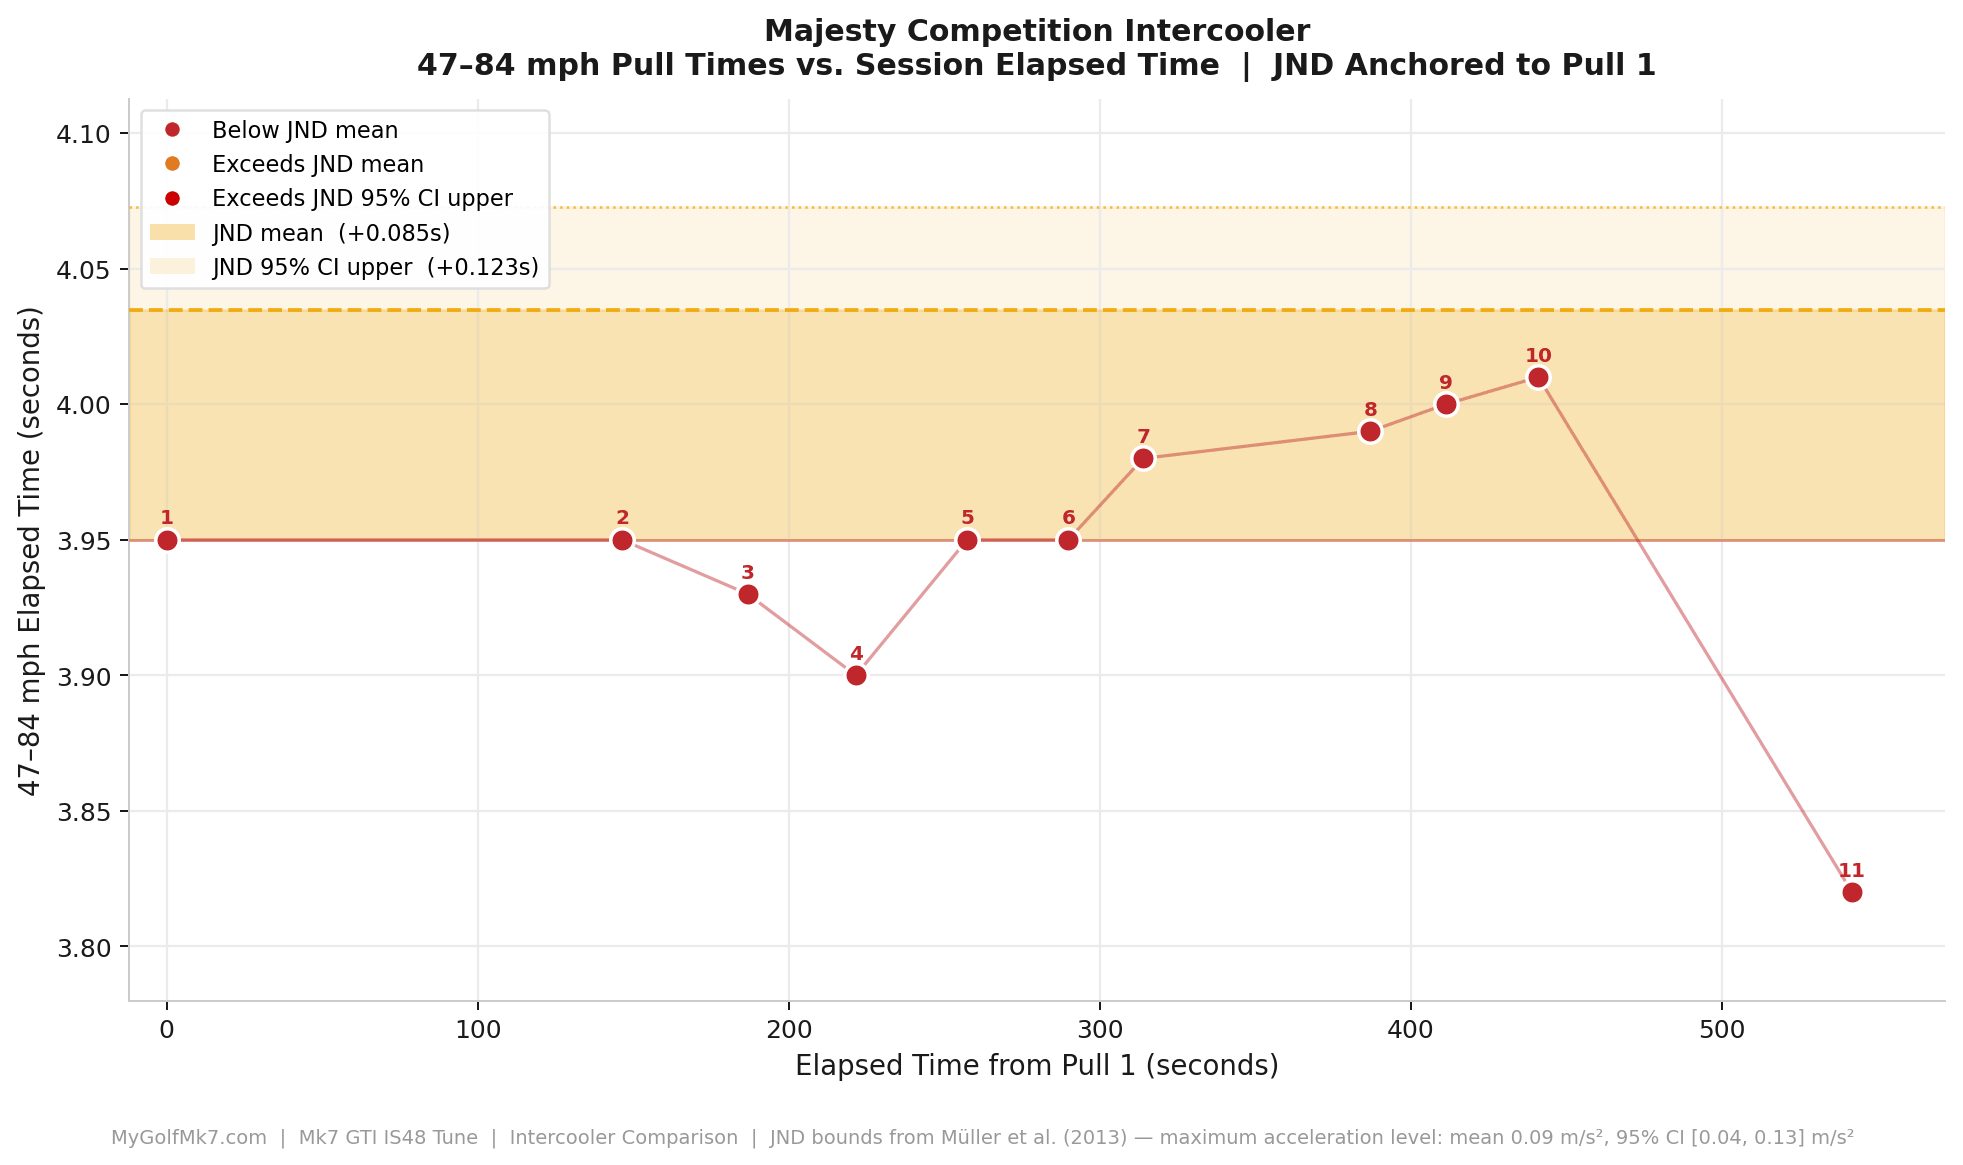
The chart below shows an overview of the data collection session for the Majesty Competition IC; the Golf R session was conducted similarly.
Test results:
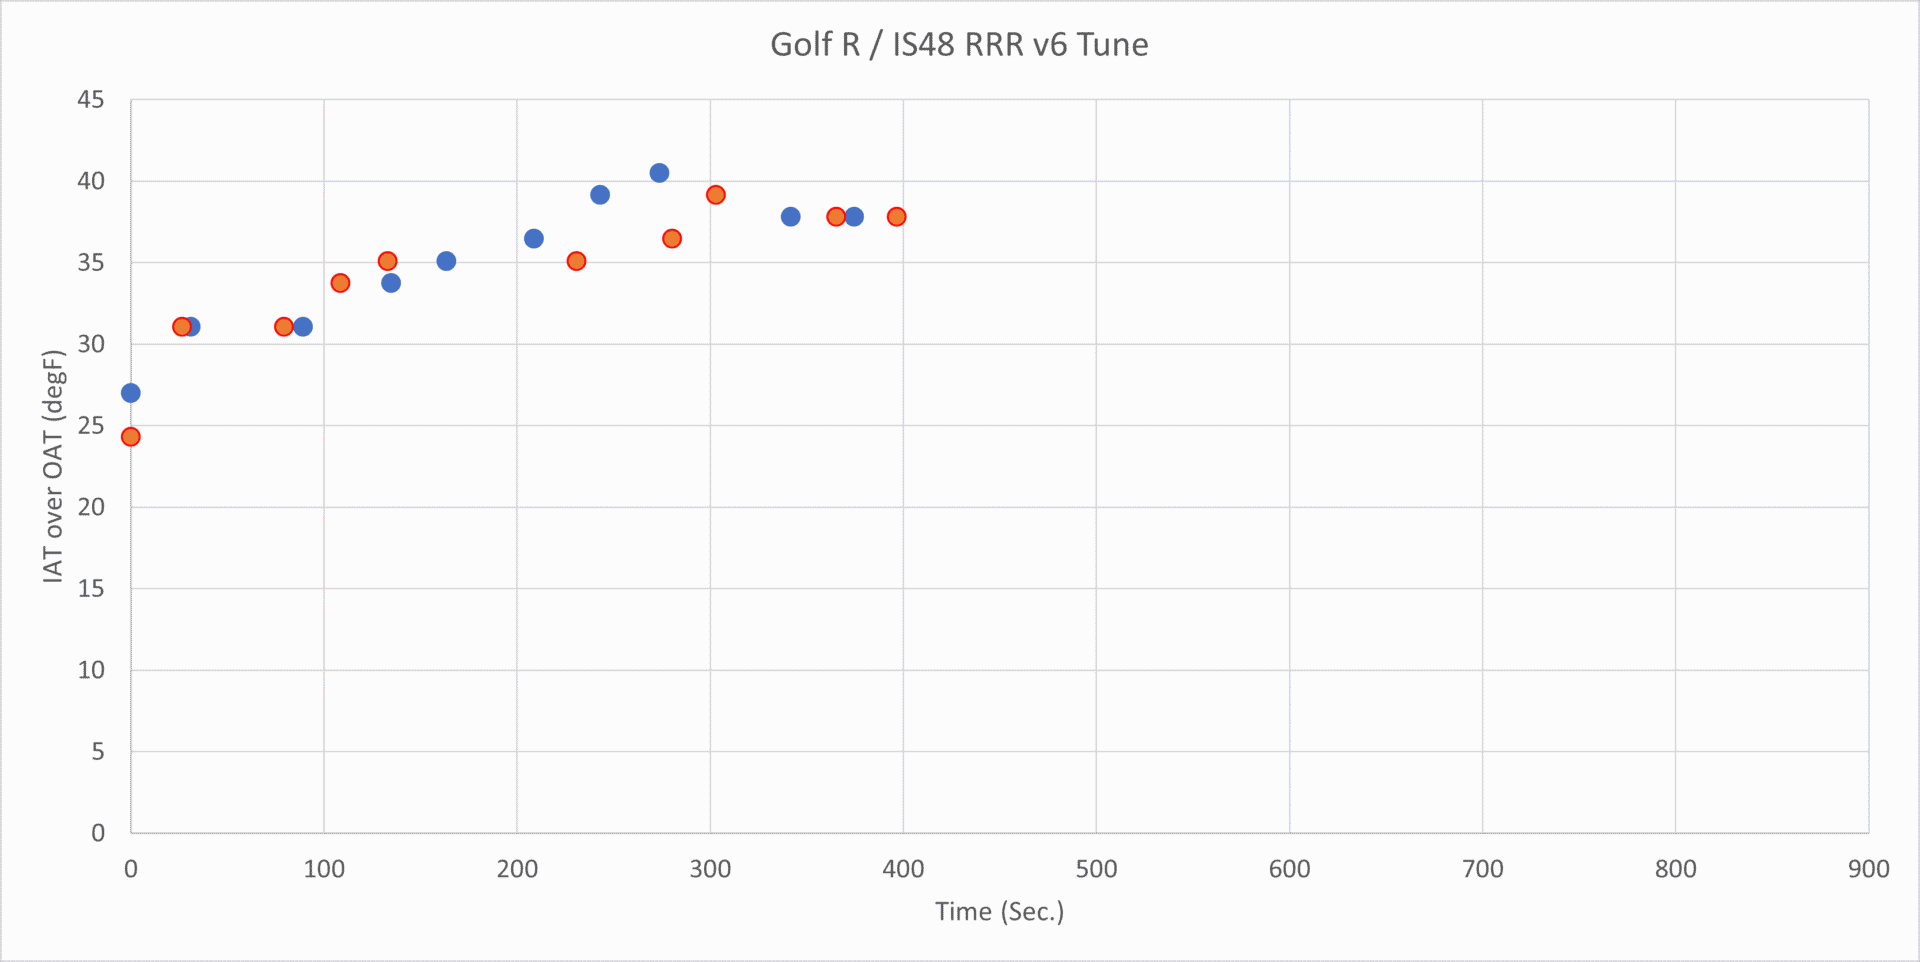
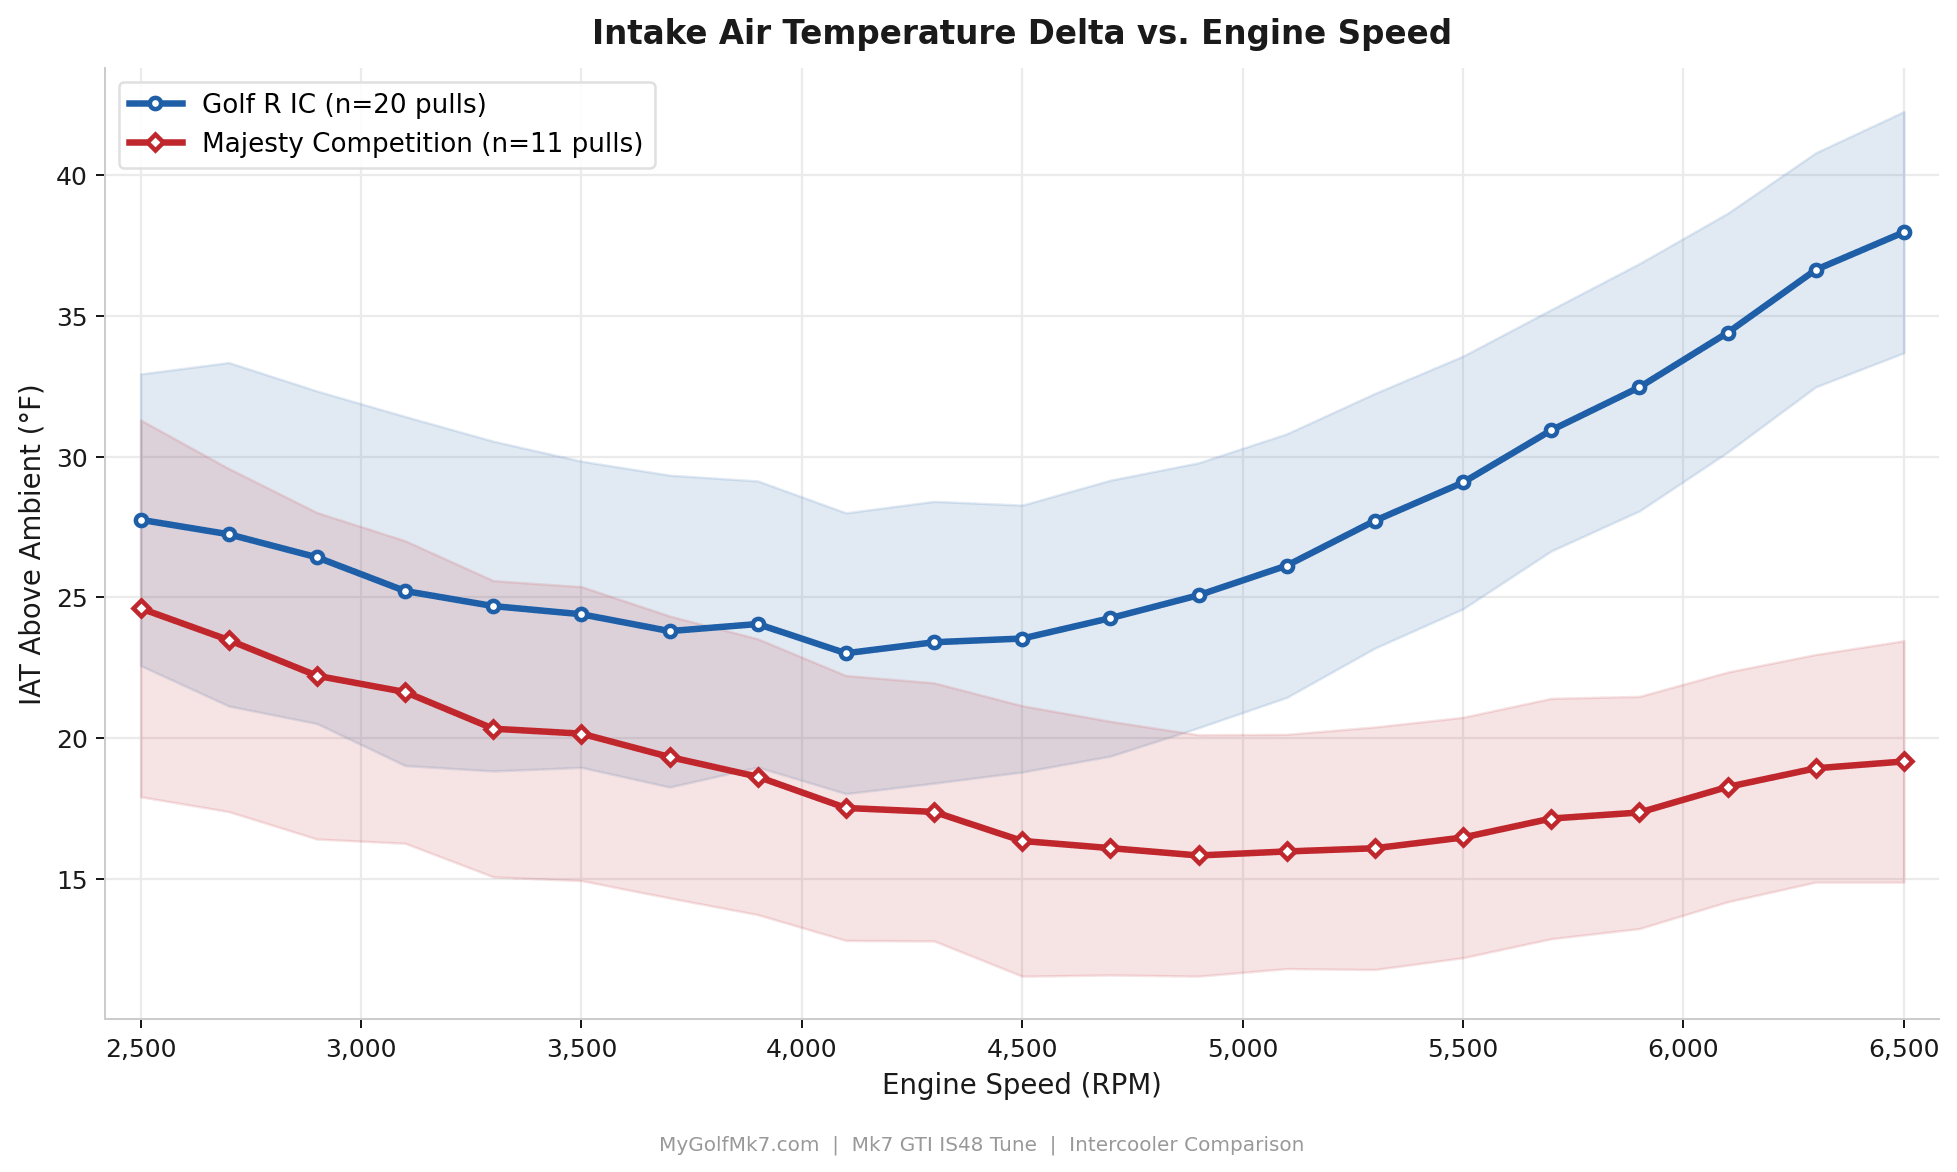
The Golf R IC was tested two times on different days. The results are consistent with the intake air temperature above the ambient air temperature at 6,000 RPM, showing a steady increase, then stabilizing between 35 and 40 degrees Fahrenheit.
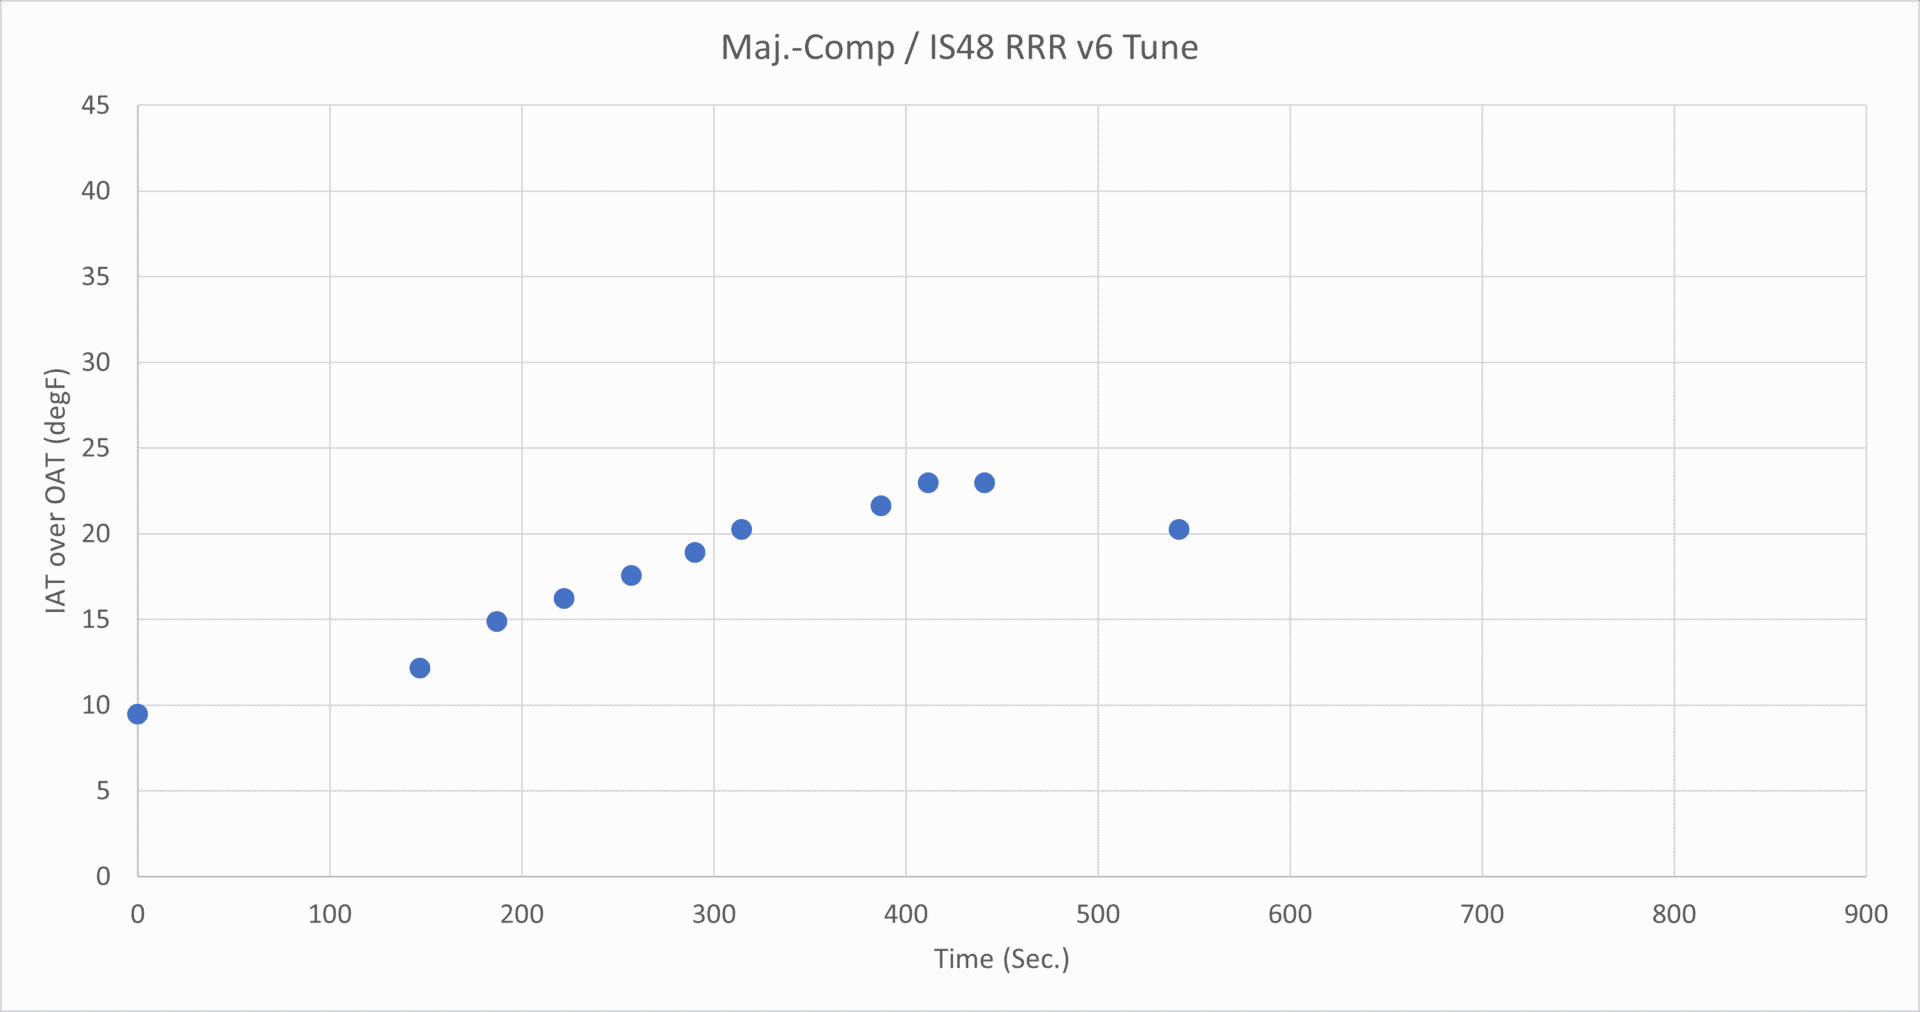
The Majesty Competition IC shows a similar upward trend but starts lower, stabilizing around 20 to 25 degF.
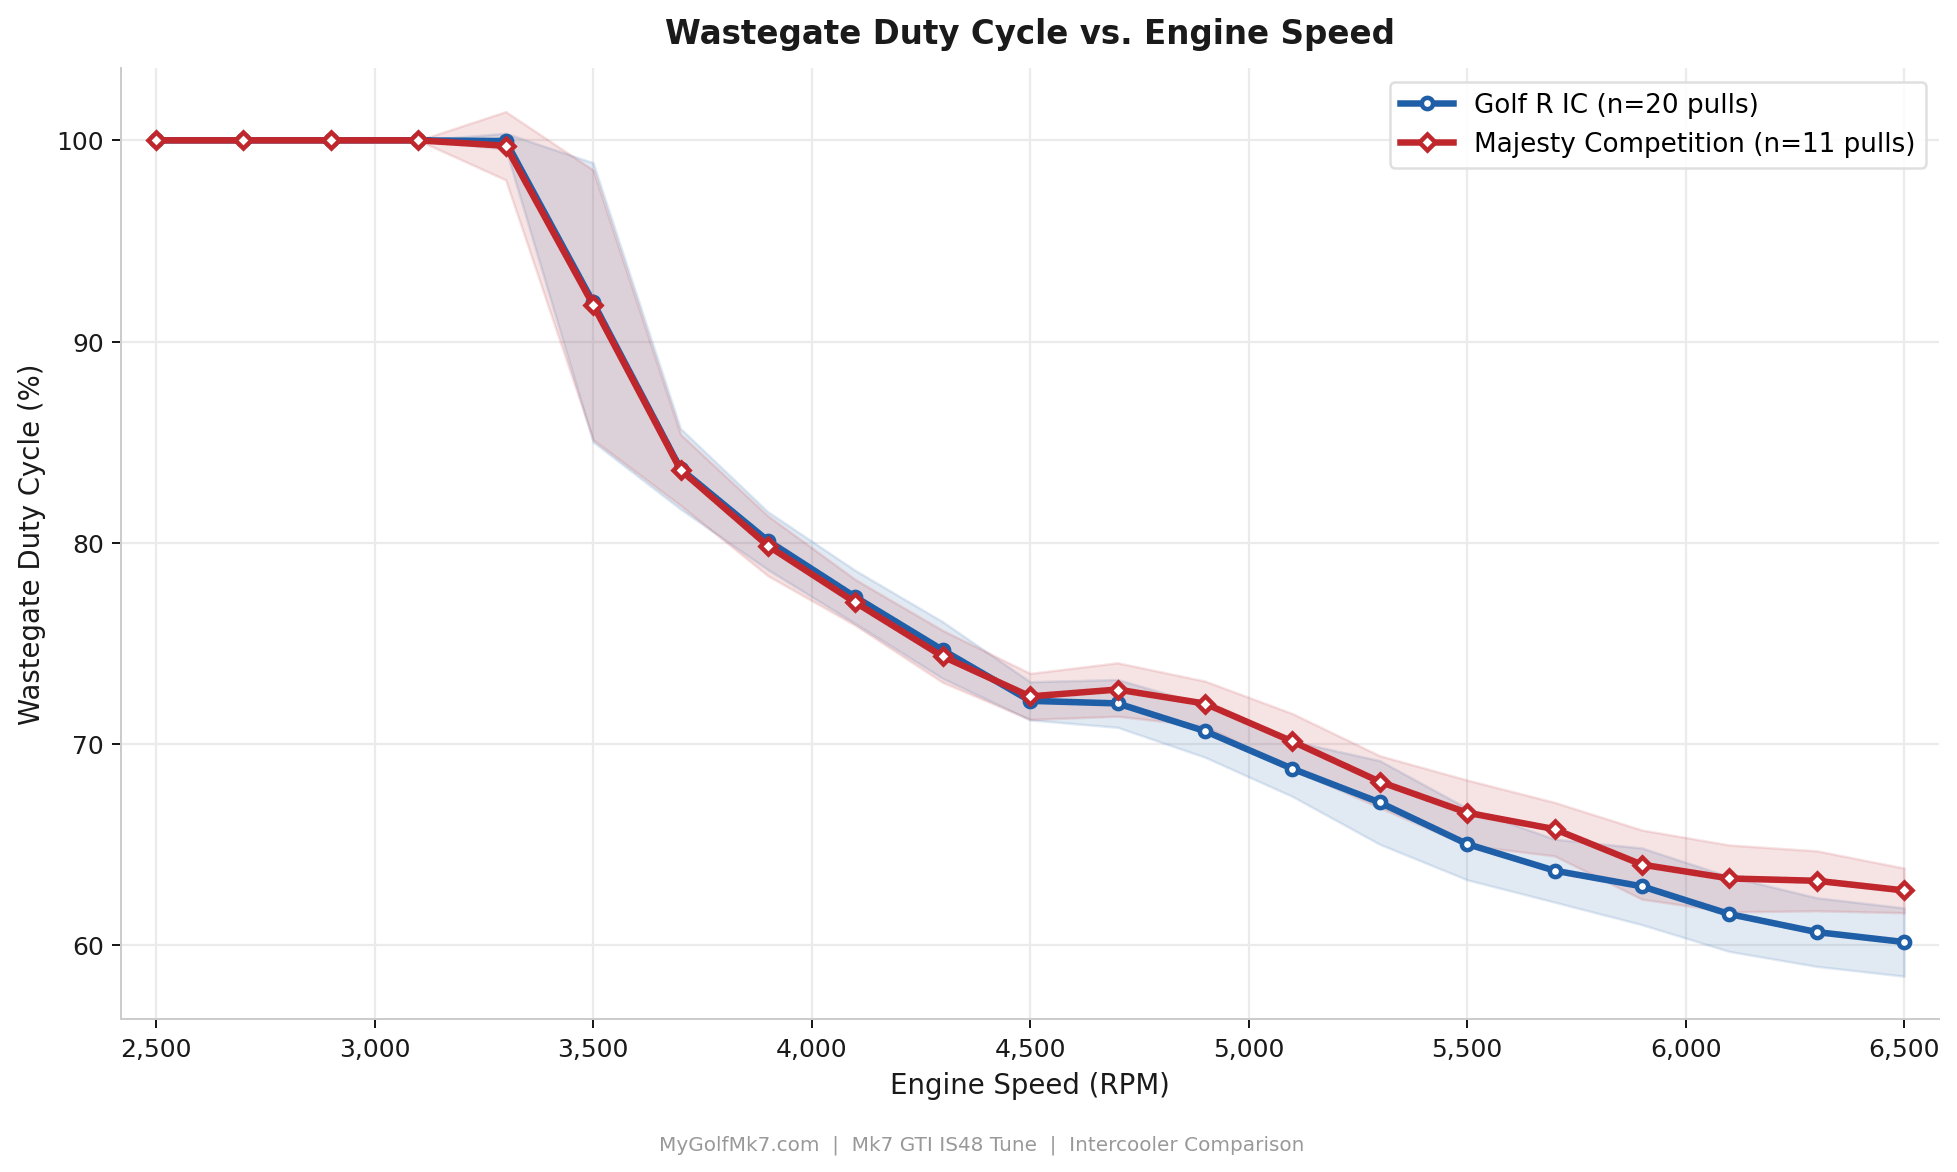
The boost pressure averages for either intercooler are unchanged.
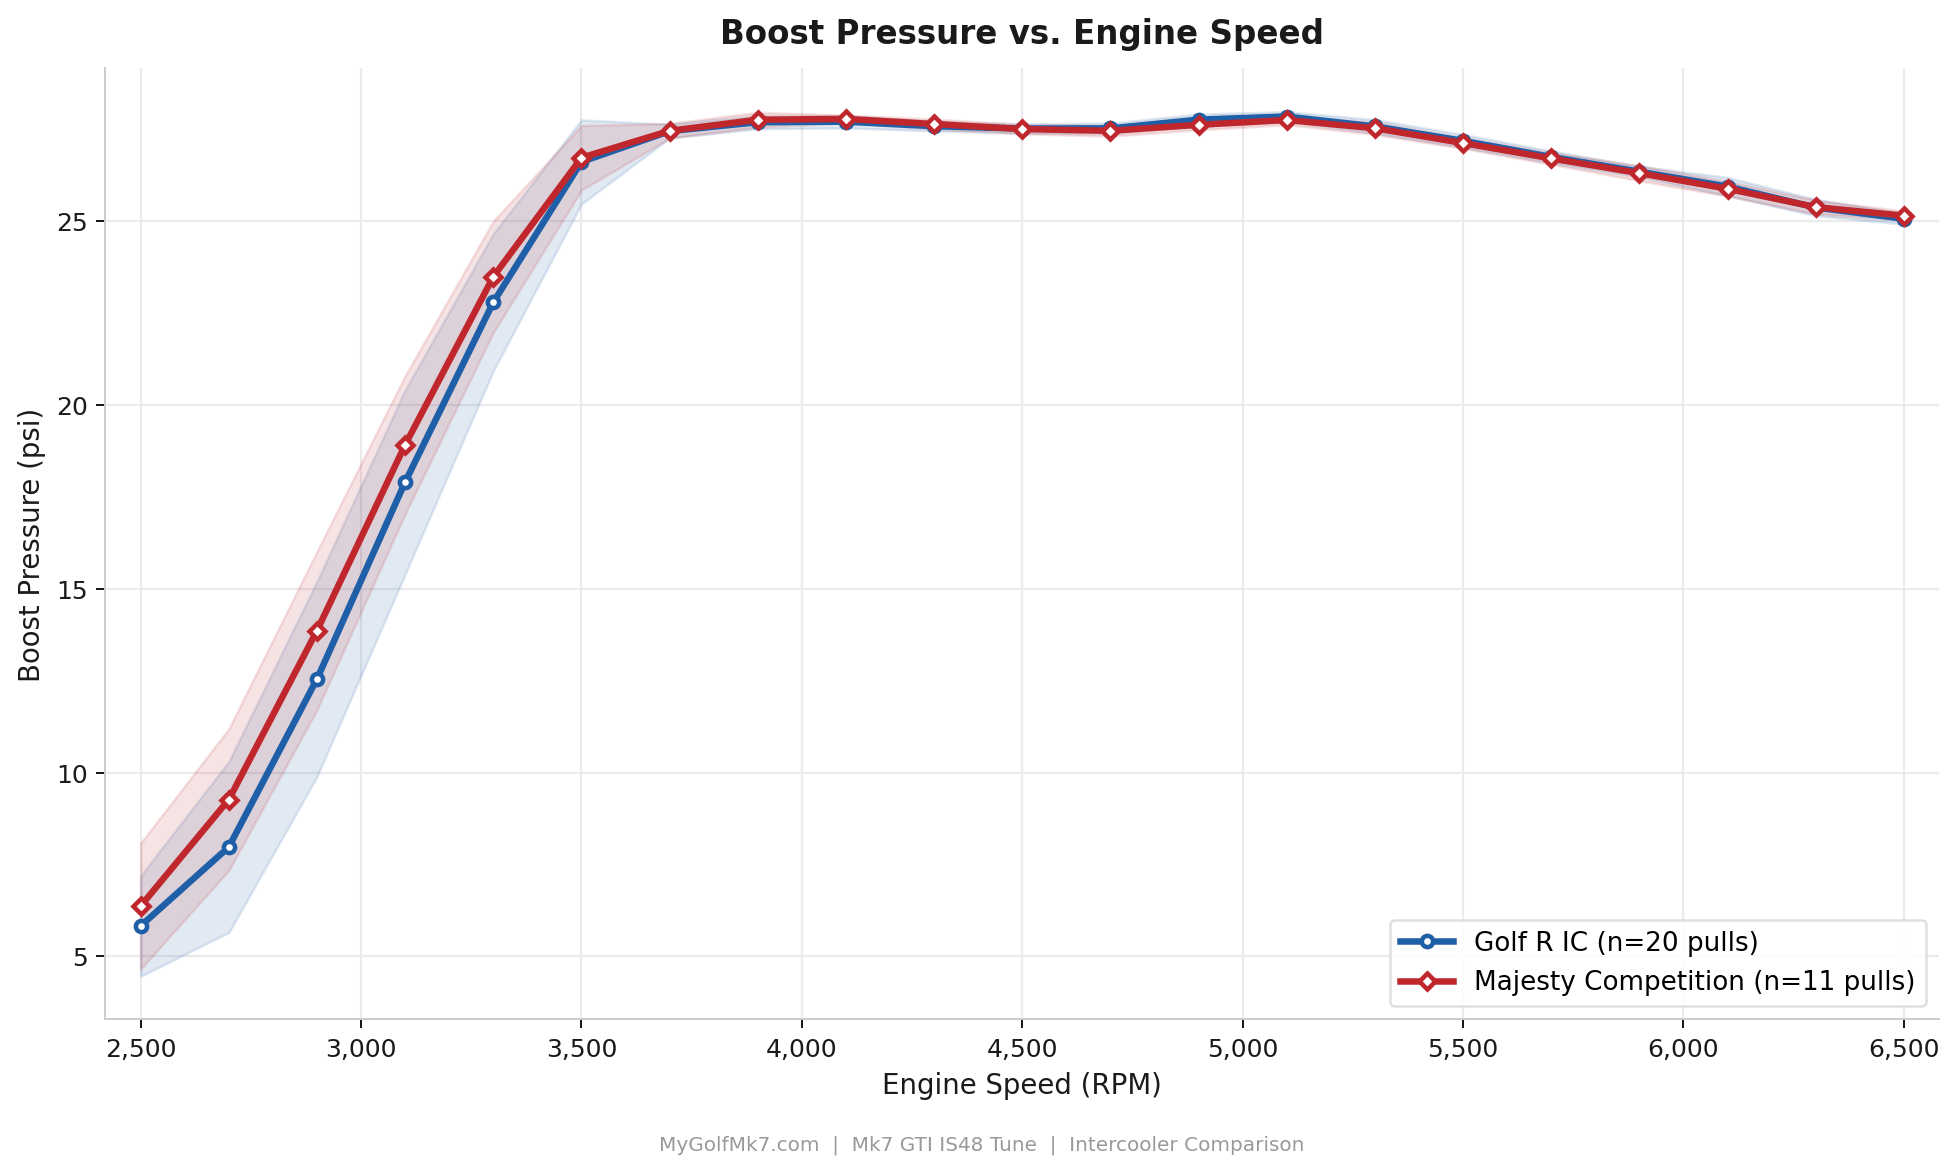
The average turbocharger wastegate duty cycle is very similar for both intercoolers, with a slightly higher reading from the Majesty Competition IC, likely due to variation in the intake system air temperature rather than any effect of the intercooler.
The higher intake air temperature from the Golf R IC is shown clearly on the delta IAT chart.
Note: The shaded regions around the average temperature line are the standard deviation.
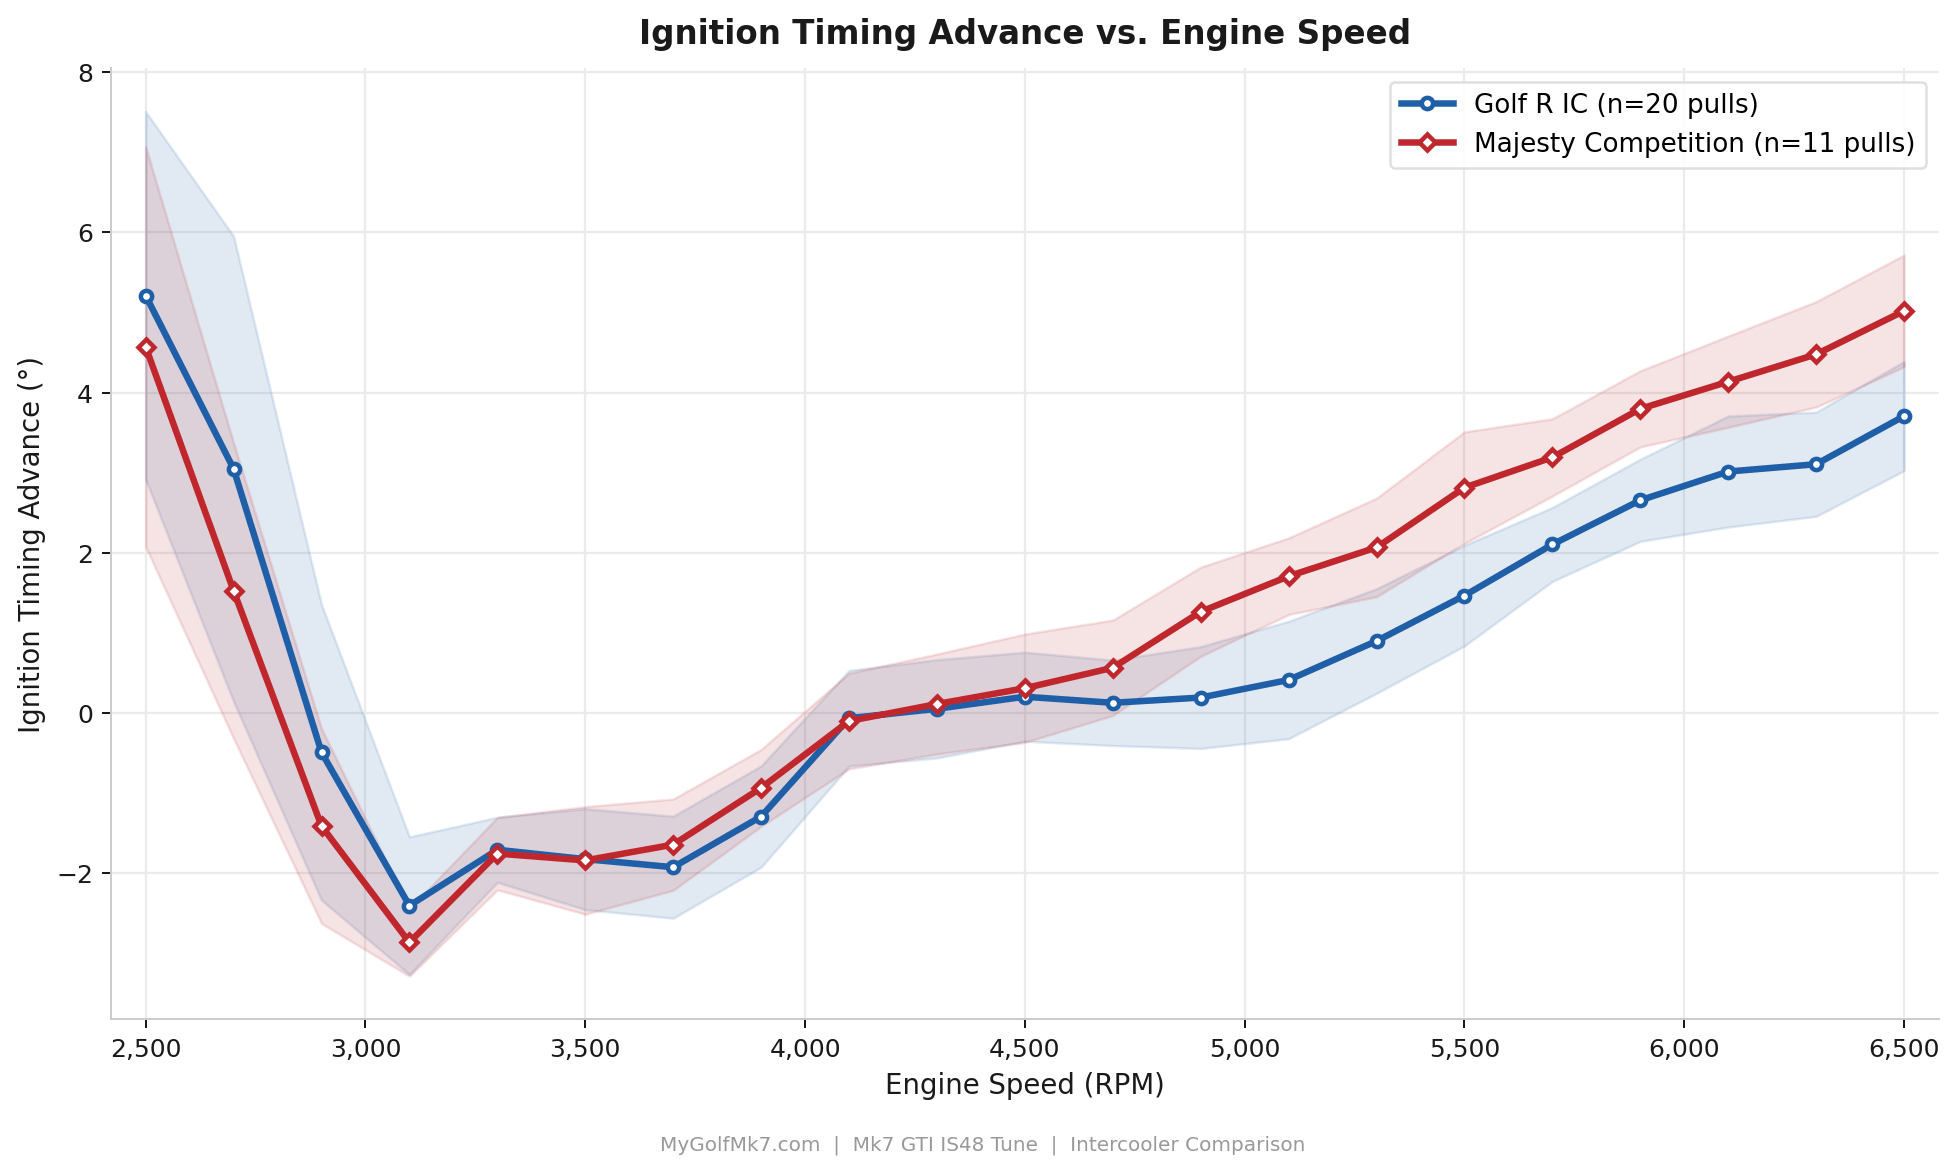
The higher IAT of the Golf R IC translates to a couple of degrees less timing advance than the Majesty Competition IC.
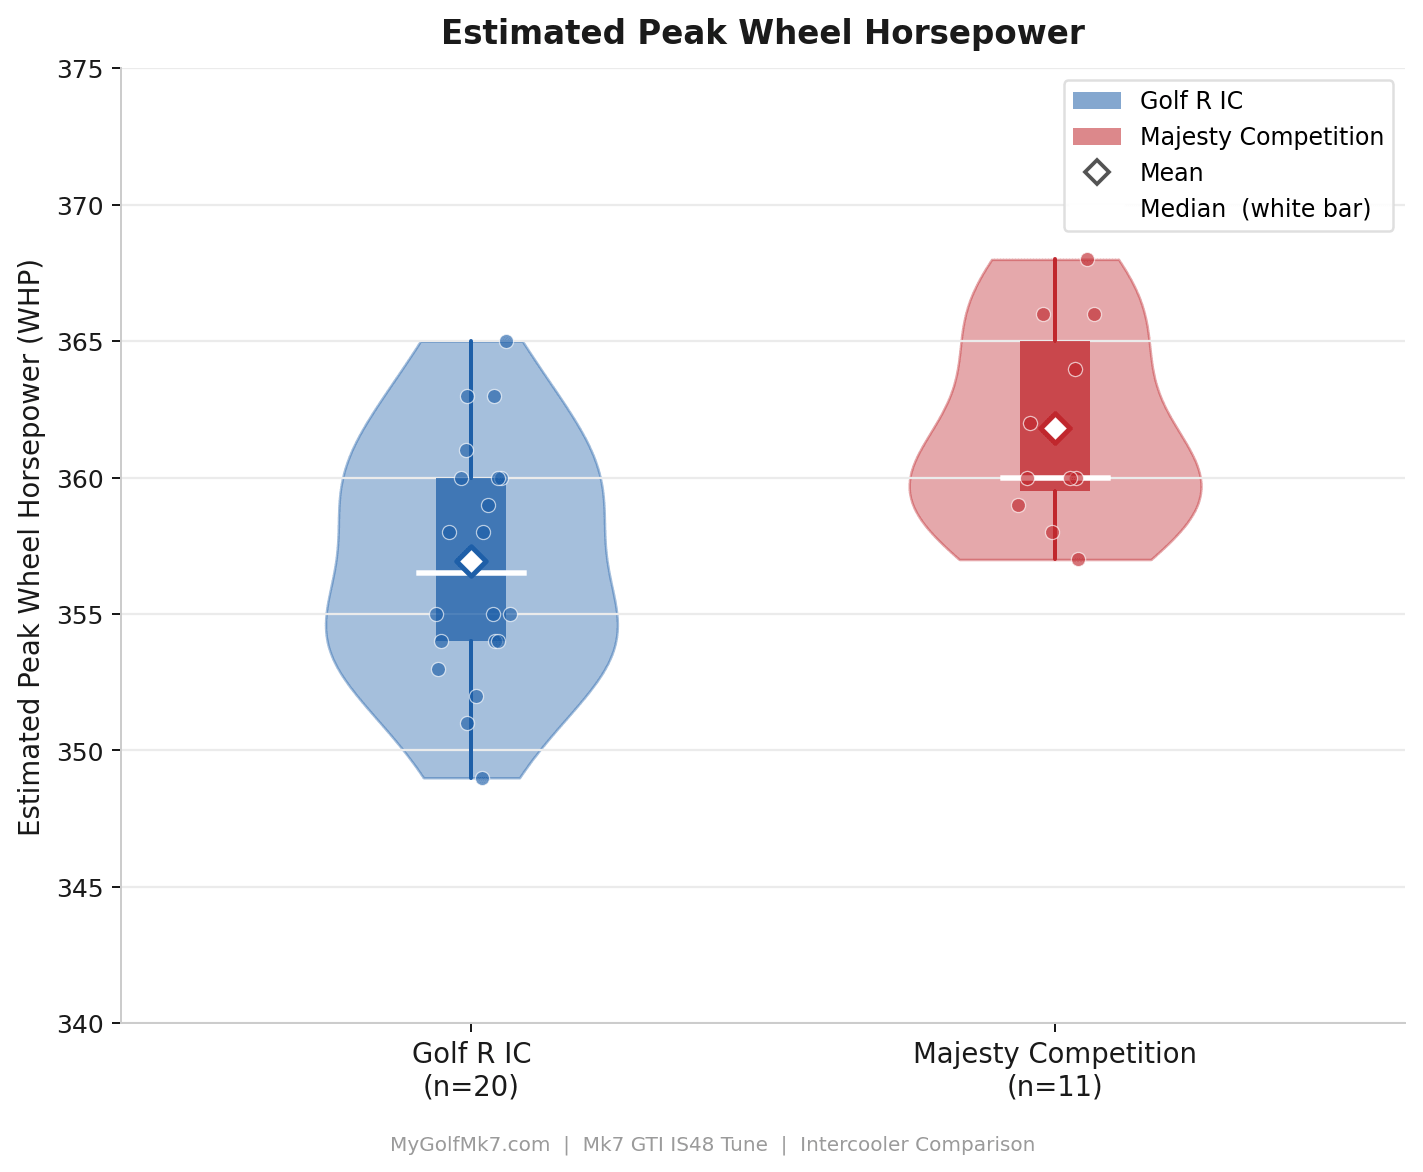
Peak WHP with the Majesty IC improved by +4.9 WHP (Golf R: 356.9 WHP vs. Majesty: 361.8 WHP)
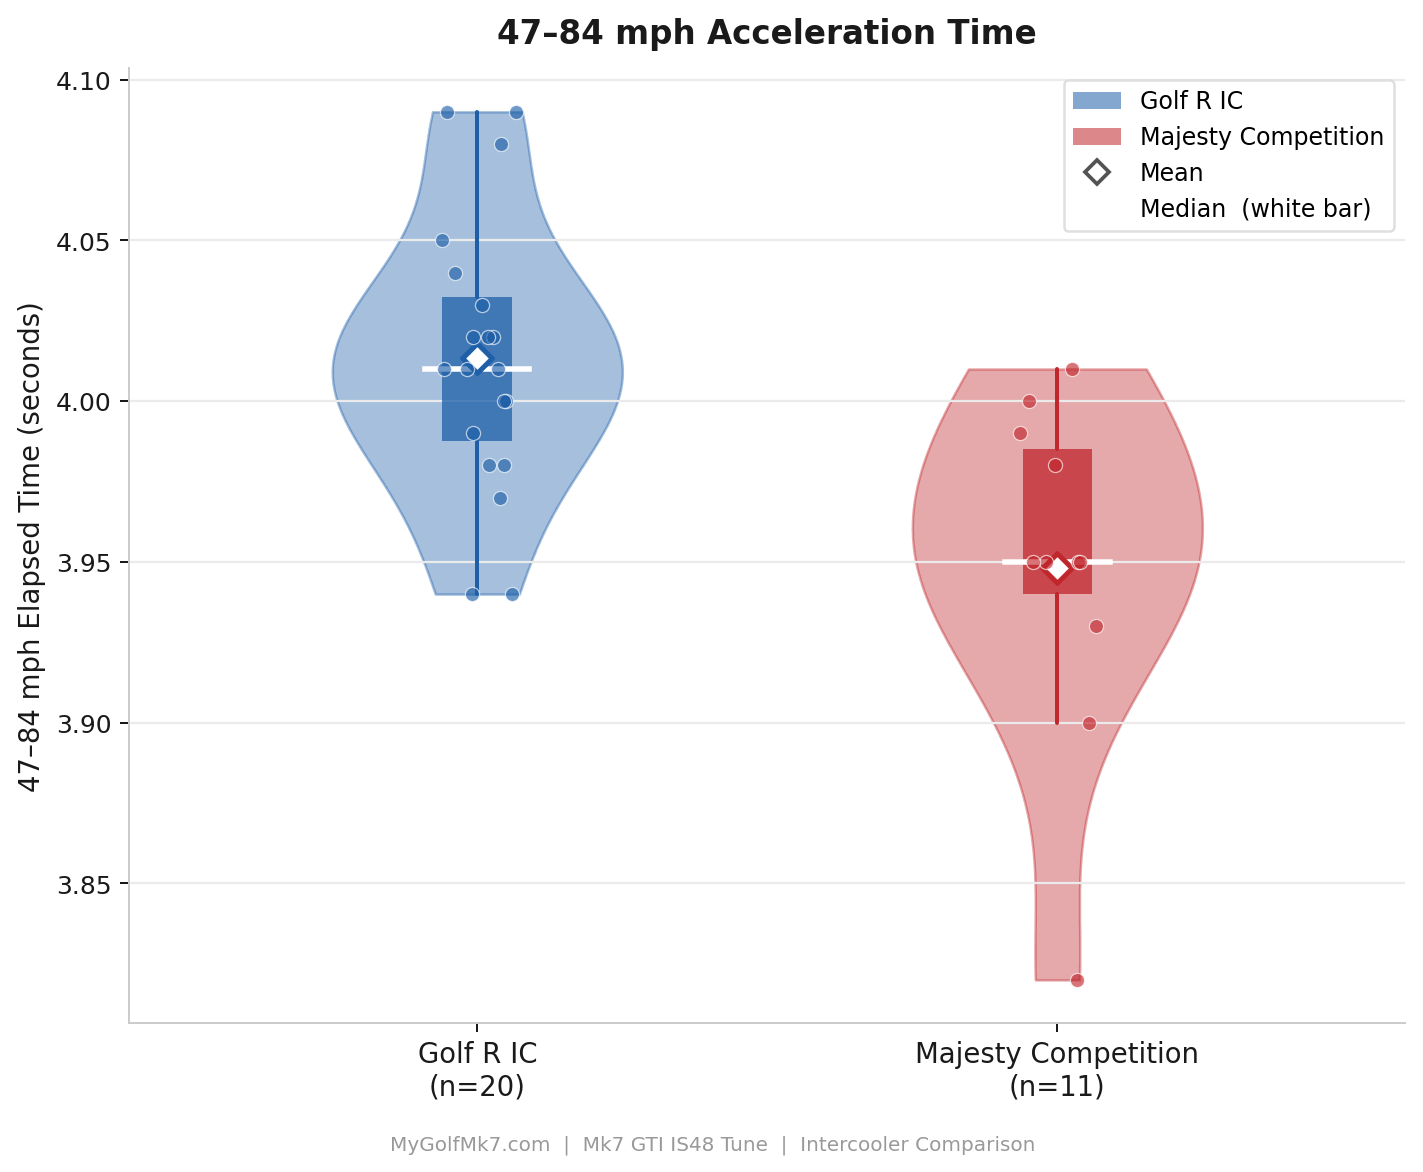
Acceleration Times – Across 31 timed pulls, the Majesty Competition IC ran the 47–84 mph interval in 3.948s vs. 4.013s for the Golf R IC — a delta of −0.065s.
Acceleration Curves
The key finding visible here is that the gap between the two mean lines exceeds the Müller JND mean in only two RPM bins — 5,300 and 5,500 RPM — where the green shading appears. Across the rest of the 3,500–6,300 RPM range, the difference between the two configurations falls within the gray sub-threshold band.
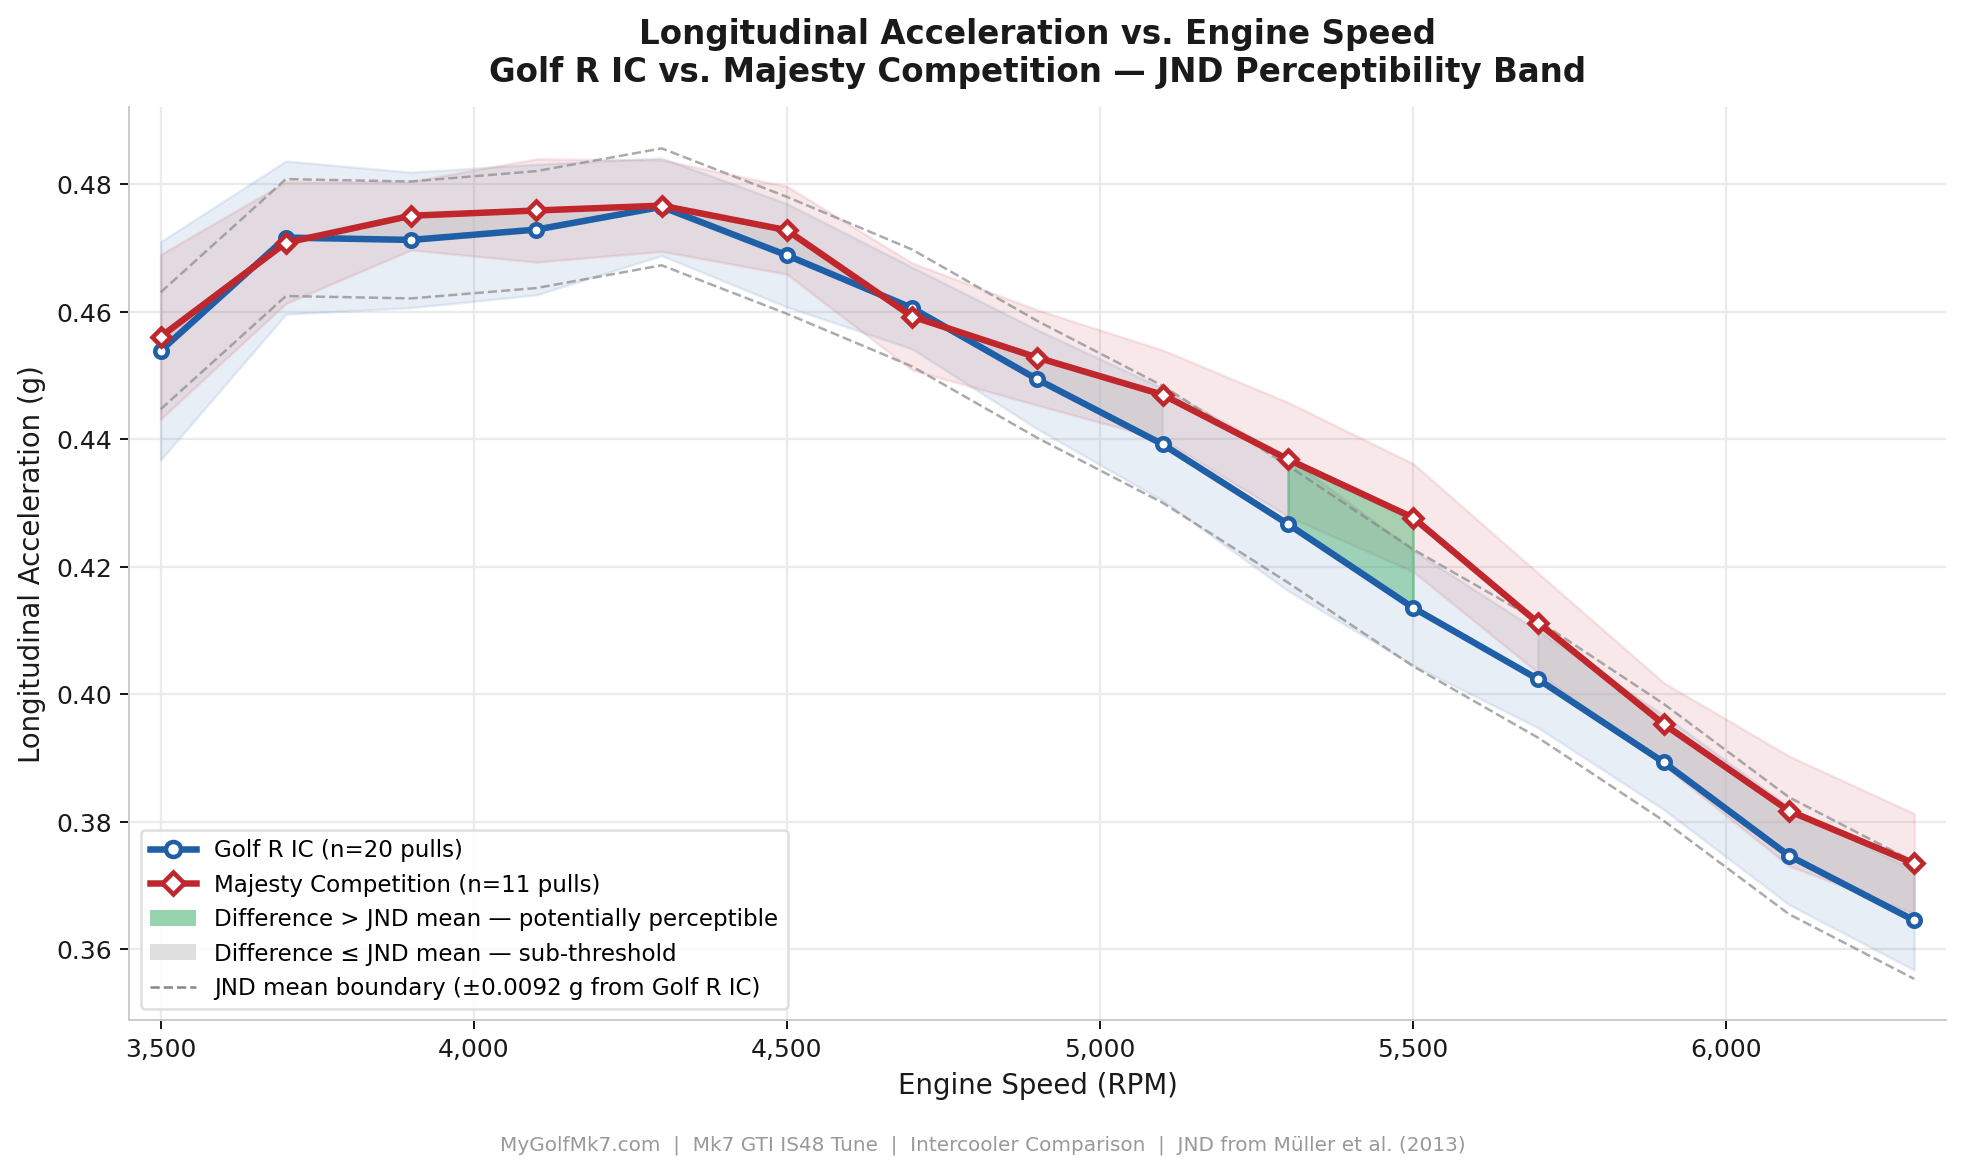
Causal factor hypothesis – The two bins where the difference is perceptible (5,300–5,500 RPM) correspond to the upper-mid range where boost has been fully developed for some time, and the IAT difference between the two intercoolers is at its widest, consistent with what the IAT delta and ignition timing charts showed. This is also where the Majesty IC’s superior thermal performance translates most directly into timing advance and, in turn, measurable acceleration.
It is also worth noting that the ±1 SD envelopes (the very faint shaded halos behind each mean line) are substantially wider than the gap between the means across most of the range. This means pull-to-pull variation within a given configuration is larger than the difference between configurations at most RPM points — another way of illustrating that a driver is unlikely to feel the difference reliably in real use outside of that narrow upper-mid RPM window.
Data Validity Checks – Results:
t-Tests:
47–84 mph Acceleration Time
Using a Welch’s independent samples t-test with H₀ = 0 and α = 0.05, H₀ is rejected. The difference is statistically significant.
Peak Wheel Horsepower
H₀ = 0 is rejected. The difference is statistically significant.
In both cases, the p-value is well below the 0.05 threshold, providing strong statistical evidence that the intercooler change produced a real improvement in both metrics.
Power Analysis:
47–84 mph Acceleration Time
Cohen’s d = 1.40, which qualifies as a large effect. To achieve power = 0.80 with this effect size and the 20:11 sample ratio, only 7 Majesty pulls and 13 Golf R pulls would have been required. The 11 Majesty pulls collected are more than sufficient.
Peak Wheel Horsepower
Cohen’s d = 1.17, also a large effect. The minimum required to reach 0.80 power was 10 Majesty pulls and 18 Golf R pulls — the study collected 11 and 20, respectively, just clearing the threshold for this metric.
Summary
Both comparisons are adequately powered. The acceleration time test has a comfortable margin above 0.80, while the WHP test meets the criterion with less headroom.
JND Analysis
A couple of weeks ago, I posted about the “Just Noticeable Difference.”
Briefly, the Müller JND was measured in a direct A/B sequential comparison, in which two pulls using a BMW were presented within roughly 20 seconds of each other under highly controlled conditions. That is the most favorable possible scenario for human detection. In normal driving — where you are not consciously comparing back-to-back pulls — the effective perceptual threshold would be higher, making the difference less likely to be noticed.
JND Mean (+0.086s / +0.085s)
The JND mean line (darker dashed line) marks the point at which the average person, if given a direct back-to-back comparison, would just begin to notice that one acceleration run felt slower than another. It is derived from a controlled study in which 15 subjects experienced pairs of acceleration events in an instrumented vehicle and were asked to identify which felt stronger. Half of those subjects could detect differences smaller than this line; half could not. Think of it as the 50/50 line — a pull landing above it is more likely than not to be perceptible to a driver who has an immediate reference to compare against.
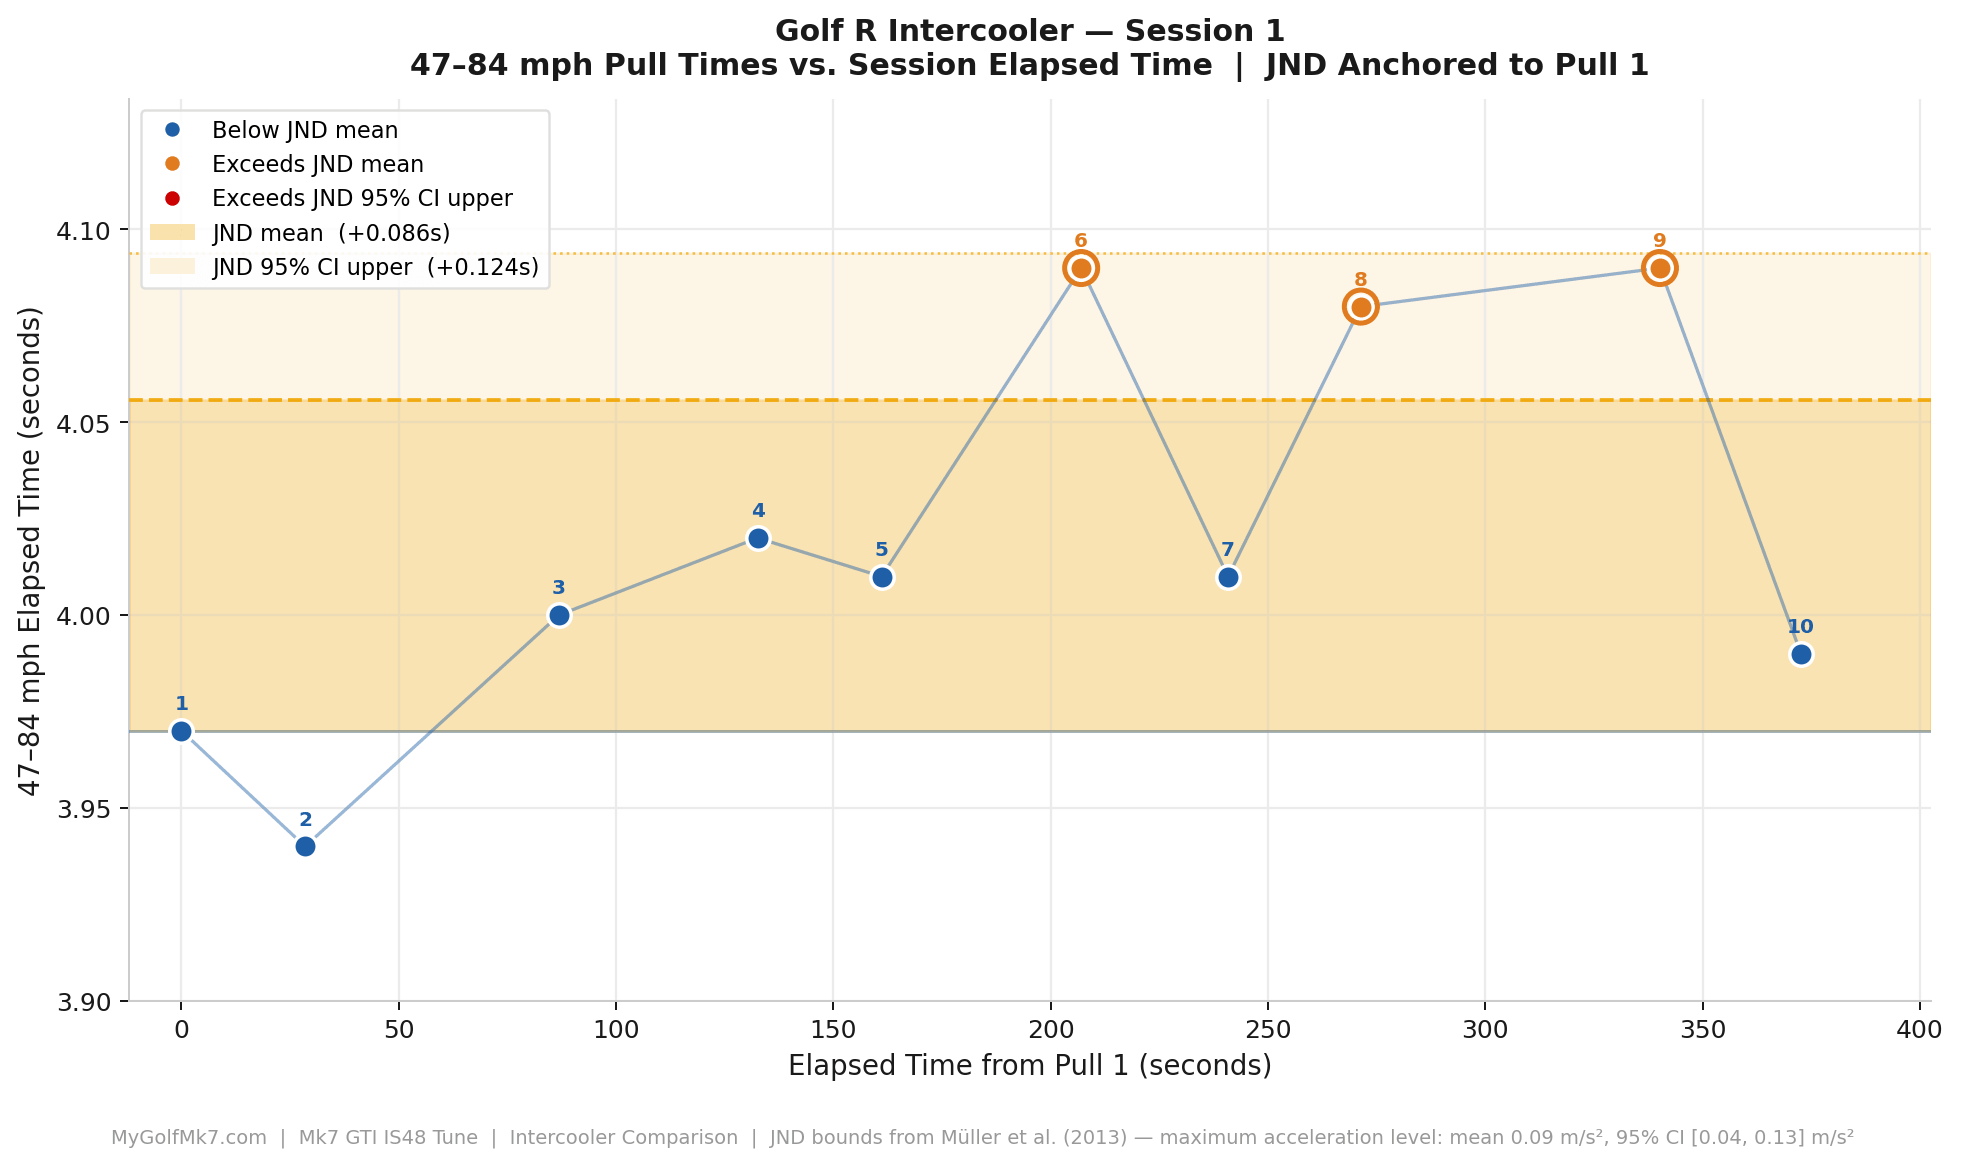
JND 95% Confidence Interval (CI) Upper (+0.124s / +0.123s)
This line (light dotted line) represents the upper boundary of the range within which the study’s results are statistically reliable. In practical terms, it marks the threshold above which even the least sensitive drivers in the study would be expected to detect a difference. A pull landing above this line would likely be noticeable to nearly any driver — even without a direct back-to-back comparison to serve as a reference. Below this line and above the JND mean, detection depends on how sensitive an individual driver is.
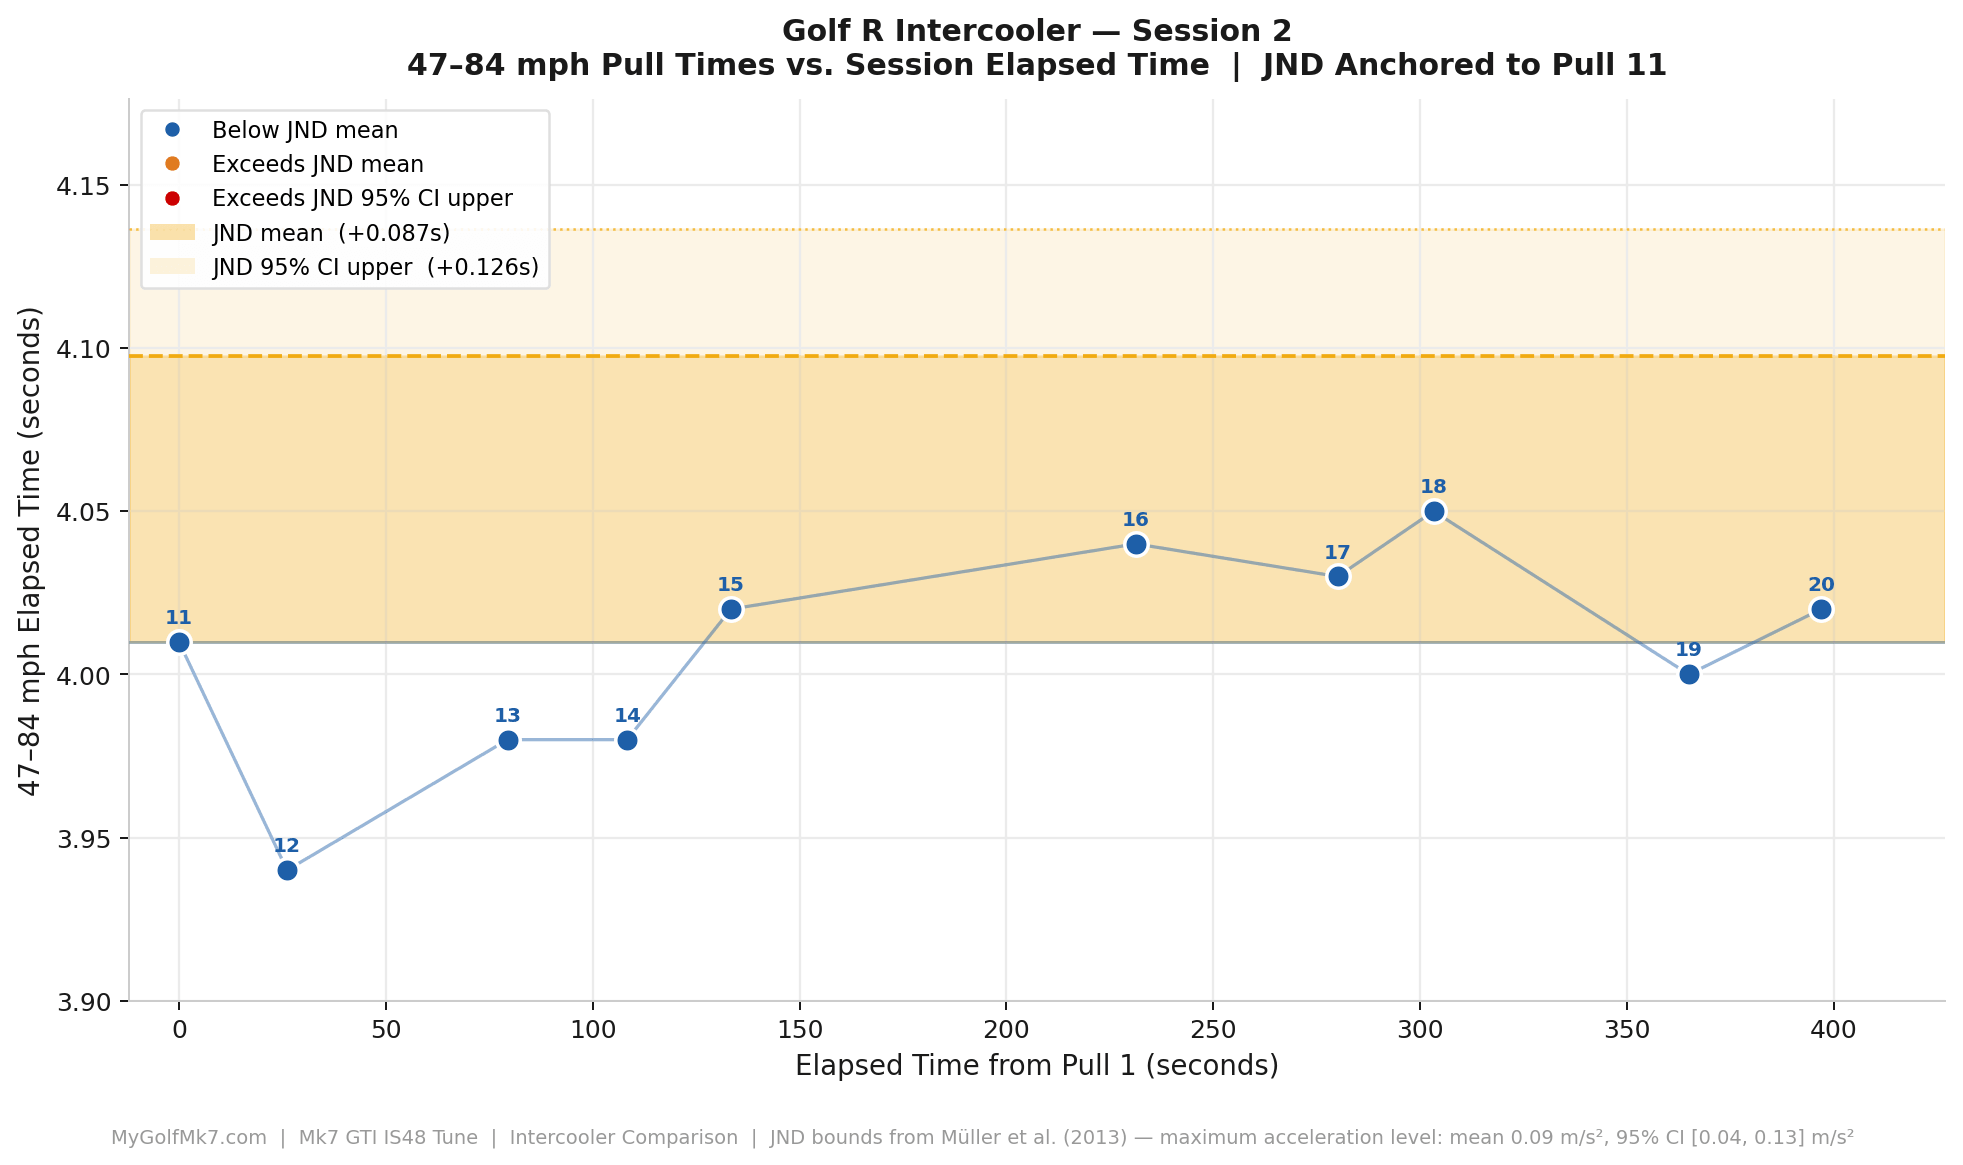
With the Golf R IC, across the two sessions, three pulls exceeded the threshold at which the driver would notice a change in acceleration rate.
During the Majesty IC session, none of the pulls crossed the threshold at which the driver would notice a change in acceleration rate.
A note on context:
Both thresholds were established under ideal conditions — two acceleration events presented within roughly 20 seconds of each other on a closed test track, with the driver’s full attention on detecting a difference. In normal driving, where pulls are separated by minutes of cruising, and the driver has no reason to actively compare, the effective detection threshold is higher than either line shown. The chart lines, therefore, represent a best-case scenario for perception, not a typical one.
Conclusions:
The Majesty Competition IC delivers a statistically verified performance improvement over the Golf R IC on this IS48-tuned Mk7 GTI — approximately 5 peak WHP, and 0.065s in a 47–84 mph roll, driven by a consistent 9°F reduction in intake air temperature that allows the ECU to advance timing.
Boost pressure, and WGDC remain unchanged, so this is purely a thermal-efficiency effect, not due to flow restriction.
Whether you can feel it in normal driving is a different question. According to Müller et al. (2013), the measured acceleration difference of ~0.054 m/s² is below the mean human perception threshold for longitudinal acceleration (0.09 m/s²). The instruments can measure it; most drivers won’t feel it in isolation. Where the Majesty IC’s advantage becomes more tangible is in sustained hard use — back-to-back pulls, autocross, or a track day — where the superior thermal efficiency reduces the IAT creep that progressively robs timing from the Golf R IC configuration.