
Background:
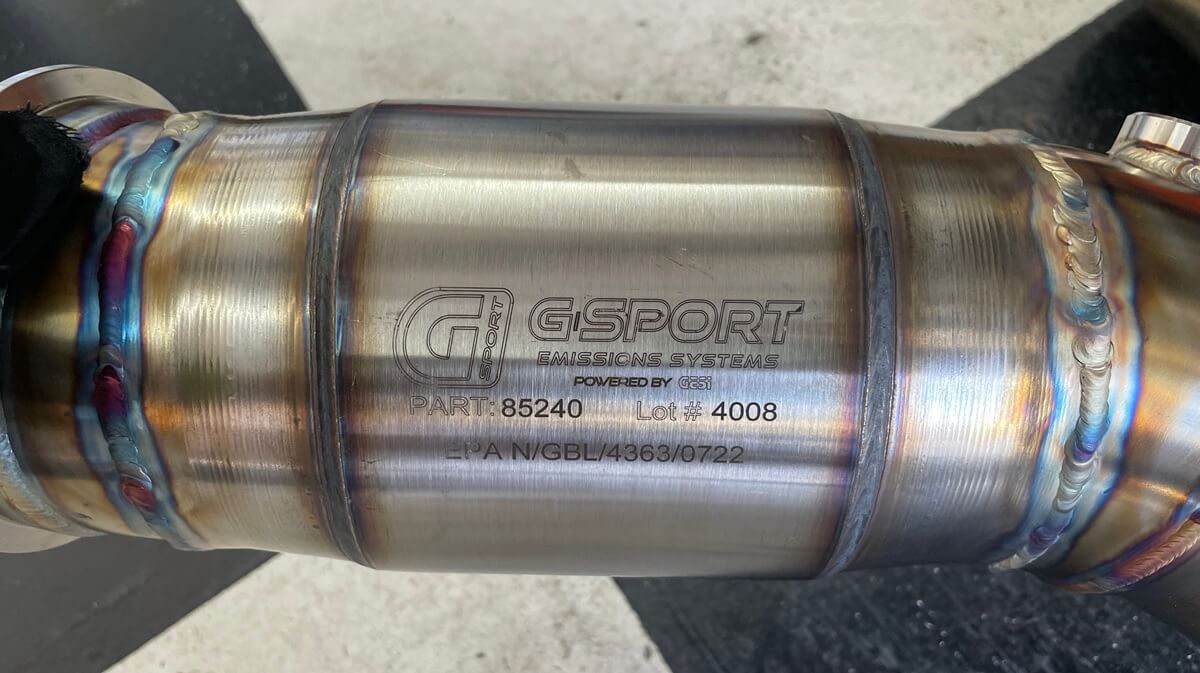
With the CC Design GESi cat midpipe installed on the Mk7 GTI the car was driven to record sound level and frequency from the exhaust system and make comparisons with the same setup without the catalytic converter.
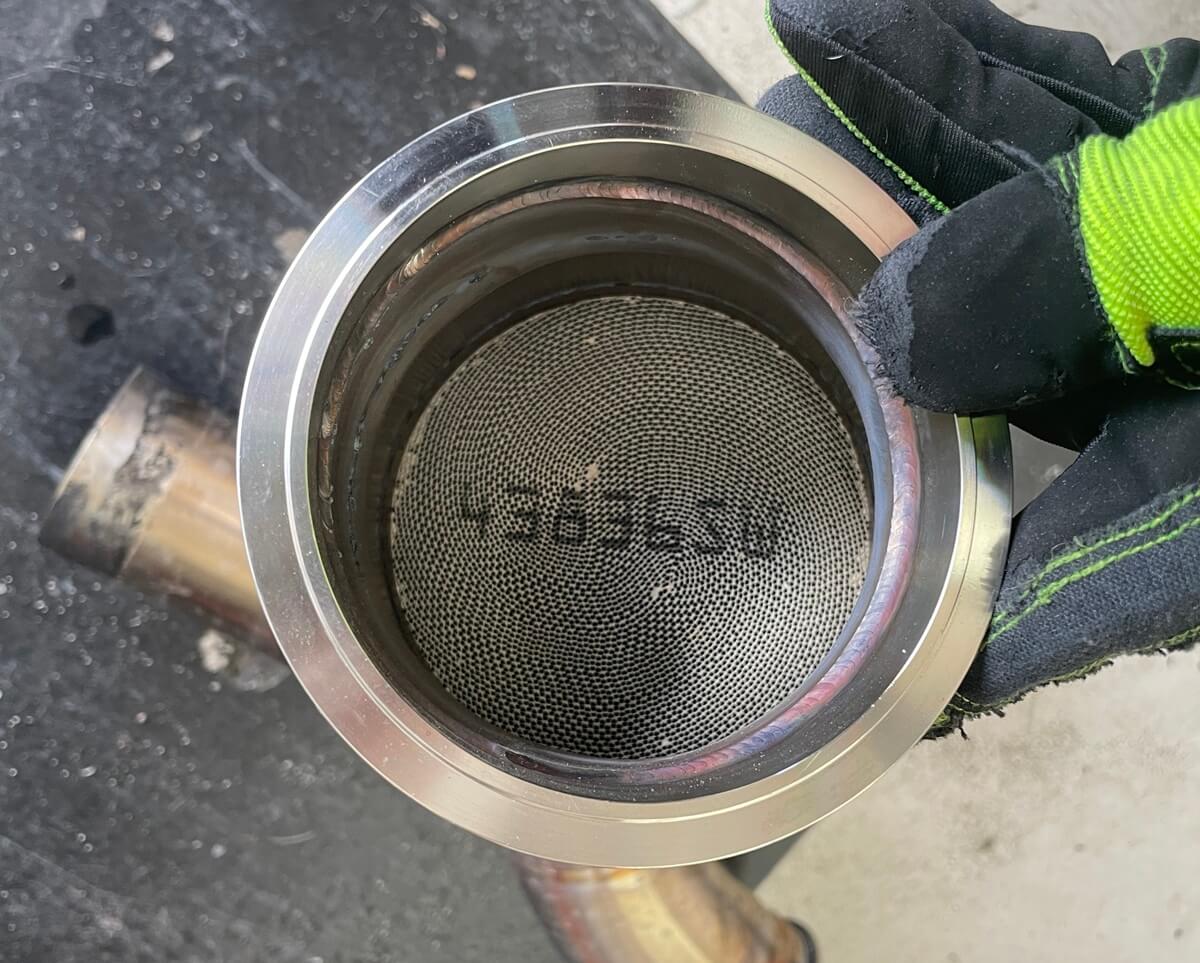
The expectation is that the matrix inside the catalytic converter will somewhat mute the sound.
Setup:
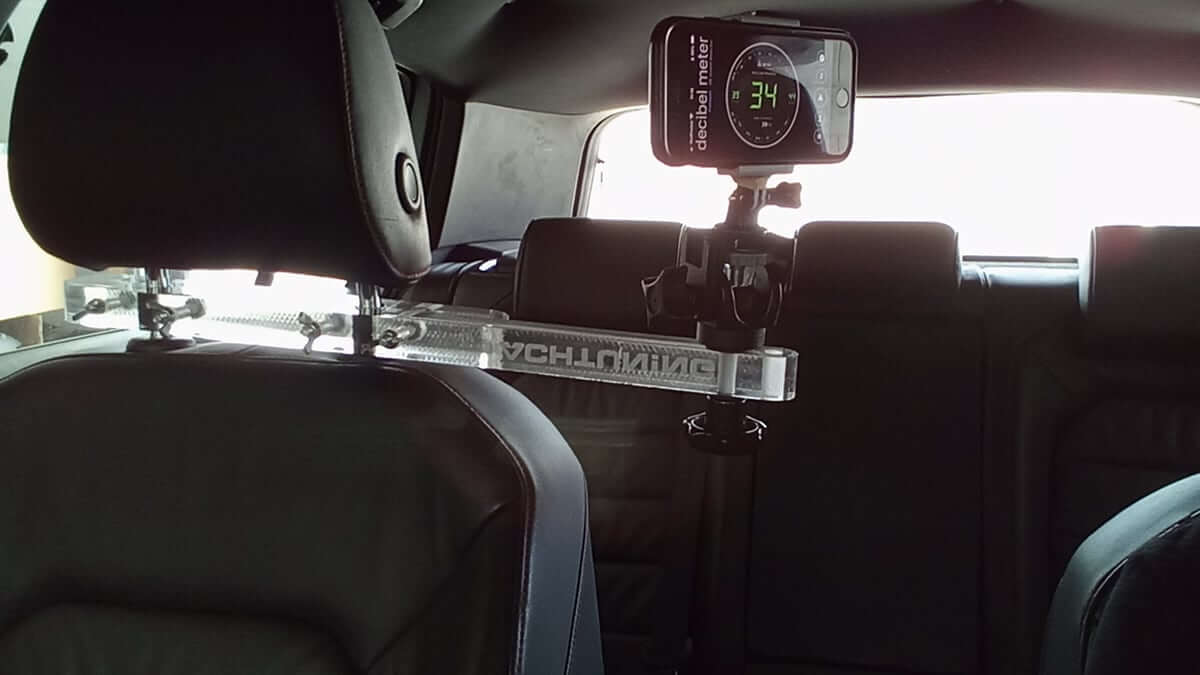
To record exhaust sound inside the cabin, an iPhone is mounted between the front seat headrests, and an application that measures sound level, peak, and average frequencies over time is used.
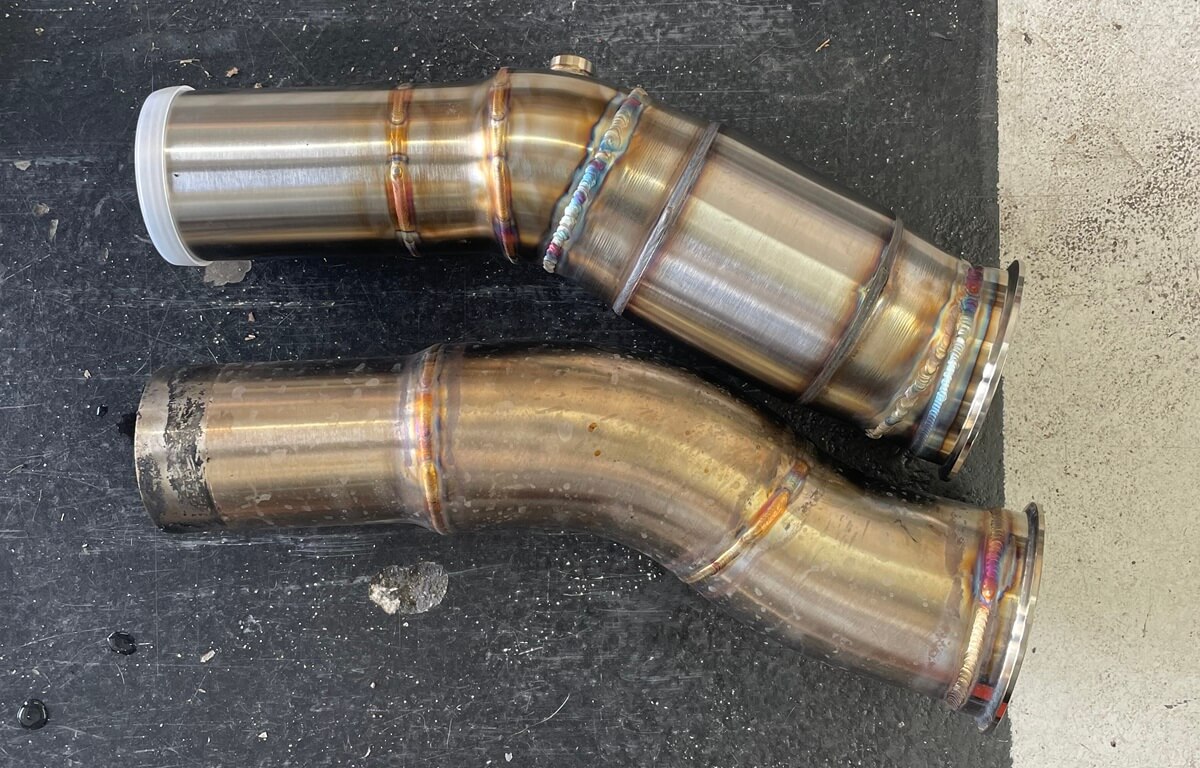
The measurements will be compared with the readings recorded using the catless midpipe section.
Results:
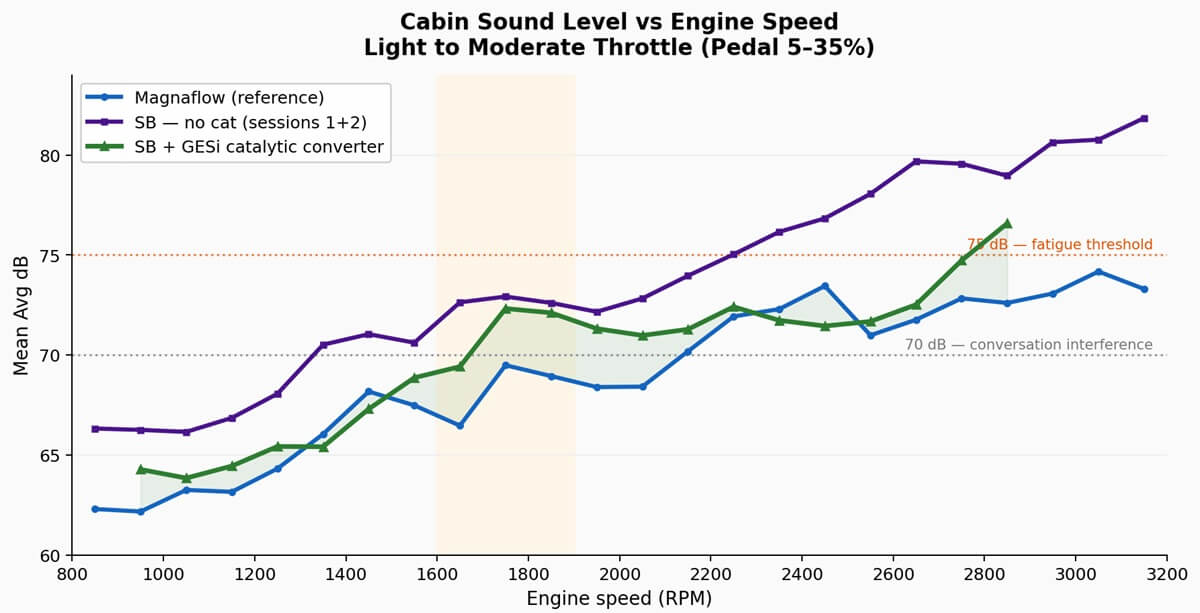
The Sound level (dB) versus RPM chart shows a three-way level comparison with threshold lines and the green-shaded gap between my baseline Magnaflow setup and the GESi configuration. This illustrates how much of the gap with the catless configuration has been recovered. There is a decent reduction in sound level across most of the engine operating range under evaluation.
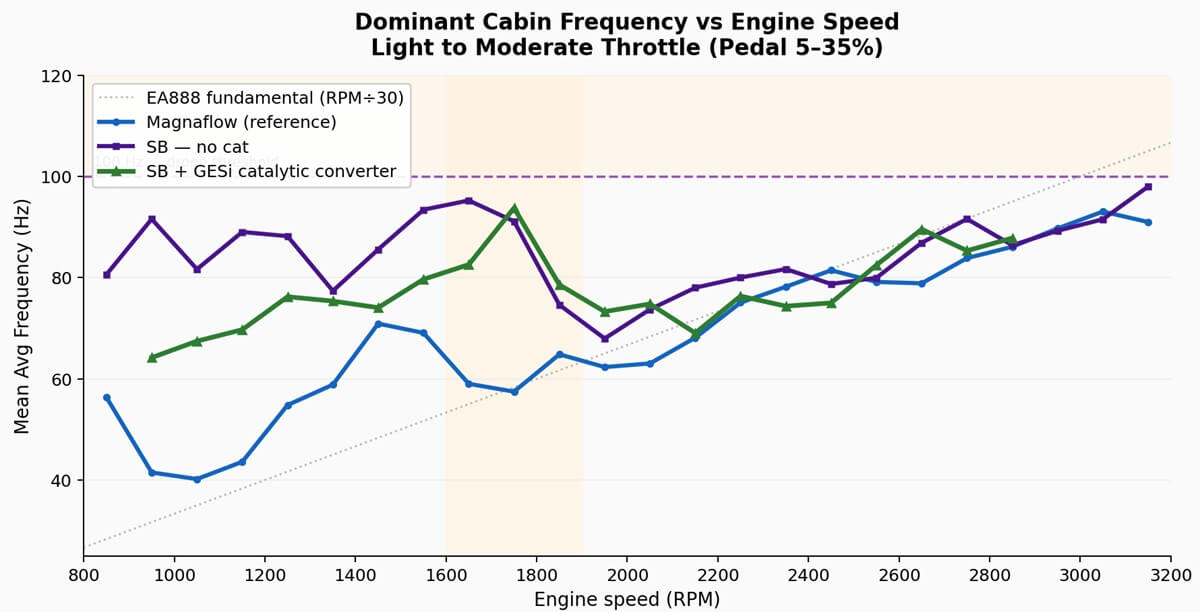
The frequency-versus-RPM chart shows the frequency-character improvement, with the GESi line pulling back noticeably toward the fundamental reference curve (dotted line) in the under-1,700-RPM range.
Cruise Investigation:
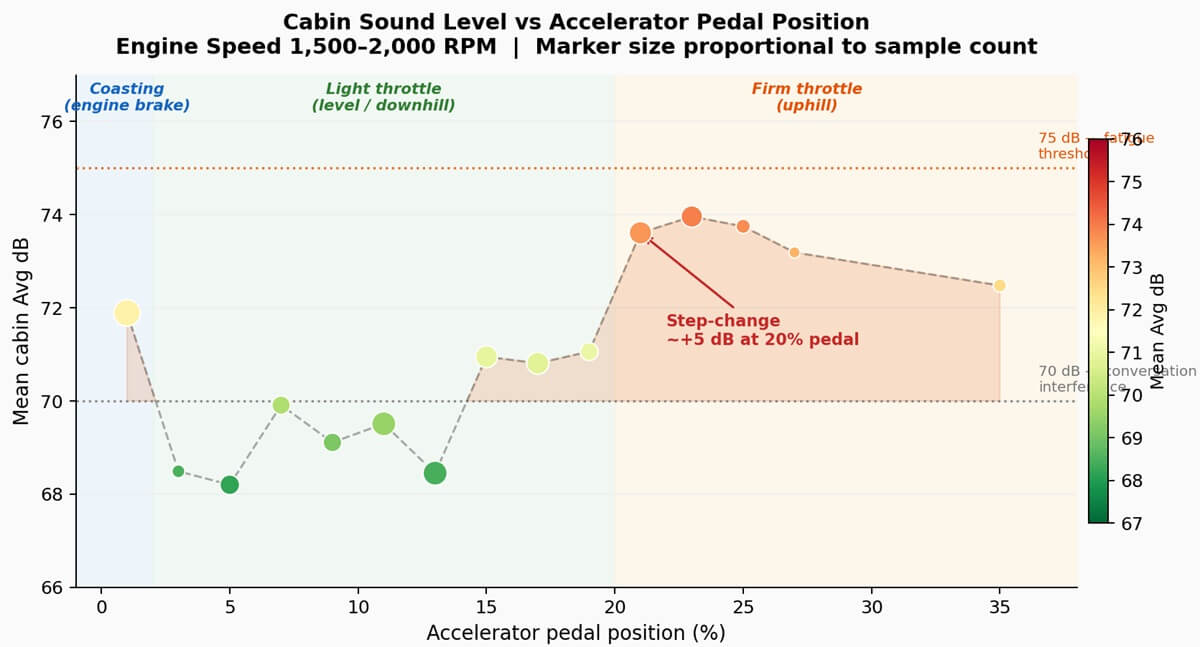
The next charts each use the same three-regime shading: blue for coasting, green for light throttle, and orange for firm throttle.
Coasting (0–2% pedal) presents an interesting anomaly. The dB level is elevated at 71.9 dB — higher than at light throttle — but the dominant frequency is low at 70 Hz, with 80% of samples sub-100 Hz. The sound is present and measurable, but at a frequency perceived as a deep exhaust note rather than a drone.
Light throttle (2–20% pedal) is the quietest acoustic regime. Mean dB drops to 68–71 dB, and the dominant frequency stays in the 70–92 Hz range. This represents a normal level road or a slight downhill cruise.
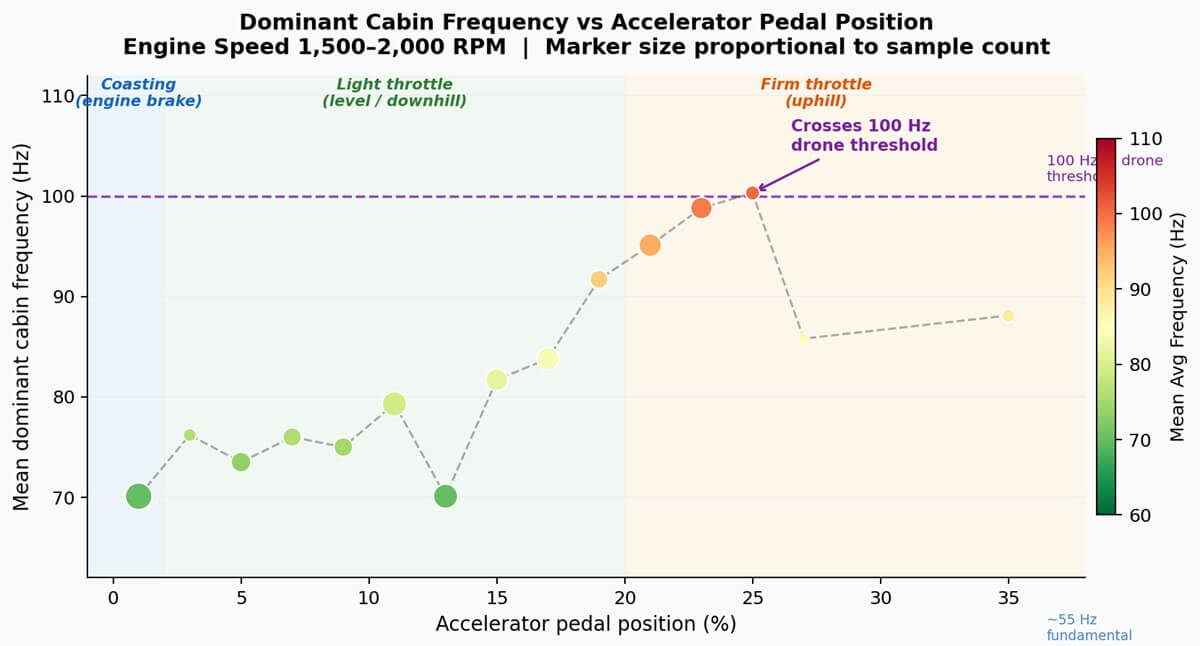
Firm throttle (20–25% pedal) is where the exhaust becomes more noticeable subjectively, and the data makes this clear. At 20% pedal, the mean dB jumps by approximately 5 dB from the light throttle average, crossing the 70 dB conversation interference line, and the dominant frequency simultaneously rises to 95–100 Hz, crossing the drone threshold.
This is a step-change, not a gradual increase. The Dominant Cabin Frequency chart shows the dominant frequency crossing the 100 Hz drone threshold at approximately 24–25% pedal, quantifying the point at which the uphill-grade sound shifts from louder-but-tolerable to drone-dominant.
Dominant frequency shows a gradual rise at light throttle, followed by the crossing of the 100 Hz drone boundary at approximately 24–25% pedal, with the purple fill marking the region where drone-band frequencies dominate.
Conclusions:
The CC Design GESi-catted midpipe was installed on the Mk7 GTI to record sound and frequency data.
This addition resulted in a reduction in the cabin sound level across most of the evaluated engine operating range and a reduction in the dominant cabin frequency below 1700 RPM.
A noticeable change in moderate throttle-induced noise is driven by the transition across the 20% pedal threshold, where a +5 dB increase in sound level and a shift into the drone frequency band occur simultaneously.