
Background:
I came across this video from a vendor named Tegiwa, published early in 2026. Since it was published, I’ve seen it referenced as proof that an open intake is inferior to a closed intake.
Beyond the fact that the conclusion others draw from it isn’t adequately supported, this “ultimate intake test” reminded me of a statement from a design of experiments course I attended, paraphrased: “all experiments are designed experiments; some are well designed, others are not.“
Basically, just because you did a test/experiment doesn’t mean the results are good; you have to evaluate the quality of the experimental process and the information that was collected.
Motivation:
Initially, when I first saw the video, I commented to the presenters that it would have been a better test if they had compared more than a single dyno pull for each intake. The creators responded that they had made three pulls and compared the best peak-number pull, discarding the other two data points. Learning this shifted my concern from insufficient data to biased data. (Selecting the best pull inflates every result, but more importantly, it discards the information needed to gauge how repeatable the measurements are.)
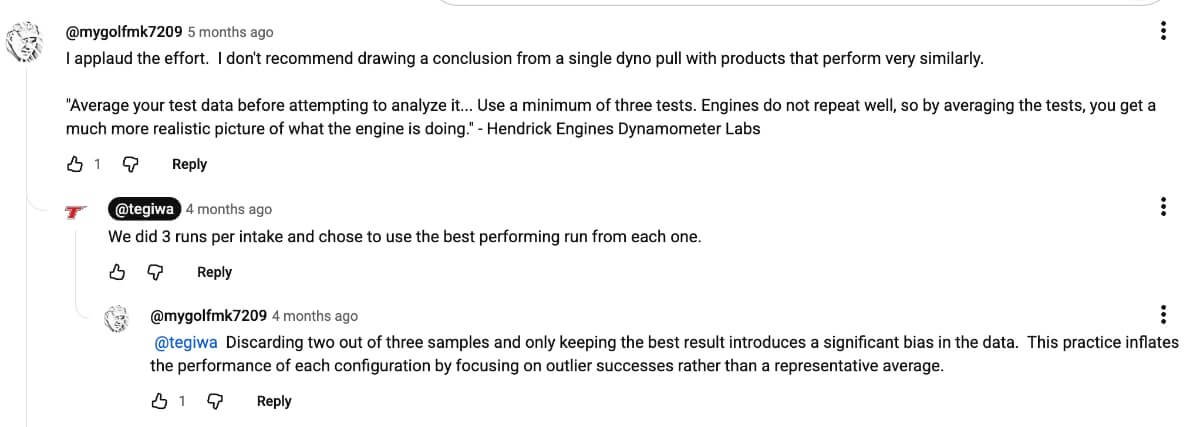
At that point, I was done discussing the video, given how it was done, and there wasn’t much point in bringing up other concerns I have with the test.
That was before I started seeing the video being referenced as evidence for how some types of intakes perform.
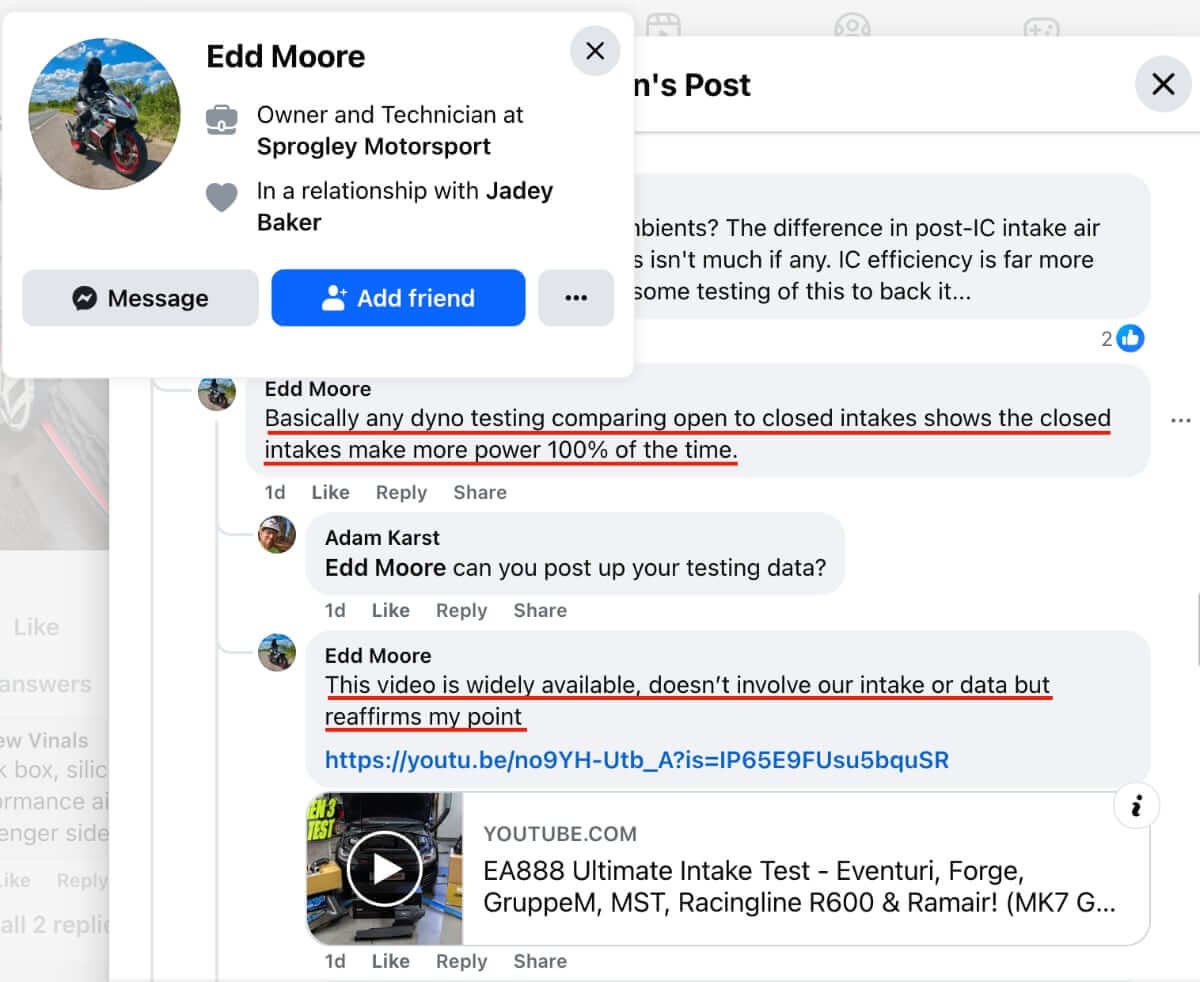
If this were coming from a general enthusiast, I might have replied directly and pointed out problems with the test process, but the developer of the Sprogley ST-X intake cited the video.
Note: In a March 2025 post, I discussed the advertising for the Sprogley intake.
With the Tegiwa video now being cited as evidence of how intakes compare, I decided it would be useful to delve into my concerns about the video’s methodology.

Results summary:
To begin, the following table summarizes the products, configurations, and the published test results from Tegiwa.
| Intake | Style | Ambient (°C) | Peak IAT (°C) | Turbo Inlet Elbow | Duct | As designed deviation | Peak WHP |
|---|---|---|---|---|---|---|---|
| Stock | Closed | 6 | 66 | Stock | Stock | 297.4 | |
| RAMAIR | Open | 7 | 73 | Ramair | Stock | No rubber trim | 304.2 |
| MST | Closed | 10 | 69 | MST | Stock | 305.3 | |
| Racingline | Closed | 11 | 68 | Racingline | Racingline | 306.2 | |
| Forge | Closed | 11 | 72 | Forge | Forge | 300.5 | |
| Eventuri | Closed | 10 | 70 | Stock | Eventuri | No Scoop | 306.5 |
| GruppeM | Closed | 9 | 67 | Stock | GruppeM | 307.6 |
Concerns:
Concern #1 – Insufficient data
As I noted above in my comments to the video’s creators, they didn’t compare enough data. This becomes increasingly important when differences between test-article performance are small, as in this test.
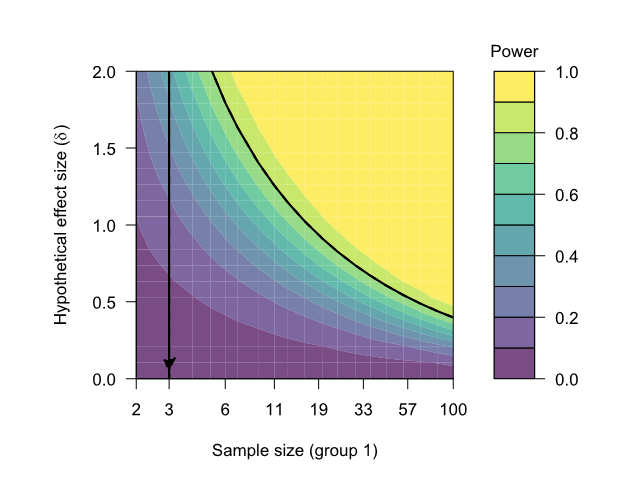
In the past, I’ve discussed the details of a Power Analysis, which helps to assess if adequate data has been collected during a test. Using dyno measurement variance I have logged in the past, 4.62 whp^2, and the Peak WHP values reported by Tegiwa, treated as Means (which they are not), this test required a minimum of 3 pulls to calculate an average for comparison – with a 20% chance of missing a real difference of that size.
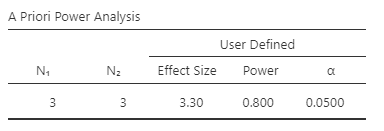
Note: The 3.30 effect size is based on the largest difference among the aftermarket intakes (GruppeM vs. Forge, 7.1 whp) and a standard deviation of 2.15 whp (the square root of the 4.62 variance).
When the peak WHP difference decreases, the number of pulls to distinguish a difference grows, as the following table illustrates:
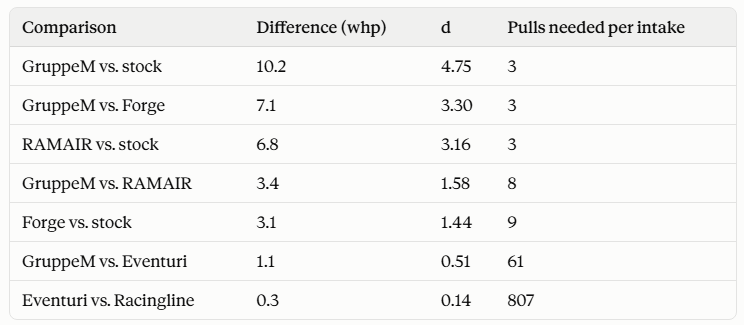
Bottom line: Tegiwa made three pulls, then discarded two. The data needed to test the largest comparisons existed and wasn’t used.
Concern #2 – Intake configuration
Another concern is that some intake kits didn’t come with a turbo inlet elbow or an air duct and were tested with stock GTI parts. This confounds the results because a systematic setup difference affects every pull the same way. More pulls can’t fix this, because the difference affects every pull the same way.
Neither of these common modifications was made for this test: The first modification is to open the front of the driver’s side with a Dremel-type cutoff wheel to allow air into the duct from behind the grille.
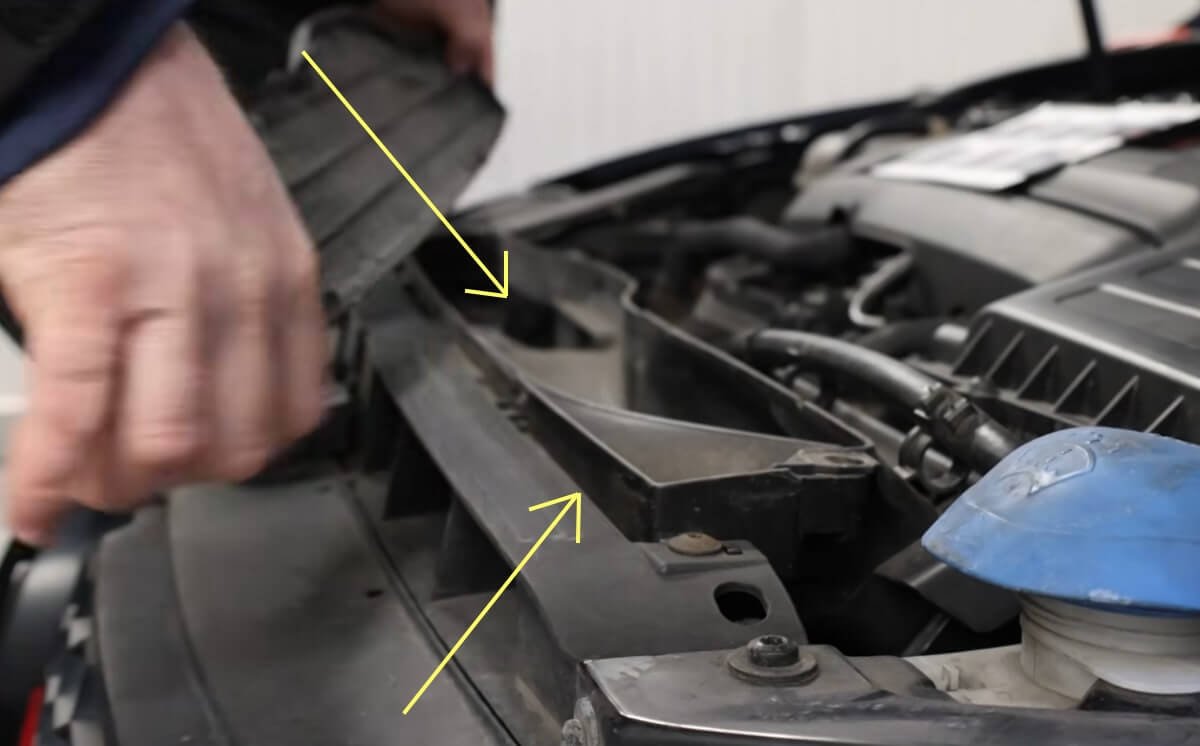
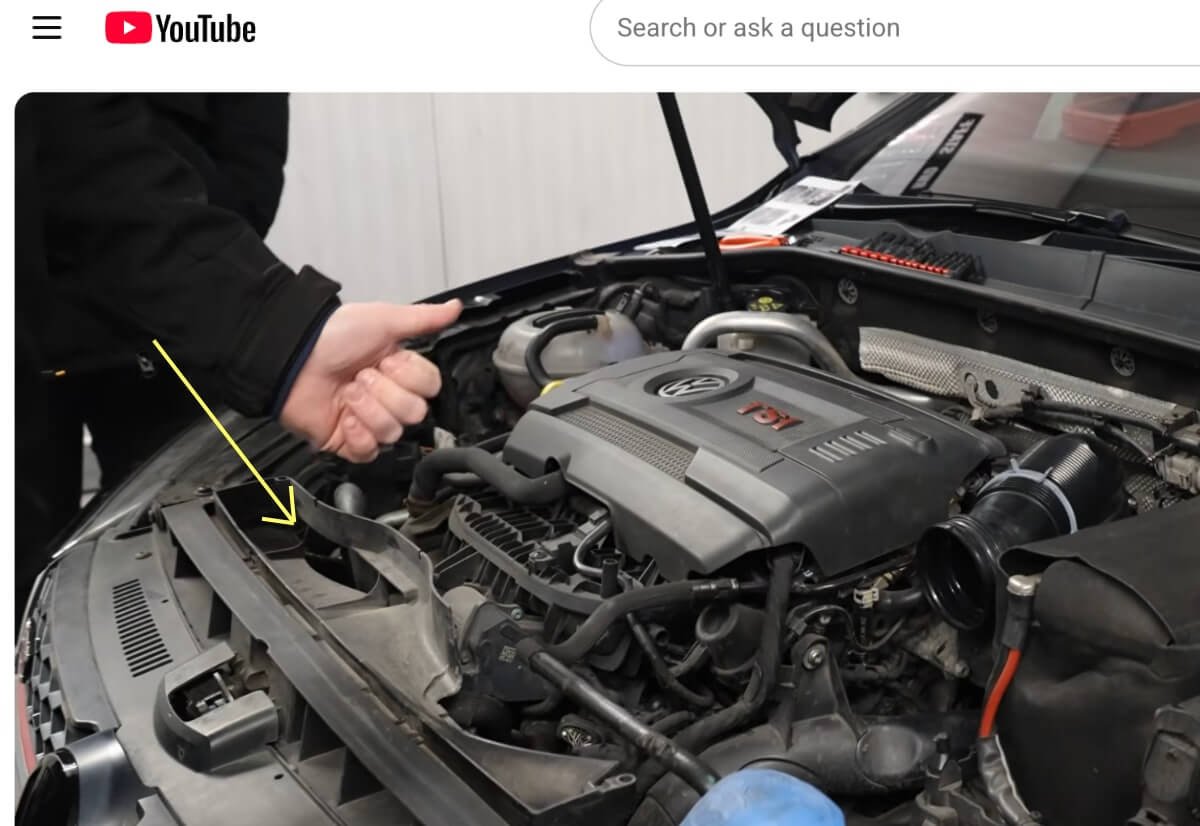
The other covers the back of the passenger side so heated air in the engine compartment isn’t drawn into the intake.
The other stock component used in this test was the stock inlet elbow. The stock elbow has no modification and is the lowest-flowing elbow of the 12+ I have tested. When flow rate through the part affects the outcome, this disadvantages some intakes since the dyno numbers measure complete configurations, and the test can’t separate the intake’s contribution from the rest.
Note: The two highest readings both used the stock elbow, which suggests the elbow wasn’t the limiting restriction at this ~300 whp level. The problem remains that the test can’t separate the intake’s contribution from the rest of the configuration.
Ramair:
A concern specific to the Ramair Intake, the only open intake tested, was that the rubber trim attached to the heat shield was not installed.
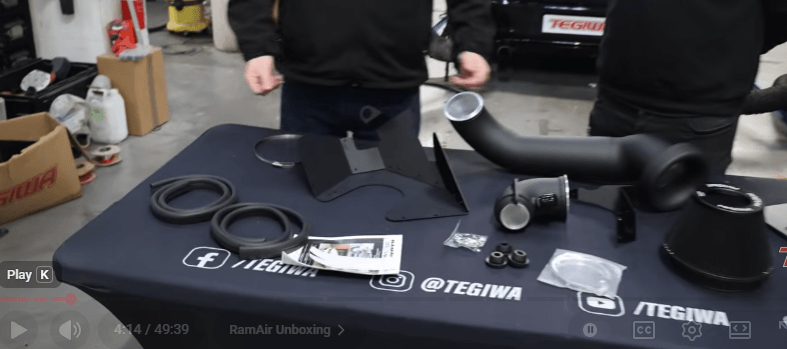
This rubber trim helps isolate the air filter from the engine compartment’s heated air, which is important for an open intake.
Any intake run with the stock duct could draw engine-bay air through the duct’s open rear. Being on the dyno likely made this worse.
Delta IAT (Peak IAT minus Ambient Temperature) for the Ramair intake was higher than for the other intakes, consistent with the concern that it may be drawing more engine-compartment air.

Referring back to the comment by the representative from Sprogley:
Tegiwa did a great video testing all the popular intakes they sell… Open being at the bottom of the pile…
Edd Moore – Sprogley Motorsport
In this test, the open intake was tested without the rubber trim, attached to a stock air duct, and was within 3.4 peak WHP of the highest measured intake.
Basically any dyno testing comparing open to closed intakes shows the closed intakes make more power 100% of the time. This video is widely available, doesn’t involve our intake or data but reaffirms my point.
Edd Moore – Sprogley Motorsport
Concerning the 100% of the time claim, the test being referenced fails to meet this claim; the Forge ‘closed’ intake reading (300.5) was less than the ‘open’ Ramair intake (304.2). That 3.7 whp difference is also within the test’s noise, which is the point: this data can’t rank these intakes in either direction.
A key takeaway from this is how a vendor citing a test as ‘reaffirming’ a point isn’t evidence the test supports it. You have to evaluate the test on its own.
Concern #3 – dyno testing intakes
My preference is to test components under the same conditions they will operate in. This can sometimes make it easier to control the factors that can affect how the parts perform.
The two primary performance considerations for an intake are pressure drop as air passes through components and the temperature difference between ambient air and what the turbocharger compressor inducer draws in.
Note: I’m omitting filtration as a performance consideration, although that is also important.
On the road, air pressure at the grille helps push air through the intercooler and radiator, and air moving under the car helps pull heat out of the engine bay. On a stationary dyno, the flow under the car is gone, and the flow at the grille depends entirely on the fans.
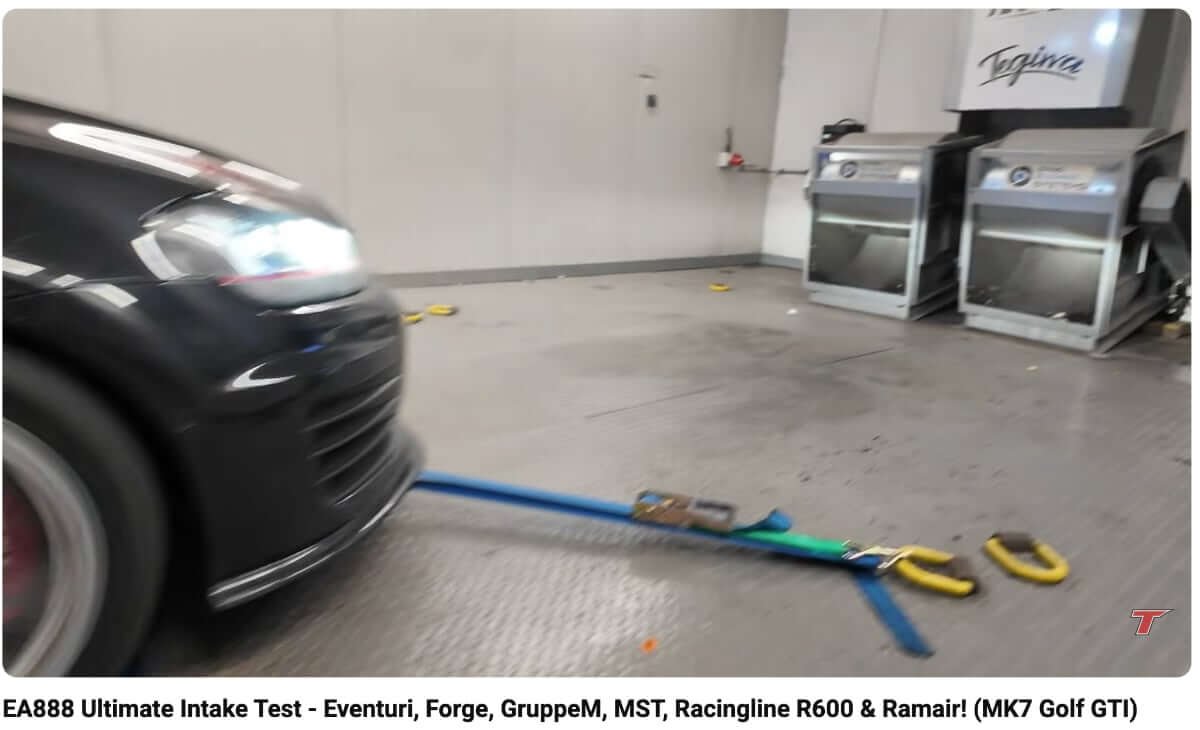
These concerns also interact with others. The dyno setup doesn’t penalize every intake equally. Intakes that draw some air from the engine bay (those using the open-backed stock duct) are exposed to engine-bay air temperature. If dyno cooling differs from road conditions, the engine compartment temperature could be worse than it would be on the road.
Conclusions:
The Tegiwa video is a demonstration, not a controlled comparison. Returning to the design-of-experiments point at the start: it is a designed experiment, just not a well-designed one.
Multiple dyno pulls were reportedly performed, yet only the best result from each intake was presented. The test configurations were not fully standardized, as some systems were evaluated with stock supporting components while others were not. In addition, the chassis dyno environment introduces variables that may not accurately represent the operating conditions under which intake systems are intended to function.
None of these issues prove that the published ranking is wrong. They just mean the test doesn’t provide enough evidence to confidently conclude that the observed differences reflect real performance differences rather than test variation and configuration effects.