Background:
The belief that a bicooler configuration is associated with a slower rate of boost pressure rise is logical from the standpoint of having a larger volume to pressurize, but past comparisons have shown that the time difference to pressurize the different volumes is negligible.

Despite having tested the products and documented the evidence to dispel this belief, there are still examples of incorrect information being spread to consumers:
In this post, data from several turbochargers of different sizes are presented to show that the results are consistent regardless of the turbocharger’s size.
Test Process:
This post will examine data logged with the following turbochargers:
- IHI IS20
- Shuenk IS38+
- Shuenk IS48
- Mabotech M520h
The intercooler configurations are a Single, either stock location or front mount, and a Bicooler, which consists of a stock location IC connected to a front mount
Note: In the charts that follow, the term “Stock Location” refers to the “Single”.
The GTI is operated in 3rd gear, beginning with steady-state driving at around 1800-2000 RPM, then the accelerator pedal is fully depressed. This is held while boost pressure increases until it passes 20 psi, as measured by an analog boost pressure gauge, at which point the operator lets off the throttle, allowing the boost pressure to drop and the vehicle to slow. Once the vehicle has slowed to an engine RPM below 2000, the process is repeated.
This procedure is performed with both intercooler configurations, using the four turbochargers.
The engine RPM is measured at boost pressures of 1 psi and 20 psi, and the difference is used to determine the Boost Onset RPM. The times at 1 psi and 20 psi are also measured, and the time difference is calculated.
Due to the direct effect of engine RPM on the boost onset, two engine speeds are identified to compare the boost response at: 2000 and 2500 RPM. These engine speeds are tied to the boost pressure reaching 1 psi. Data points within a ±250 RPM window around the comparison RPM are used to increase the number of samples, given the limited data points that fall precisely at 2000 and 2500 RPM.
In the Violin plots below, the data points from the -250 window are shown on the left side of the plot, and values from the +250 window are shown to the right.
Due to the sample size and variability, the Median value is the metric of comparison.
Test Results:
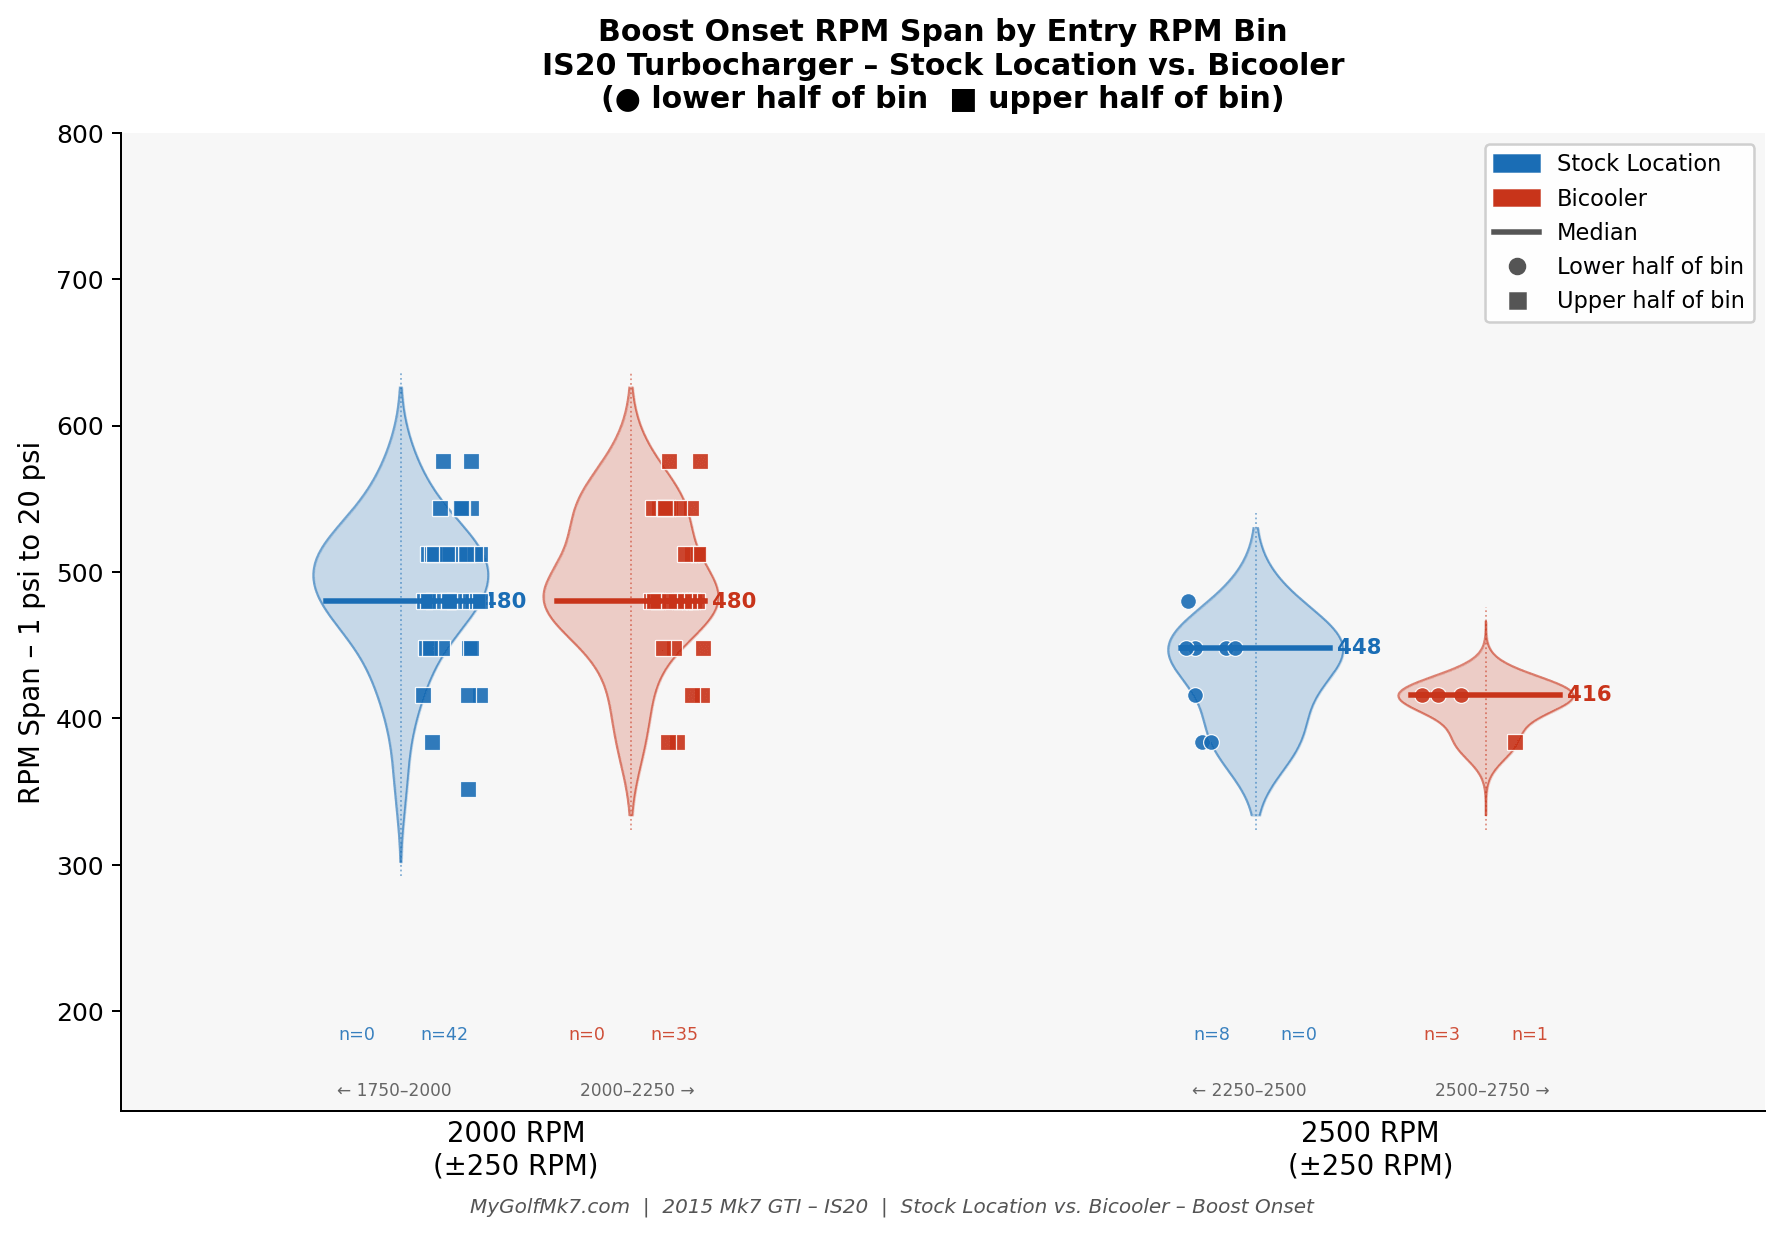
IS20 Turbocharger:
No significant difference in boost response rate at 2000 or 2500 RPM ( 0 and 32 RPM).
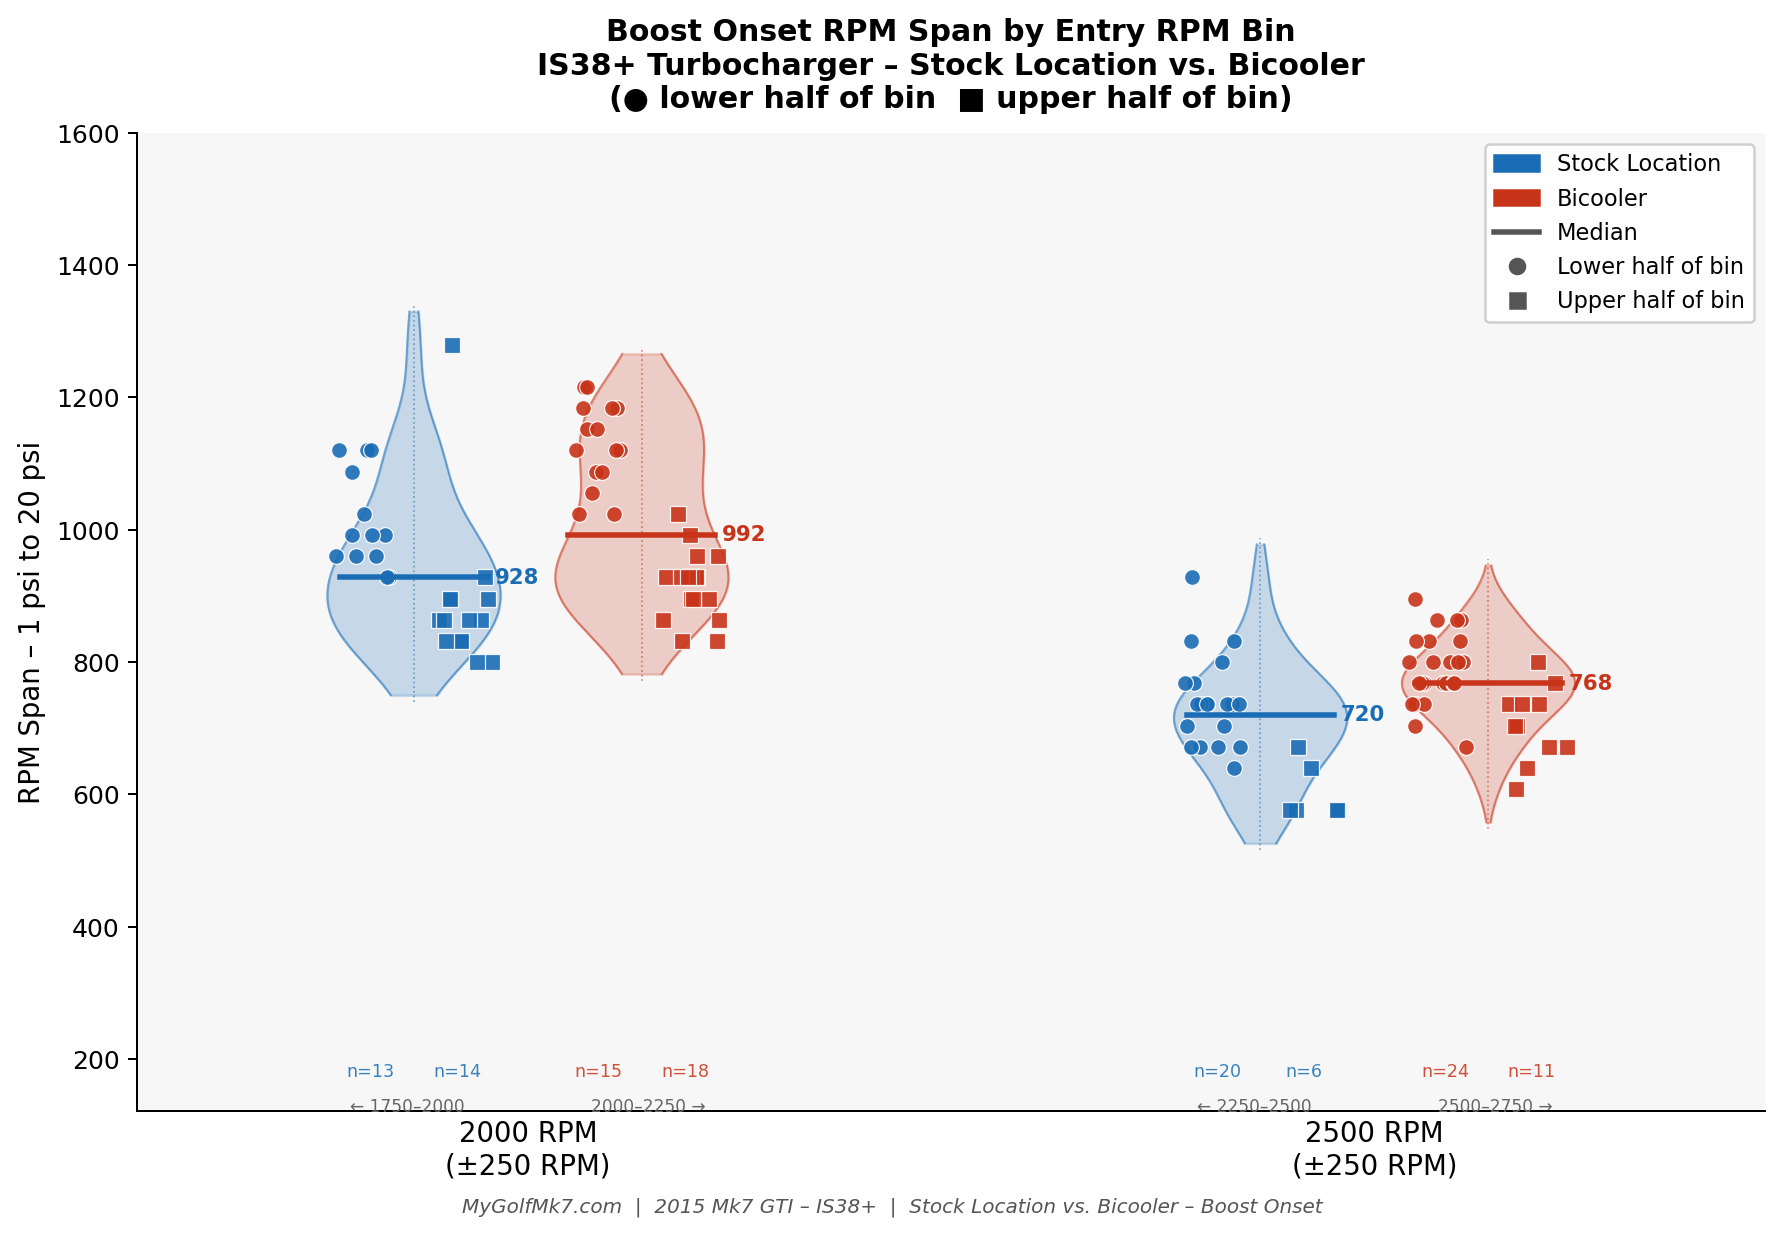
IS38+ turbocharger:
The Bicooler requires a greater RPM span for the boost to rise, but the difference is not significant (64 and 48 RPM).
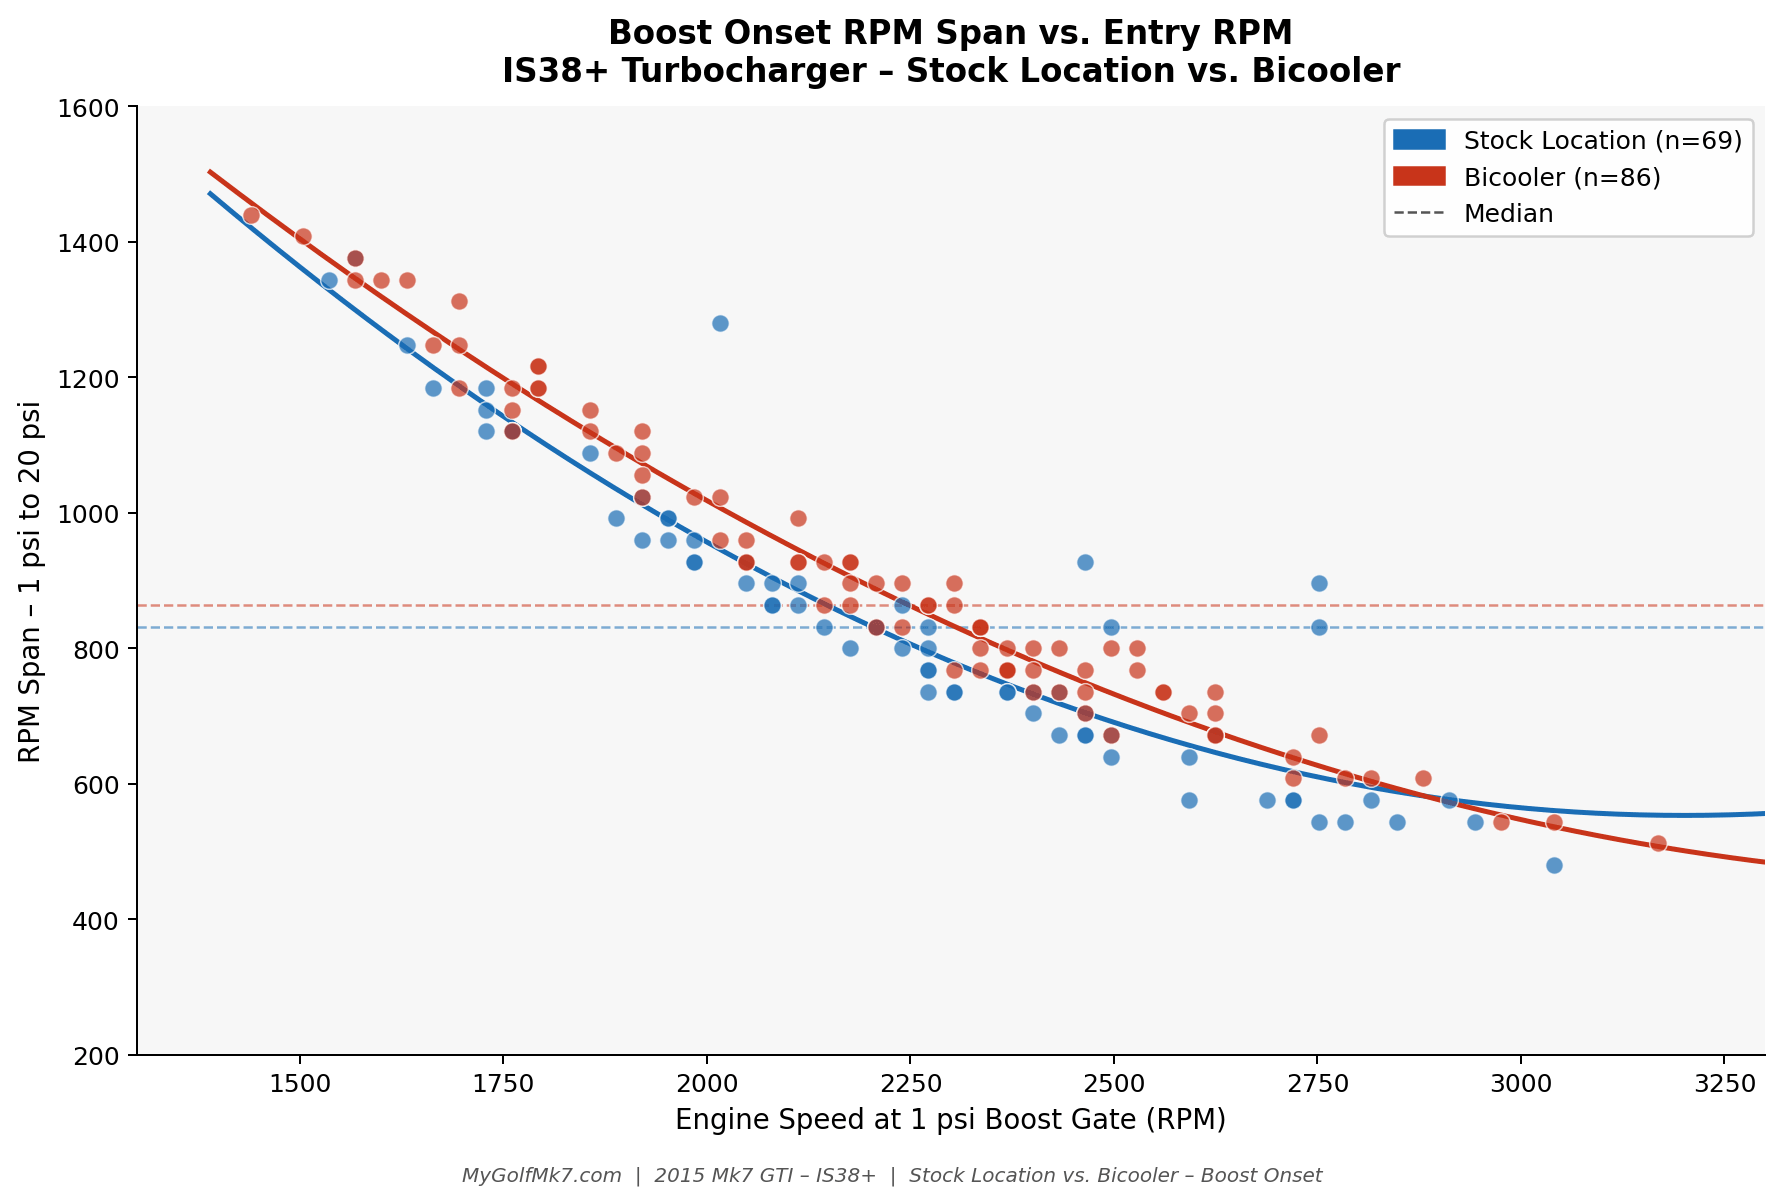
The scatterplot below, with a second-order polynomial curve fit, illustrates how the response rates change with engine speed.
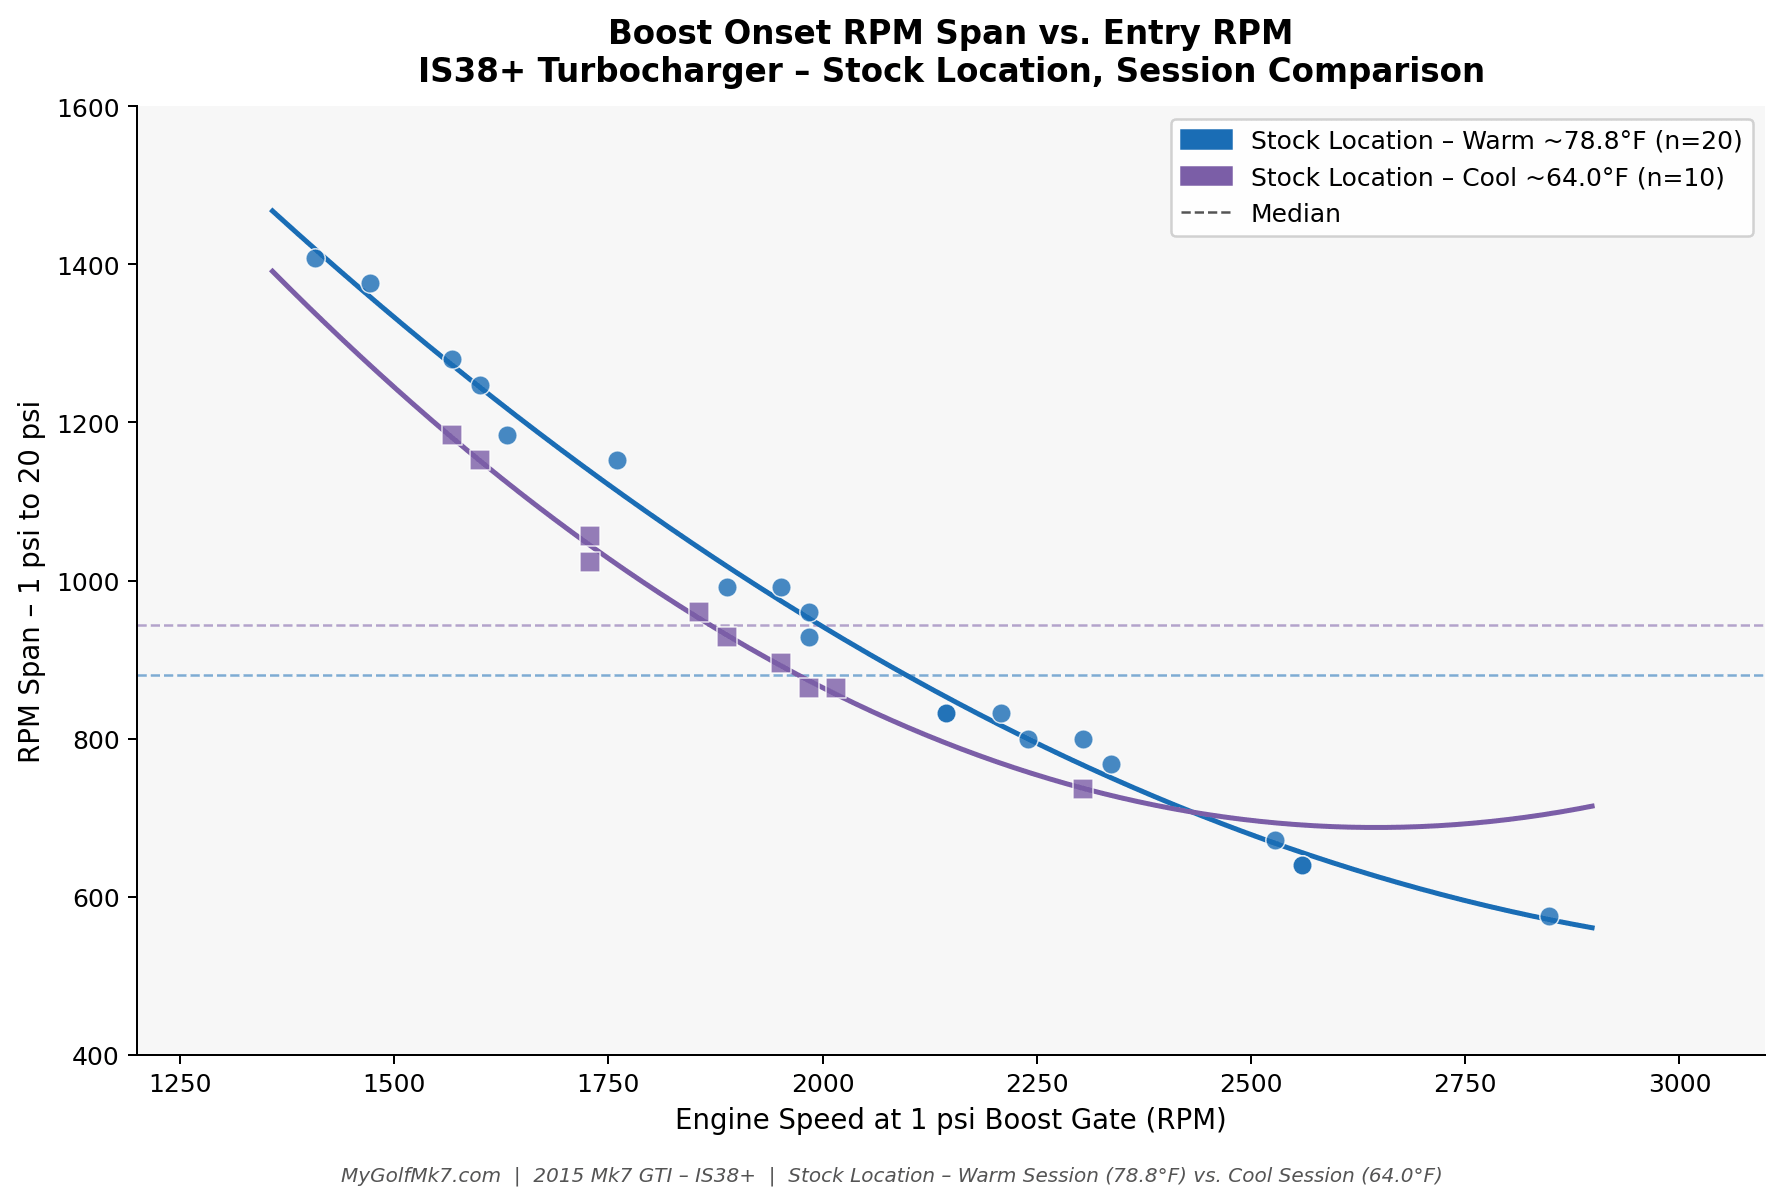
Temperature Contribution:
The next chart illustrates the effect of ambient air temperature on the boost response rate. The approximately 15-degree Fahrenheit difference in ambient air temperature causes a greater difference in boost onset RPM than the change in intercooler configuration does.
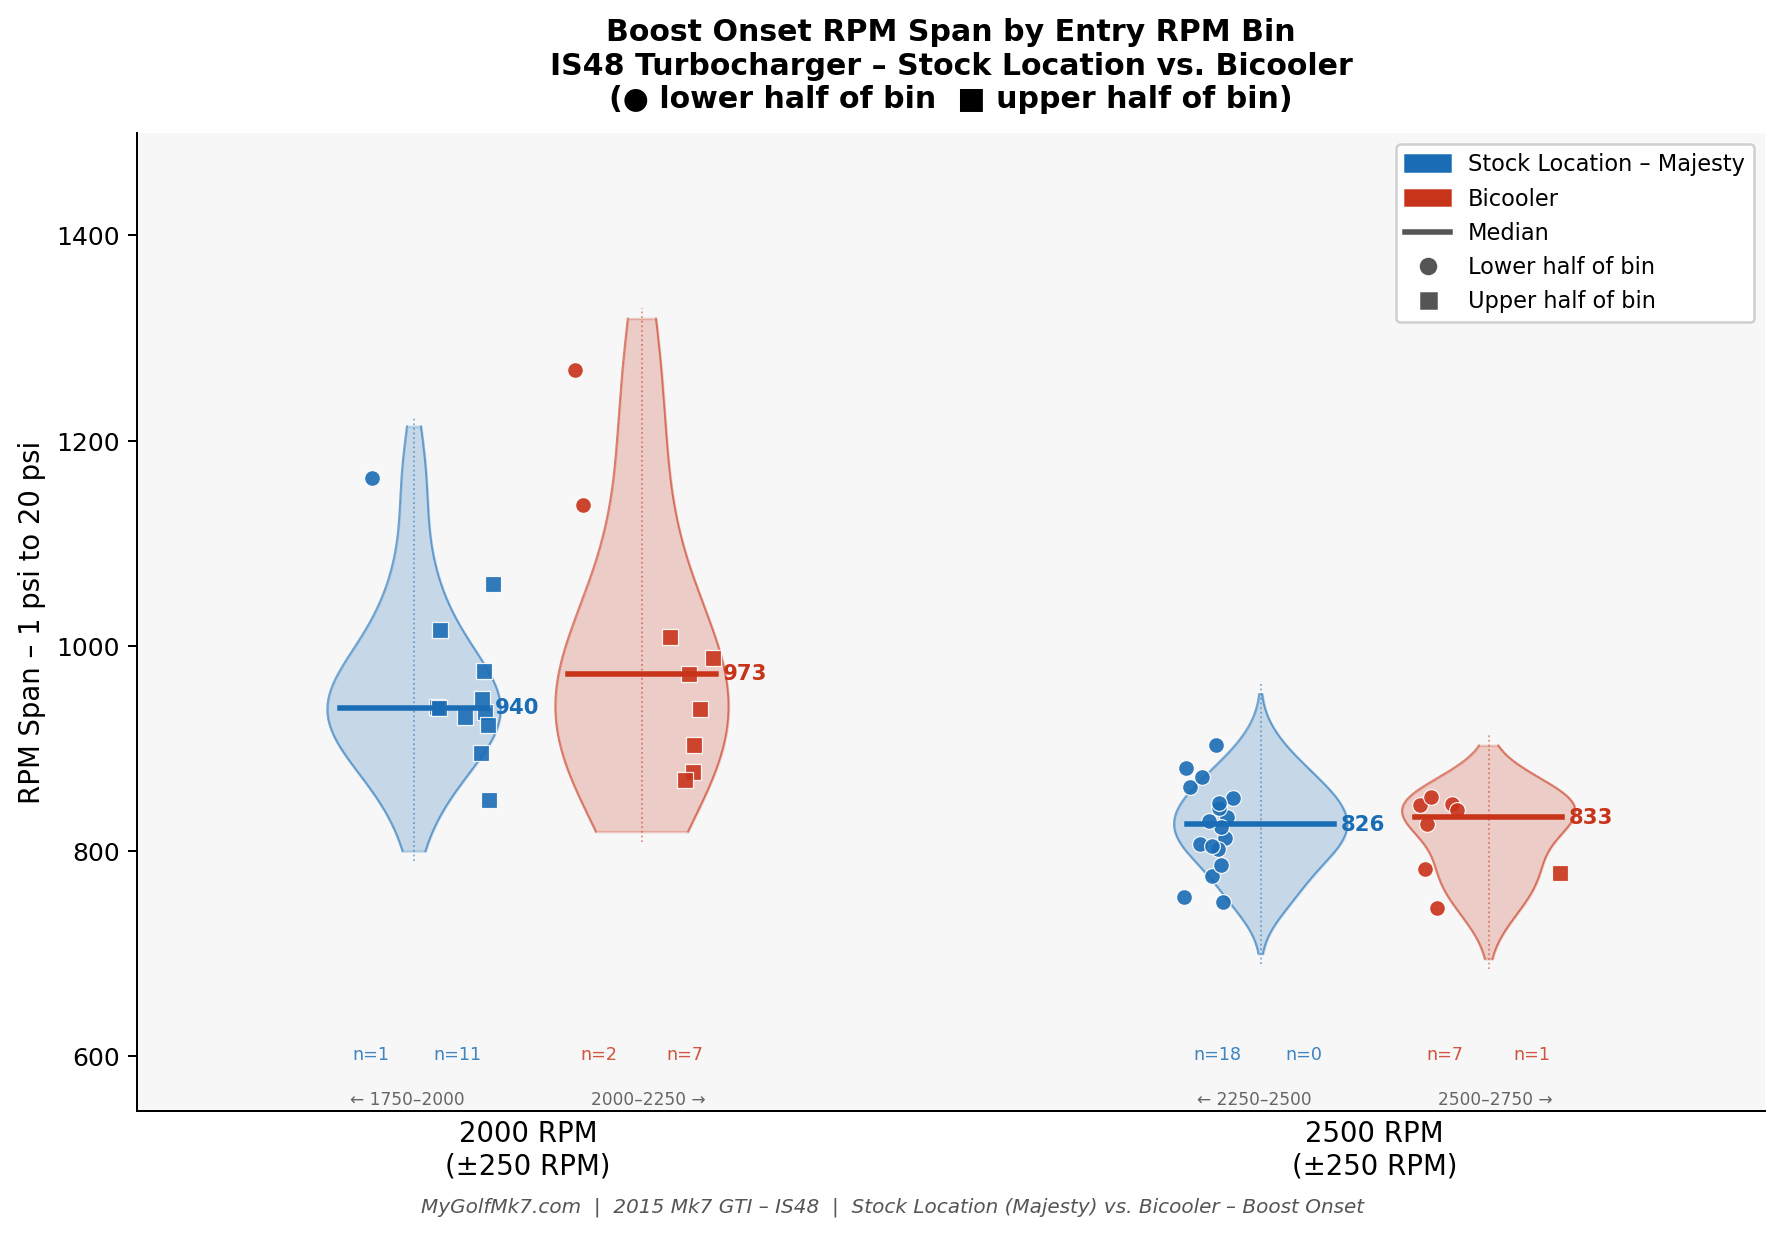
IS48 turbocharger:
The Bicooler requires a greater RPM range for the boost to rise, but the difference is not significant (33 and 7 RPM).
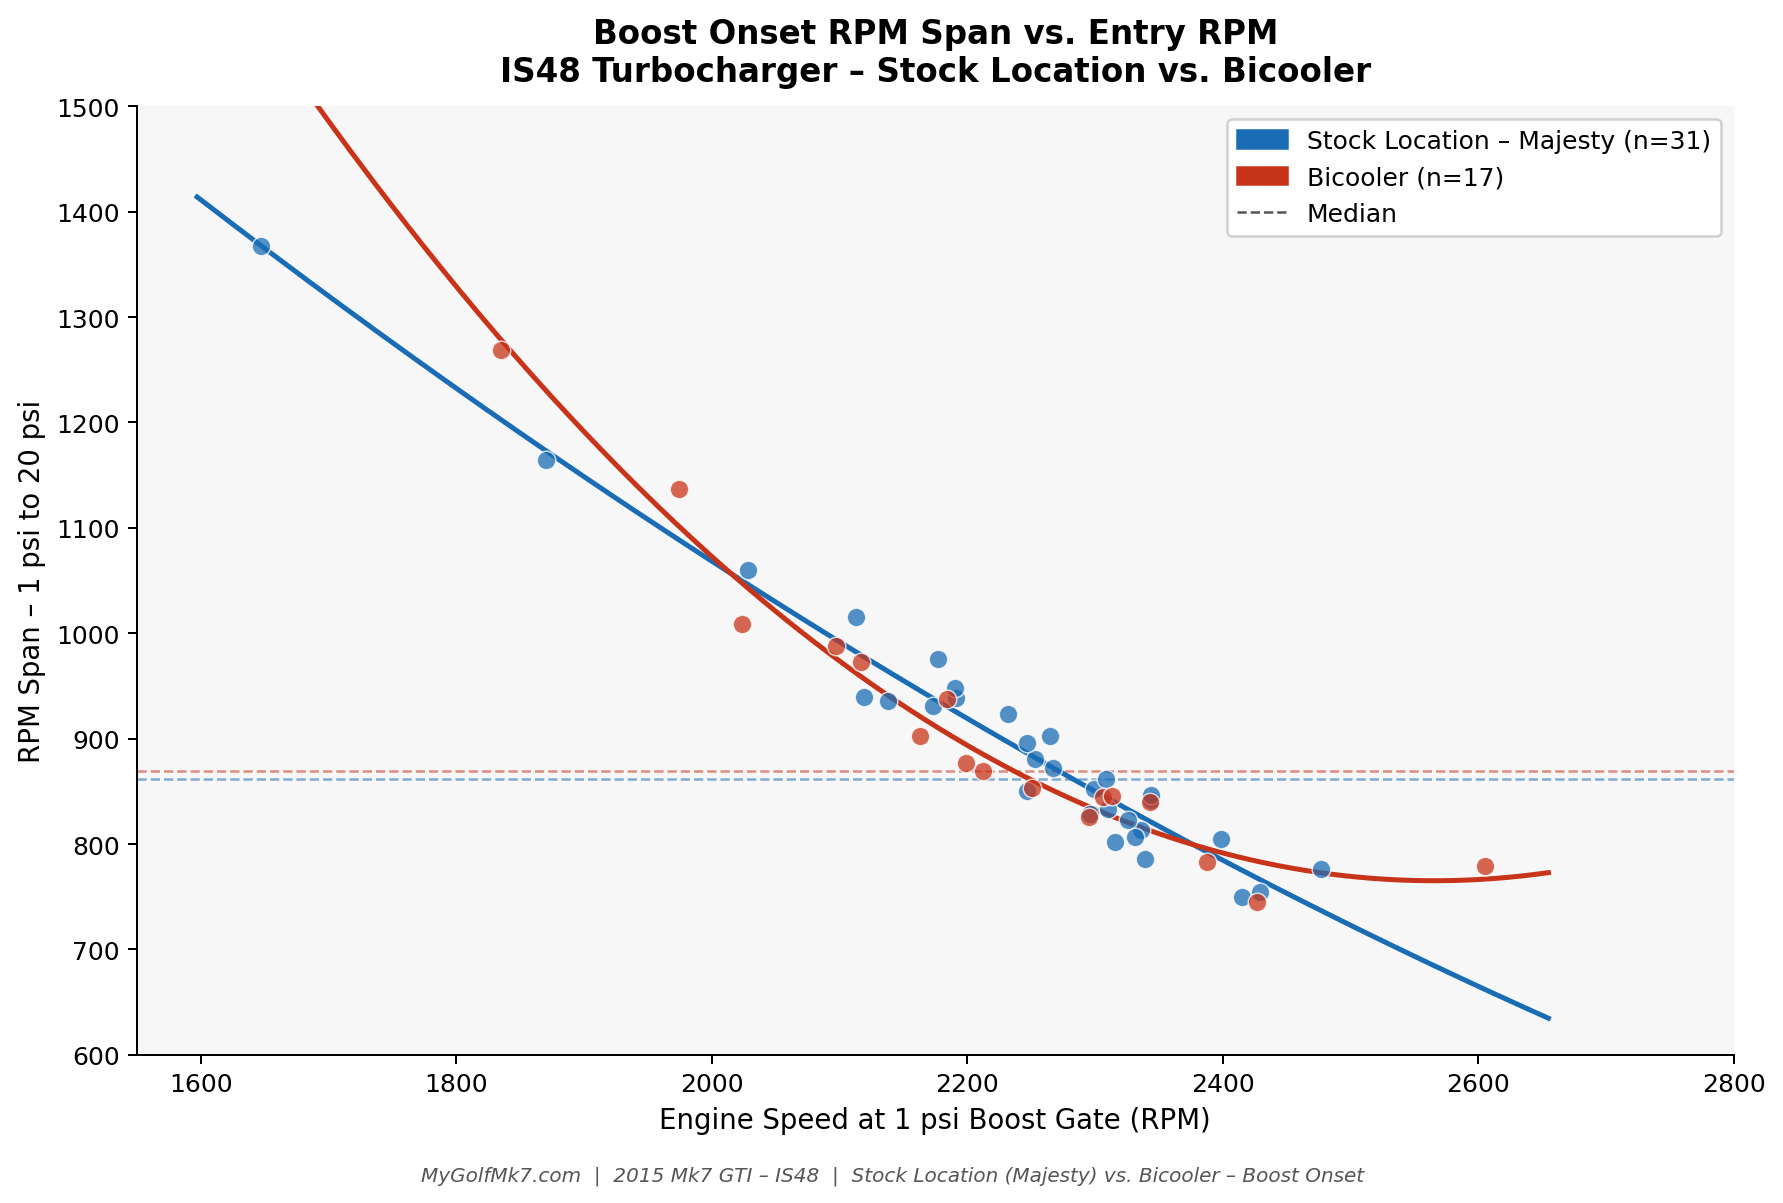
The scatterplot for the IS48 clearly illustrates how the data points overlap at certain engine speeds.
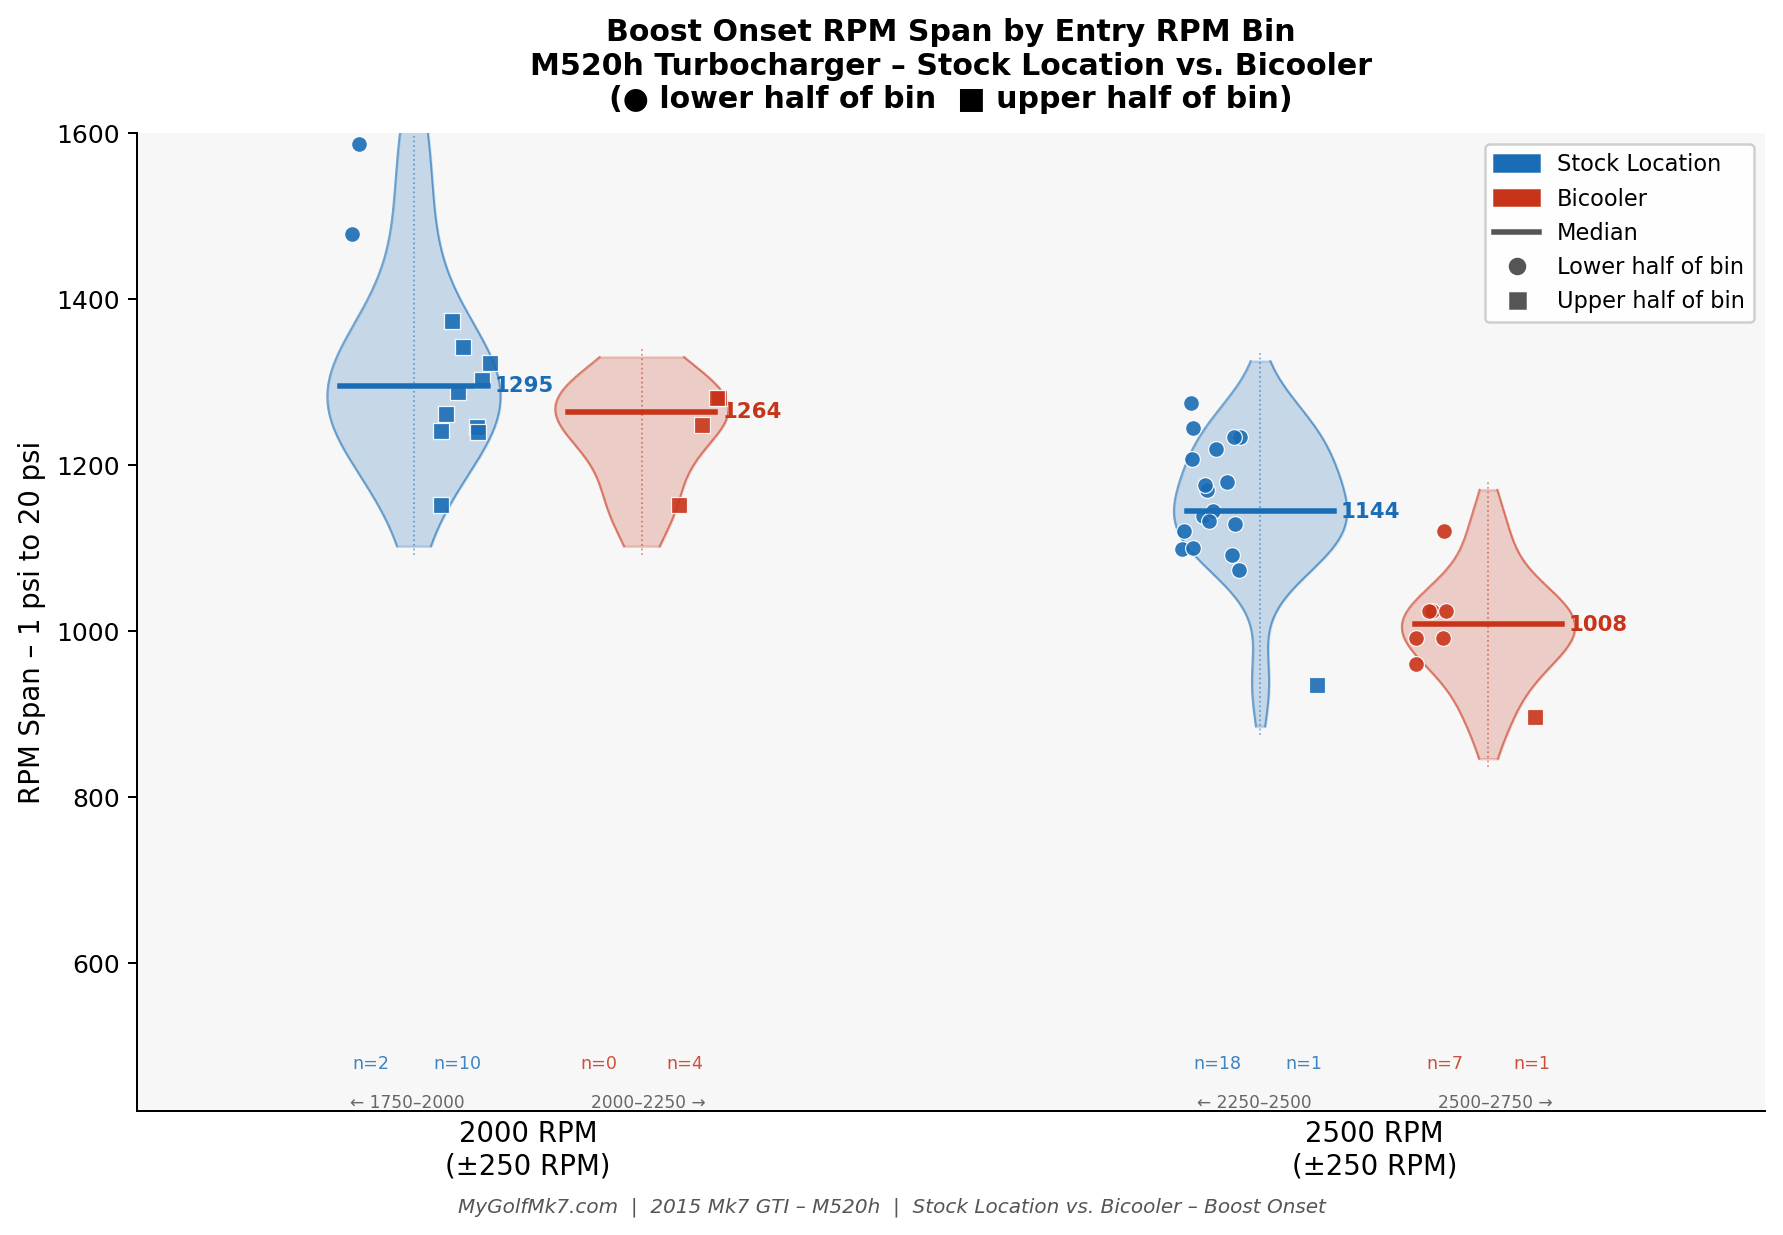
M520h turbocharger:
The Bicooler requires a smaller RPM range for the boost to rise, but the difference is not significant (31 and 136 RPM).
Time domain:
A more relatable measure of lag is seconds. The table below summarizes the time required for the boost pressure to rise from 1 psi to 20 psi between the Stock Location IC and the Bicooler configuration.
The most important column is the far-right column, where the difference in the pressure rise time for the Stock Location IC is compared to the time rise with the Bicooler. The time difference (delta) is shown for each turbocharger and the sampled engine speed.
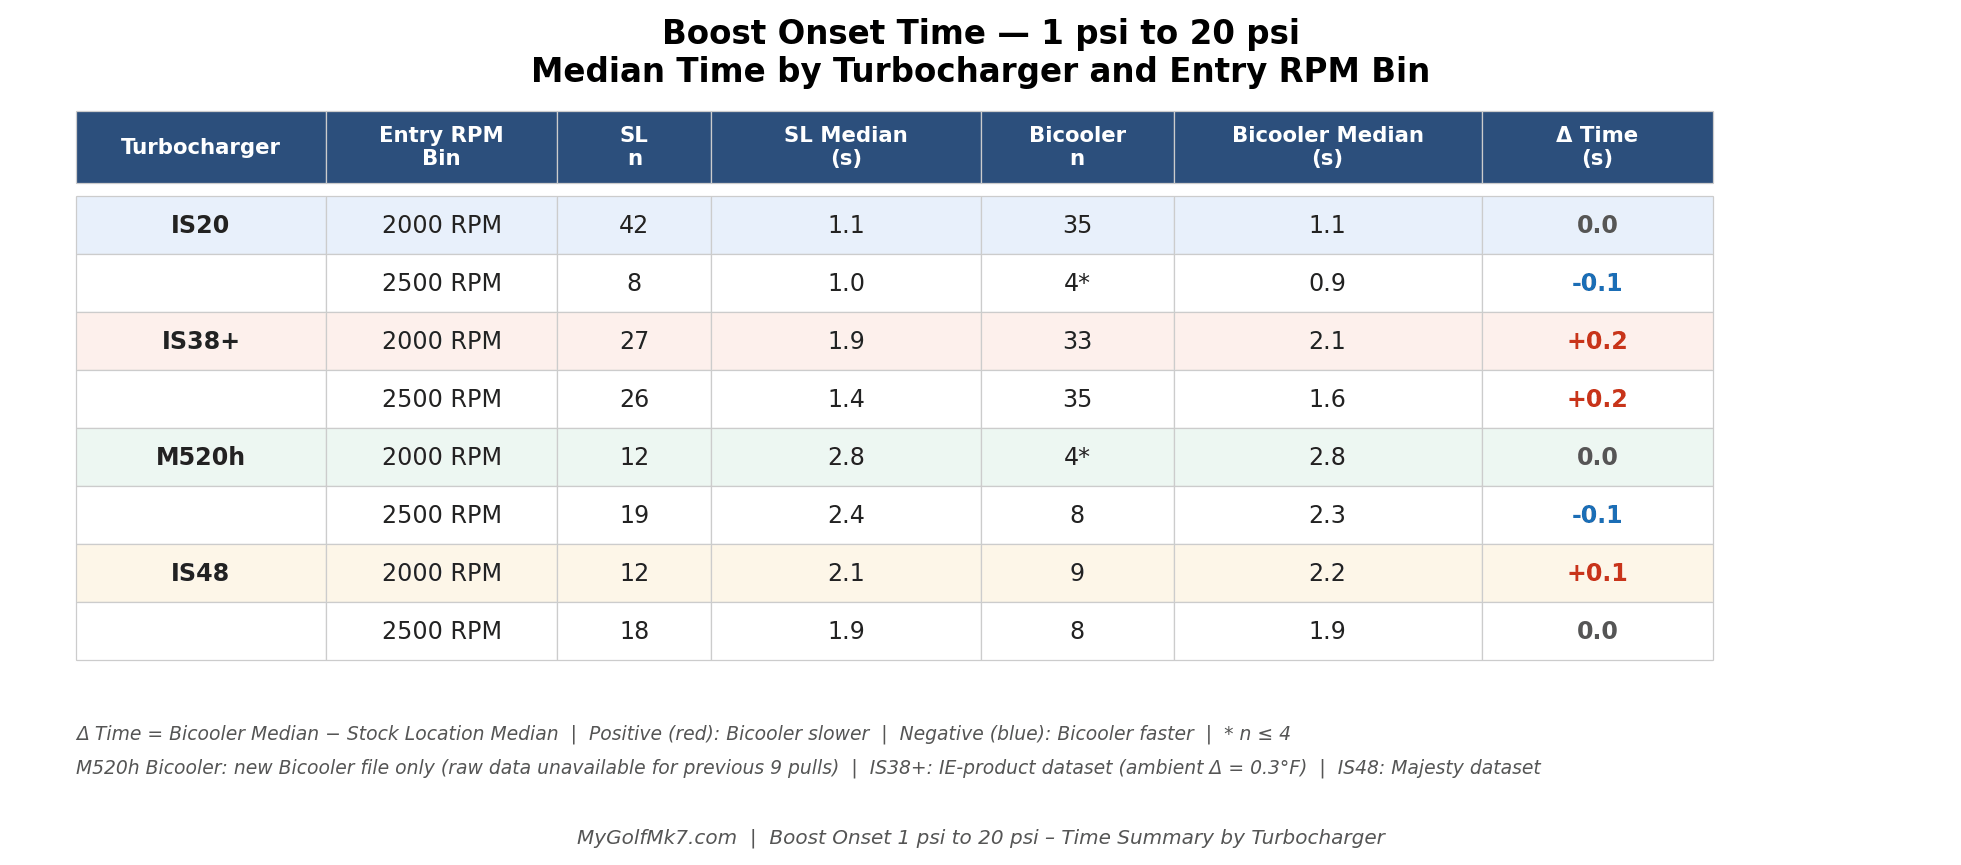
The takeaway from this summary is that across all combinations analyzed, there is a negligible (<0.2 seconds) difference in the time required for the boost pressure to increase from 1 psi to 20 psi.
Conclusions:
The Bicooler configuration does not introduce meaningful turbo lag compared with a single intercooler.
The data does not support the concern that a Bicooler configuration meaningfully increases turbo lag relative to a single intercooler. Across the range of turbochargers tested — from the IS20 through the M520h — the measured time differences are at most 0.2 seconds and are not perceptible under normal driving conditions.
Whatever volume pressurizing penalty the additional intercooler volume introduces, it does not translate into a measurable penalty in real-world boost-onset timing.